

Development of a core Clostridium thermocellum kinetic metabolic model consistent with multiple genetic perturbations
- PMID: 28469704
- PMCID: PMC5414155
- DOI: 10.1186/s13068-017-0792-2
Development of a core Clostridium thermocellum kinetic metabolic model consistent with multiple genetic perturbations
Abstract
Background: Clostridium thermocellum is a Gram-positive anaerobe with the ability to hydrolyze and metabolize cellulose into biofuels such as ethanol, making it an attractive candidate for consolidated bioprocessing (CBP). At present, metabolic engineering in C. thermocellum is hindered due to the incomplete description of its metabolic repertoire and regulation within a predictive metabolic model. Genome-scale metabolic (GSM) models augmented with kinetic models of metabolism have been shown to be effective at recapitulating perturbed metabolic phenotypes.
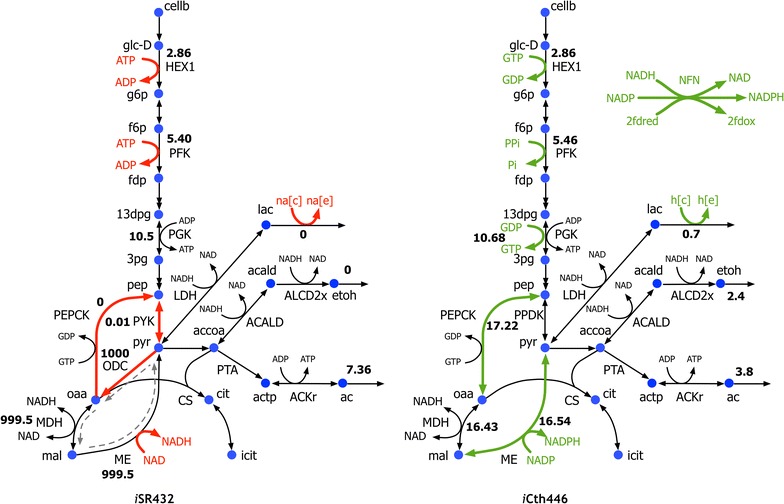
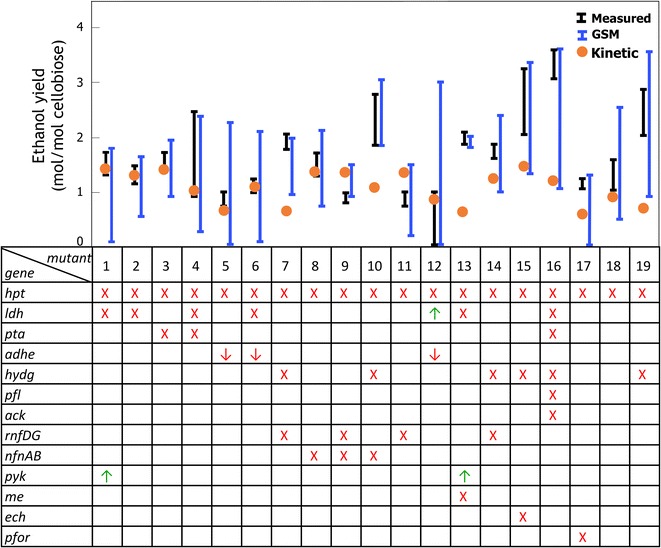
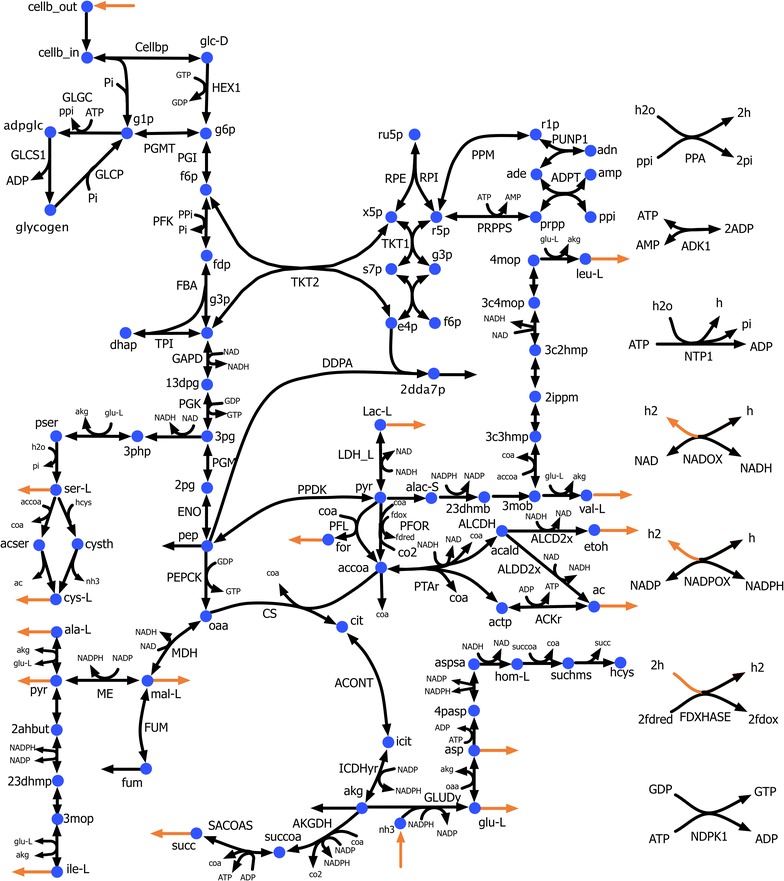
Results: In this effort, we first update a second-generation genome-scale metabolic model (iCth446) for C. thermocellum by correcting cofactor dependencies, restoring elemental and charge balances, and updating GAM and NGAM values to improve phenotype predictions. The iCth446 model is next used as a scaffold to develop a core kinetic model (k-ctherm118) of the C. thermocellum central metabolism using the Ensemble Modeling (EM) paradigm. Model parameterization is carried out by simultaneously imposing fermentation yield data in lactate, malate, acetate, and hydrogen production pathways for 19 measured metabolites spanning a library of 19 distinct single and multiple gene knockout mutants along with 18 intracellular metabolite concentration data for a Δgldh mutant and ten experimentally measured Michaelis-Menten kinetic parameters.
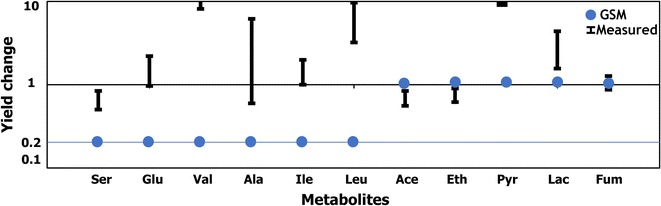
Conclusions: The k-ctherm118 model captures significant metabolic changes caused by (1) nitrogen limitation leading to increased yields for lactate, pyruvate, and amino acids, and (2) ethanol stress causing an increase in intracellular sugar phosphate concentrations (~1.5-fold) due to upregulation of cofactor pools. Robustness analysis of k-ctherm118 alludes to the presence of a secondary activity of ketol-acid reductoisomerase and possible regulation by valine and/or leucine pool levels. In addition, cross-validation and robustness analysis allude to missing elements in k-ctherm118 and suggest additional experiments to improve kinetic model prediction fidelity. Overall, the study quantitatively assesses the advantages of EM-based kinetic modeling towards improved prediction of C. thermocellum metabolism and develops a predictive kinetic model which can be used to design biofuel-overproducing strains.
Keywords: Clostridium thermocellum; Ensemble modeling; Ethanol stress; Genome-scale metabolic model; Kinetic model; Nitrogen limitation.
Figures
Similar articles
-
Assessing the impact of substrate-level enzyme regulations limiting ethanol titer in Clostridium thermocellum using a core kinetic model.Metab Eng. 2022 Jan;69:286-301. doi: 10.1016/j.ymben.2021.12.012. Epub 2022 Jan 1. Metab Eng. 2022. PMID: 34982997
-
Elucidating central metabolic redox obstacles hindering ethanol production in Clostridium thermocellum.Metab Eng. 2015 Nov;32:207-219. doi: 10.1016/j.ymben.2015.10.004. Epub 2015 Oct 21. Metab Eng. 2015. PMID: 26497628
-
The Roles of Nicotinamide Adenine Dinucleotide Phosphate Reoxidation and Ammonium Assimilation in the Secretion of Amino Acids as Byproducts of Clostridium thermocellum.Appl Environ Microbiol. 2023 Jan 31;89(1):e0175322. doi: 10.1128/aem.01753-22. Epub 2023 Jan 10. Appl Environ Microbiol. 2023. PMID: 36625594 Free PMC article.
-
Elimination of metabolic pathways to all traditional fermentation products increases ethanol yields in Clostridium thermocellum.Metab Eng. 2015 Nov;32:49-54. doi: 10.1016/j.ymben.2015.09.002. Epub 2015 Sep 12. Metab Eng. 2015. PMID: 26369438
-
Metabolic modeling of clostridia: current developments and applications.FEMS Microbiol Lett. 2016 Feb;363(4):fnw004. doi: 10.1093/femsle/fnw004. Epub 2016 Jan 10. FEMS Microbiol Lett. 2016. PMID: 26755502 Review.
Cited by
-
Metabolic Fluxes of Nitrogen and Pyrophosphate in Chemostat Cultures of Clostridium thermocellum and Thermoanaerobacterium saccharolyticum.Appl Environ Microbiol. 2020 Nov 10;86(23):e01795-20. doi: 10.1128/AEM.01795-20. Print 2020 Nov 10. Appl Environ Microbiol. 2020. PMID: 32978139 Free PMC article.
-
Acceleration Strategies to Enhance Metabolic Ensemble Modeling Performance.Biophys J. 2017 Sep 5;113(5):1150-1162. doi: 10.1016/j.bpj.2017.07.018. Biophys J. 2017. PMID: 28877496 Free PMC article.
-
The pentose phosphate pathway of cellulolytic clostridia relies on 6-phosphofructokinase instead of transaldolase.J Biol Chem. 2020 Feb 14;295(7):1867-1878. doi: 10.1074/jbc.RA119.011239. Epub 2019 Dec 22. J Biol Chem. 2020. PMID: 31871051 Free PMC article.
-
Pareto Optimality Explanation of the Glycolytic Alternatives in Nature.Sci Rep. 2019 Feb 22;9(1):2633. doi: 10.1038/s41598-019-38836-9. Sci Rep. 2019. PMID: 30796263 Free PMC article.
-
Development of a Genome-Scale Metabolic Model of Clostridium thermocellum and Its Applications for Integration of Multi-Omics Datasets and Computational Strain Design.Front Bioeng Biotechnol. 2020 Aug 21;8:772. doi: 10.3389/fbioe.2020.00772. eCollection 2020. Front Bioeng Biotechnol. 2020. PMID: 32974289 Free PMC article.
References
-
- Fulton LM, Lynd LR, Korner A, Greene N, Tonachel LR. The need for biofuels as part of a low carbon energy future. Biofuel Bioprod Bior. 2015;9:476–483. doi: 10.1002/bbb.1559. - DOI
-
- Lynd LR, Elander RT, Wyman CE. Likely features and costs of mature biomass ethanol technology. Appl Biochem Biotech. 1996;57–8:741–761. doi: 10.1007/BF02941755. - DOI
LinkOut - more resources
Full Text Sources
Other Literature Sources
Molecular Biology Databases
