. 2017 Apr 15;9(4):1543-1560.
eCollection 2017.

Melatonin treatment enhances therapeutic effects of exosomes against acute liver ischemia-reperfusion injury

Affiliations

Melatonin treatment enhances therapeutic effects of exosomes against acute liver ischemia-reperfusion injury

Cheuk-Kwan Sun et al. Am J Transl Res. .

Abstract

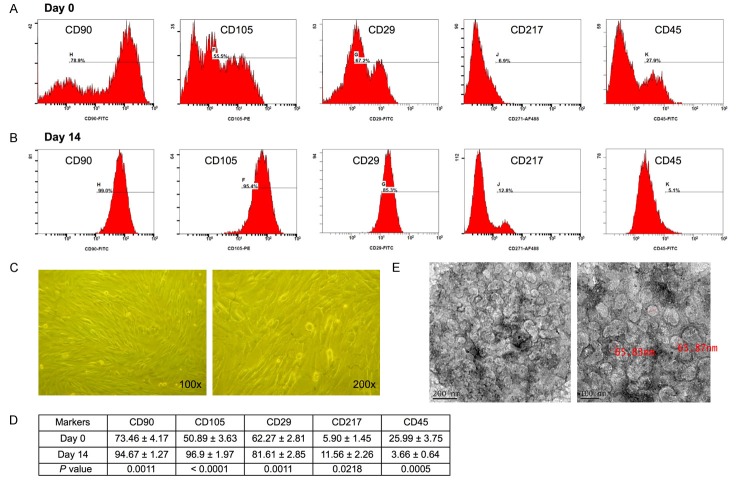
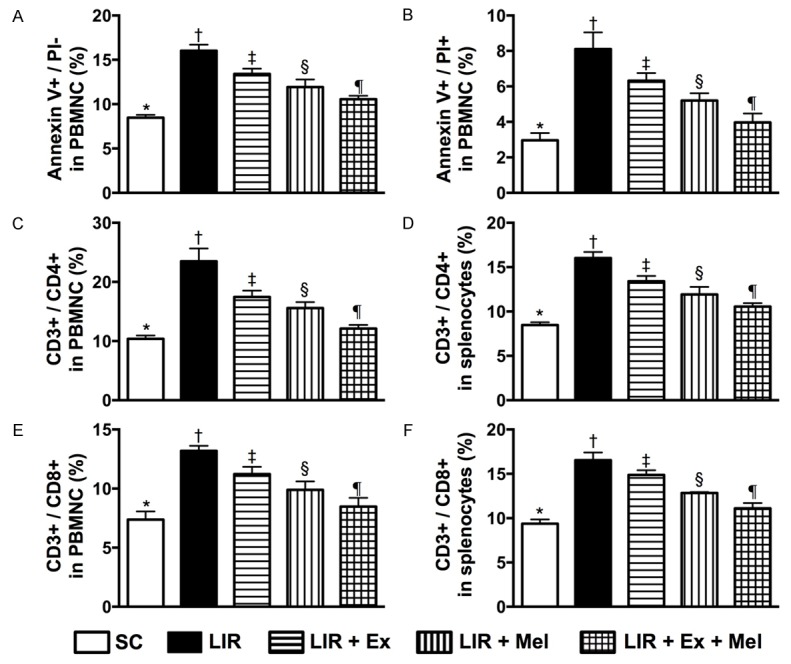
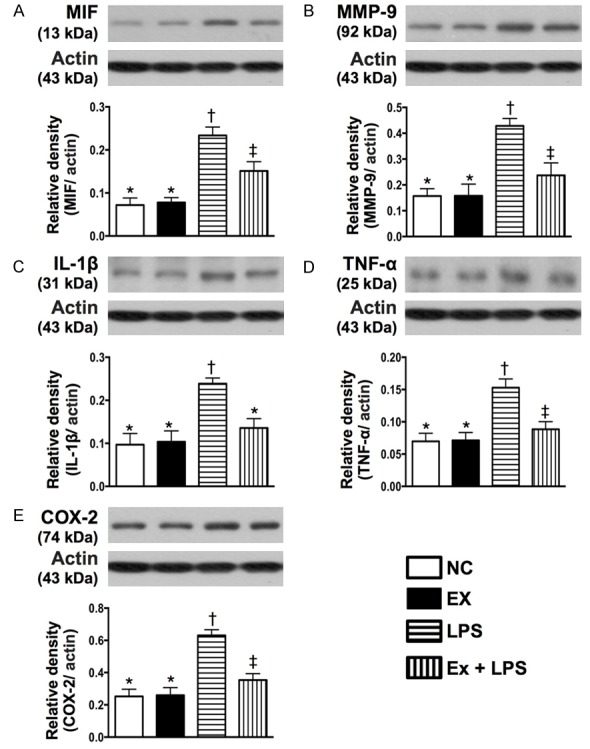
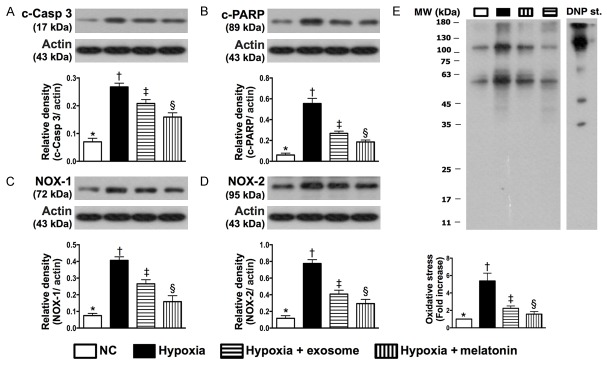
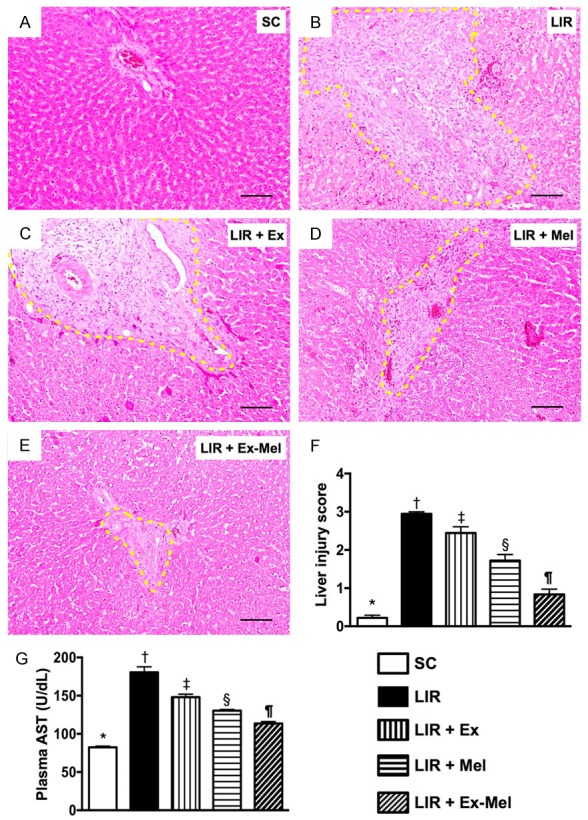
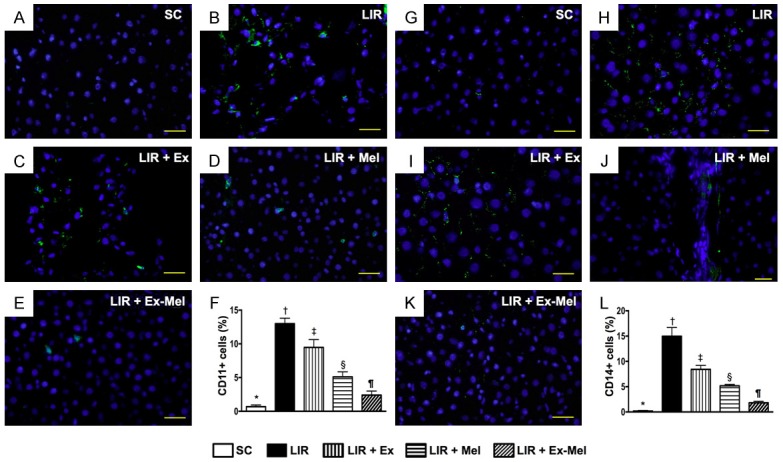
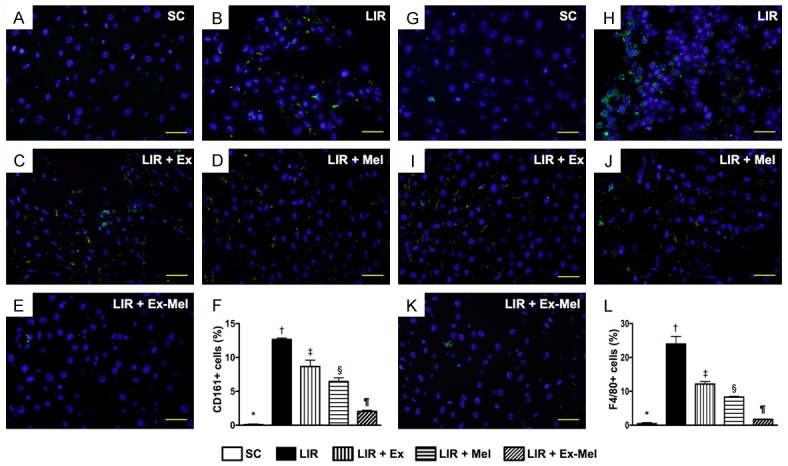
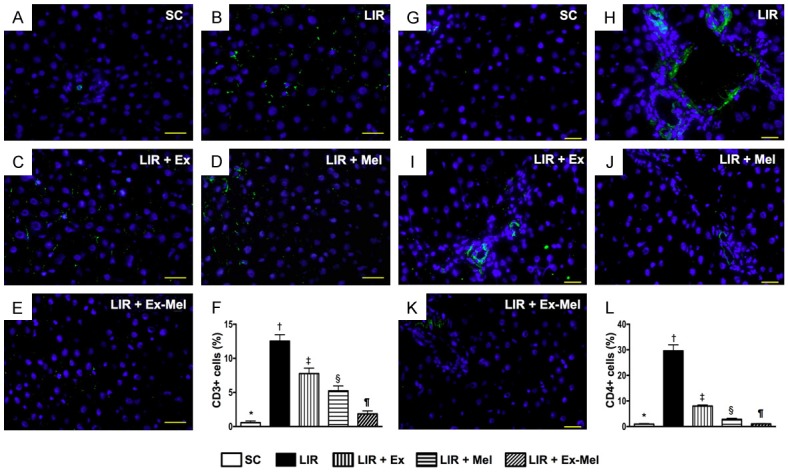
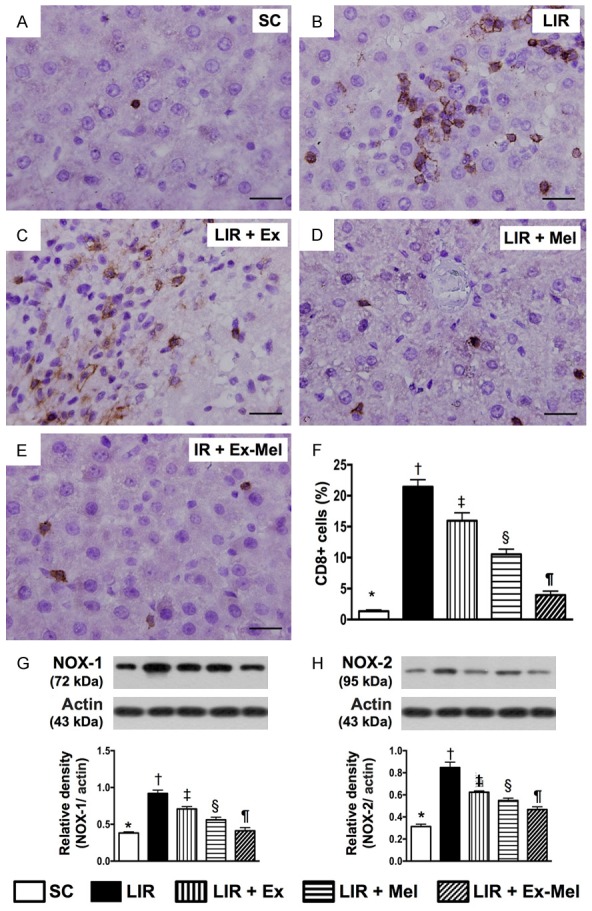
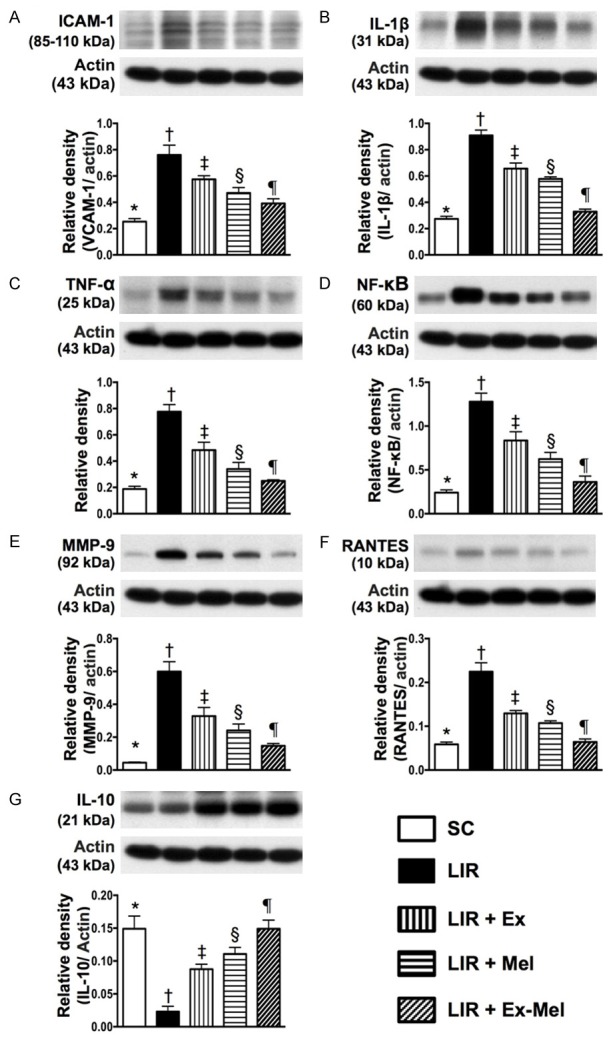
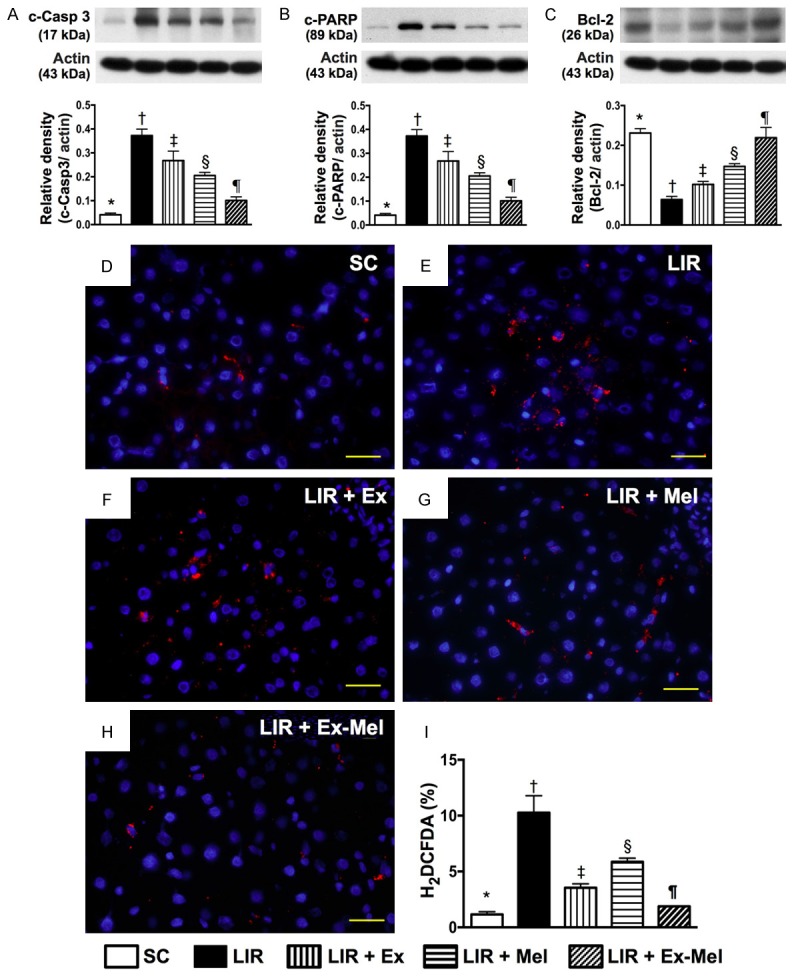
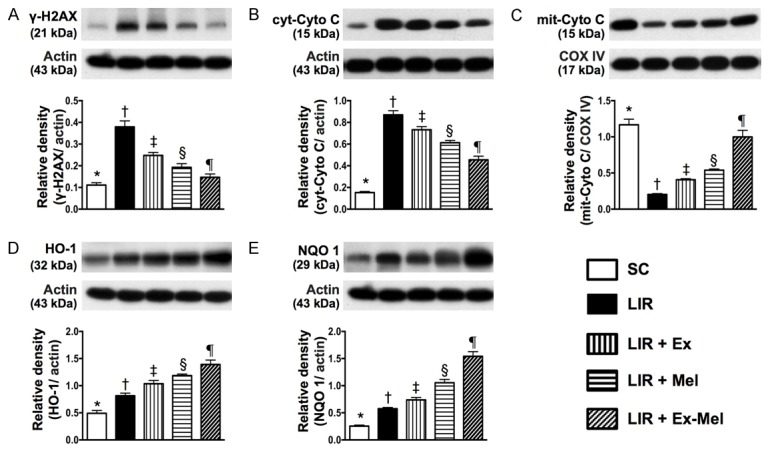
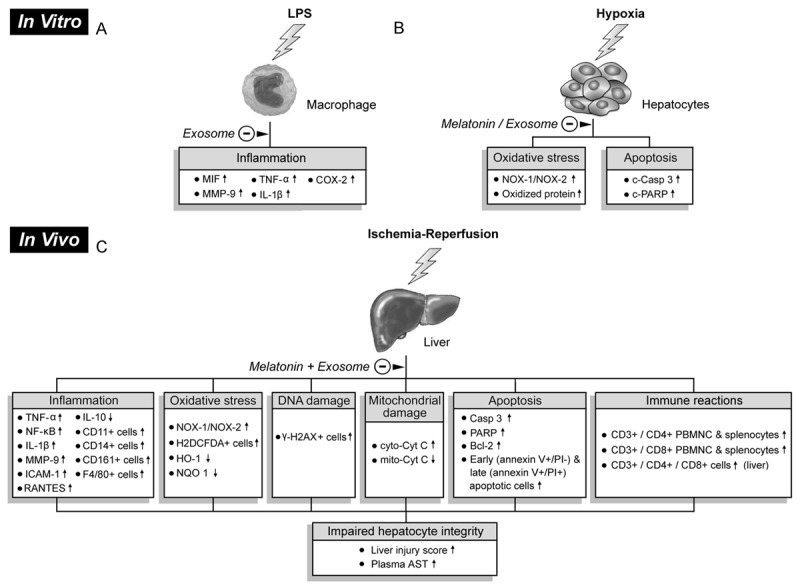
This study tests the hypothesis that combined melatonin and exogenic adipose mesenchymal stem cell (ADMSC)-derived exosome treatment offers superior protection against liver ischemia-reperfusion (LIR) injury compared to either alone. In vitro studies utilized a macrophage cell line (RAW) pretreated with lipopolysaccharide and hepatocytes pretreated with melatonin or exosomes before hypoxia treatment, while in vitro experiments involved analyses of liver specimens from male adult Sprague-Dawley rats (n = 50) equally categorized into sham controls (SC), LIR only, LIR-exosome (100 µg, 30 minute post-LIR), LIR-melatonin (20 mg/kg, 30 minute post-LIR and 50 mg/kg at 6 and 18 hours post-LIR), and LIR-exosome-melatonin groups. In vitro studies showed suppression of inflammation (MIF, MMP-9, IL-1β, TNF-α, COX-2) and oxidative stress (NOX-1, NOX-2, oxidized protein)/apoptosis (cleaved caspase 3 and PARP) by exosome and exosome/melatonin treatment, respectively (all P<0.001). In vivo data demonstrated lowest liver injury score and plasma AST concentrations in LIR-exosome-melatonin group compared with other groups (P<0.001). Besides, expressions of inflammatory markers at protein (ICAM-1, IL-1β, MMP-9, TNF-α, NF-κB, RANTES) and cellular (CD3+, CD4+, CD8+, CD161+, CD11+, CD14+, F4/80) levels, and protein expressions of apoptosis (cleaved caspase-3, PARP), oxidative stress (NOX-1, NOX-2), DNA damage (γ-H2AX) and mitochondrial damage (cytosolic cytochrome-C) markers displayed a pattern similar to that of liver injury score, whereas protein expression of anti-oxidants (HO-1, NQO-1) showed progressive increase from SC to the combined treatment group (all P<0.001). In conclusion, combined exosome-melatonin regimen was superior to either alone in protecting the liver against ischemia-reperfusion injury.

Keywords: Exogenic exosomes; anti-oxidant; immunomodulation; inflammation; liver ischemia-reperfusion injury; melatonin; oxidative stress.


Conflict of interest statement

None.

Figures

Figure 1
Figure 1
Flow cytometric quantification of adipose-derived mesenchymal stem cells (ADMSCs), morphological features of ADMSCs and exosomes. A: Flow cytometric identification of ADMSCs through quantification of the expression of surface markers including CD90, CD105, CD29, and CD217 as well as marker of hematopoietic stem cell, CD45, prior to cell culture (i.e., day 0). B: Flow cytometric analysis of markers of ADMSCs, including CD90, CD105, CD29, and CD217 as well as hematopoietic stem cell marker CD45 after cell culture (i.e., day 14). C: Spindle-shaped cells on light microscopy (100x and 200x, respectively) typical of ADMSC at day 14 after cell culture. D: Statistical analysis of the percentage of stem cell population prior to vs. after cell culture (n = 6). For CD90+ cell, * vs. day 0, P<0.0001; for CD105+ cells, † vs. day 0, P<0.0001; for CD29+ cells, ‡ vs. day 0, P<0.0001; for CD217+ cells, § vs. day 0, P<0.001; for CD45+ cells, ¶ vs. day 0, P<0.0001. E: Transmission electronic microscopy showing the morphological feature of exosomes with diameter ranging from 30-100 nm.
Figure 4
Figure 4
Flow cytometric identification of prevalence of early and late apoptotic mononuclear cells and immune cells in circulation and spleen 72 hours after reperfusion. A: Number of early (annexin V+/PI-) apoptotic peripheral blood mononuclear cells (PBMNCs). Analytical results, * vs. other groups with different symbols (†, ‡, §, ¶), P<0.0001. B: Number of late (annexin V+/PI+) apoptotic PBMNCs. Analytical results, * vs. other groups with different symbols (†, ‡, §, ¶), P<0.0001. C: Circulating CD3+/CD4+ helper T cells, * vs. other groups with different symbols (†, ‡, §, ¶), P<0.0001. D: Splenic CD3+/CD4+ helper T cells, * vs. other groups with different symbols (†, ‡, §, ¶), P<0.0001. E: Circulating CD3+/CD8+ cytotoxic T cells, * vs. other groups with different symbols (†, ‡, §, ¶), P<0.0001. F: Splenic CD3+/CD8+ cytotoxic T cells, * vs. other groups with different symbols (†, ‡, §, ¶), P<0.0001. All statistical analyses were performed by one-way ANOVA, followed by Bonferroni multiple comparison post hoc test (n = 10 for each group). Symbols (*, †, ‡, §, ¶) indicate significant differences (at 0.05 level). SC = sham control; LIR = liver ischemia reperfusion; Ex = exosome; Mel = melatonin.
Figure 2
Figure 2
Protein expressions of inflammatory biomarkers of macrophage under lipopolysaccharide (LPS) stimulation in response to exosome treatment in vitro. A: Protein expression of macrophage migration inhibitory factor (MIF), * vs. other groups with different symbols (†, ‡), P<0.001. B: Protein expression of matrix metalloproteinase (MMP)-9, * vs. other groups with different symbols (†, ‡), P<0.001. C: Protein expression of interleukin (IL)-1β, * vs. other groups with different symbols (†, ‡), P<0.001. D: Protein expression of tumor necrosis factor (TNF)-α, * vs. †, P<0.001. E: Protein expression of COX-2, * vs. other groups with different symbols (†, ‡), P<0.001. All statistical analyses were performed by one-way ANOVA, followed by Bonferroni multiple comparison post hoc test (n = 6 for each group). Symbols (*, †, ‡) indicate significant differences (at 0.05 level). NC = normal control; LPS = lipopolysaccharide.
Figure 3
Figure 3
Protein expressions of apoptosis and oxidative stress biomarkers in hepatocytes under hypoxic stimulation in response to melatonin and exosome treatment in vitro. A: Protein expression of cleaved caspase (c-Casp) 3, * vs. other groups with different symbols (†, ‡, §), P<0.001. B: Protein expression of cleaved poly ADP ribose polymerase (c-PARP), * vs. other groups with different symbols (†, ‡, §), P<0.001. C: Protein expression of NOX-1, * vs. other groups with different symbols (†, ‡, §), P<0.001. D: Protein expression of NOX-2, * vs. other groups with different symbols (†, ‡, §), P<0.001. E: Oxidized protein expression, * vs. other groups with different symbols (†, ‡, §), P<0.0001. (Note: left and right lanes shown on the upper panel represent protein molecular weight marker and control oxidized molecular protein standard, respectively). MW = molecular weight; DNP = 1-3 dinitrophenylhydrazone. All statistical analyses were performed by one-way ANOVA, followed by Bonferroni multiple comparison post hoc test (n = 6 for each group). Symbols (*, †, ‡, §) indicate significant differences (at 0.05 level). NC = normal control.
Figure 5
Figure 5
Exosome-melatonin treatment on preservation of hepatocyte and liver histological integrity 72 hours after reperfusion. (A to E) Hematoxylin and eosin (H&E) staining (100 x) for assessing hepatic damage at 72 hour after reperfusion. Note remarkable histological damage (bound by yellow dotted lines) in animals without exosome (Ex)-melatonin (Mel) treatment (B) compared to that in sham-operated controls (A) and in animals having received treatment with Ex (C), Mel (D) or Ex-Mel (E). Scale bars at right lower corners represent 100 µm. (F) Liver injury scores of different groups, * vs. other groups with different symbols (†, ‡, §, ¶), P<0.0001. (G) Circulating level of aspartate aminotransferase (AST), * vs. other groups with different symbols (†, ‡, §, ¶), P<0.0001. All statistical analyses were performed by one-way ANOVA, followed by Bonferroni multiple comparison post hoc test (n = 10 for each group). Symbols (*, †, ‡, §, ¶) indicate significant differences (at 0.05 level). SC = sham control; LIR = liver ischemia reperfusion; Ex = exosome; Mel = melatonin.
Figure 6
Figure 6
Immunofluorescent (IF) staining for identification of inflammatory cell (CD11+, CD14+) infiltration in liver parenchyma 72 hours after reperfusion. A to E: IF microscopy (400 x) demonstrating CD11+ cells (green) in liver parenchyma. Scale bars in right lower corner represent 20 µm. F: Analytic results of number of CD11+ cells, * vs. other groups with different symbols (†, ‡, §, ¶), P<0.0001. G to K: IF microscopy (400 x) identifying CD14+ cells (green) in liver parenchyma. Scale bars in right lower corner represent 20 µm. L: Number of CD14+ cells in different groups, * vs. other groups with different symbols (†, ‡, §, ¶), P<0.0001. All statistical analyses were performed by one-way ANOVA, followed by Bonferroni multiple comparison post hoc test (n = 10 for each group). Symbols (*, †, ‡, §, ¶) indicate significant differences (at 0.05 level). SC = sham control; LIR = liver ischemia reperfusion; Ex = exosome; Mel = melatonin.
Figure 7
Figure 7
Immunofluorescent (IF) staining for identification of inflammatory cell (CD161+, F4/80+) infiltration in liver parenchyma 72 hours after reperfusion. (A to E) IF microscopy (400 x) showing CD161+ cells (green) in liver parenchyma. Scale bars in right lower corner represent 20 µm. F: Differences in number of CD161+ cells among different groups, * vs. other groups with different symbols (†, ‡, §, ¶), P<0.0001. (G to K) Identification of F4/80+ cells (green) in liver parenchyma using IF microscopy (400 x). Scale bars in right lower corner represent 20 µm. (L) Mean number of F4/80+ cells in different groups, * vs. other groups with different symbols (*, †, ‡, §, ¶), P<0.0001. All statistical analyses were performed by one-way ANOVA, followed by Bonferroni multiple comparison post hoc test (n = 10 for each group). Symbols (*, †, ‡, §, ¶) indicate significant differences (at 0.05 level). SC = sham control; LIR = liver ischemia reperfusion; Ex = exosome; Mel = melatonin.
Figure 8
Figure 8
Immunofluorescent (IF) staining for identification of immunoreactive cell infiltration in liver parenchyma 72 hours after reperfusion. A to E: Illustration of IF microscopic finding (400 x) of CD3+ cells (green) in liver parenchyma. The scale bars in right lower corner represent 20 µm. F: Analytic results of number of CD3 + cells, * vs. other groups with different symbols (†, ‡, §, ¶), P<0.0001. G to K: Illustration of IF microscopic finding (400 x) of CD4+ cells (green color) in liver parenchyma. The scale bars in right lower corner represent 20 µm. L: Analytic results of number of CD4+ cells, * vs. other groups with different symbols (†, ‡, §, ¶), P<0.0001. All statistical analyses were performed by one-way ANOVA, followed by Bonferroni multiple comparison post hoc test (n = 10 for each group). Symbols (*, †, ‡, §, ¶) indicate significance (at 0.05 level). SC = sham control; LIR = liver ischemia reperfusion; Ex = exosome; Mel = melatonin.
Figure 9
Figure 9
Prevalence of CD8+ cells and protein expression of NOX-1 and NOX-2 in liver parenchyma 72 hours after reperfusion. A to E: Immunohistochemical (IHC) staining (400 x) showing CD8+ cells (gray) in liver parenchyma. Scale bars in right lower corner represent 20 µm. F: Mean number of CD8 + cells in different groups, * vs. other groups with different symbols (†, ‡, §, ¶), P<0.0001. G: Protein expression of NOX-1, * vs. other groups with different symbols (†, ‡, §, ¶), P<0.001. H: Protein expression of NOX-2, * vs. other groups with different symbols (†, ‡, §, ¶), P<0.001. All statistical analyses were performed by one-way ANOVA, followed by Bonferroni multiple comparison post hoc test (n = 10 for each group). Symbols (*, †, ‡, §, ¶) indicate significant differences (at 0.05 level). SC = sham control; LIR = liver ischemia reperfusion; Ex = exosome; Mel = melatonin.
Figure 10
Figure 10
Protein expressions of inflammatory and anti-inflammatory biomarkers in liver parenchyma 72 hours after reperfusion. A: Protein expression of vascular cell adhesion molecule (ICAM)-1, * vs. other groups with different symbols (†, ‡, §, ¶), P<0.001. B: Protein expression of interleukin (IL)-1β, * vs. other groups with different symbols (†, ‡, §, ¶), P<0.001. C: Protein expression of tumor necrosis factor (TNF)-α, * vs. other groups with different symbols (†, ‡, §, ¶), P<0.001. D: Protein expression of nuclear factor (NF)-κB, * vs. other groups with different symbols (†, ‡, §, ¶), P<0.001. E: Protein expression of matrix metalloproteinase (MMP)-9, * vs. other groups with different symbols (†, ‡, §, ¶), P<0.001. F: Protein expression of RANTES, * vs. other groups with different symbols (†, ‡, §, ¶), P<0.001. G: Protein expression of IL-10, * vs. other groups with different symbols (†, ‡, §, ¶), P<0.001. All statistical analyses were performed by one-way ANOVA, followed by Bonferroni multiple comparison post hoc test (n = 10 for each group). Symbols (*, †, ‡, §, ¶) indicate significant differences (at 0.05 level). SC = sham control; LIR = liver ischemia reperfusion; Ex = exosome; Mel = melatonin.
Figure 11
Figure 11
Protein expressions of apoptotic and anti-apoptotic biomarkers, and oxidative stress at cellular level in liver parenchyma 72 hours after reperfusion. A: Protein expression of cleaved caspase (c-Casp) 3, * vs. other groups with different symbols (†, ‡, §, ¶), P<0.001. B: Protein expression of cleaved poly ADP ribose polymerase (c-PARP), * vs. other groups with different symbols (†, ‡, §, ¶), P<0.001. C: Protein expression of Bcl-2, * vs. other groups with different symbols (†, ‡, §, ¶), P<0.001. D-H: Microscopic (400 x) identification of H2DCFDA-positive cells (red) in IR region. Scale bars in right lower corner represent 20 µm. I: Analysis of collagen deposition area, * vs. other groups with different symbols (†, ‡, §, ¶), P<0.0001. All statistical analyses were performed by one-way ANOVA, followed by Bonferroni multiple comparison post hoc test (n = 10 for each group). Symbols (*, †, ‡, §, ¶) indicate significant differences (at 0.05 level). SC = sham control; LIR = liver ischemia reperfusion; Ex = exosome; Mel = melatonin.
Figure 12
Figure 12
Protein expressions of DNA damage, mitochondrial damage, and anti-oxidant biomarkers in liver parenchyma 72 hours after reperfusion. A: Protein expression of γ-H2AX, * vs. other groups with different symbols (†, ‡, §, ¶), P<0.001. B: Protein expression of cytosolic cytochrome C (cyt-Cyto C), * vs. other groups with different symbols (†, ‡, §, ¶), P<0.001. C: Protein expression of mitochondrial cytochrome C (mit-Cyto C), * vs. other groups with different symbols (†, ‡, §, ¶), P<0.001. D: Protein expression of heme oxygenase (HO)-1, * vs. other groups with different symbols (†, ‡, §, ¶), P<0.001. E: Protein expression of quinone oxidoreductase (NQO) 1, * vs. other groups with different symbols (†, ‡, §, ¶), P<0.001. All statistical analyses were performed by one-way ANOVA, followed by Bonferroni multiple comparison post hoc test (n = 10 for each group). Symbols (*, †, ‡, §, ¶) indicate significant differences (at 0.05 level). SC = sham control; LIR = liver ischemia reperfusion; Ex = exosome; Mel = melatonin.
Figure 13
Figure 13
Proposed mechanisms underlying protective effects of exosome-melatonin treatment against liver ischemia-reperfusion injury based on findings of this study. A: Suppression of inflammatory responses (i.e., upregulated expressions of pro-inflammatory biomarkers) in macrophage in vitro by exosomes after lipopolysaccharide (LPS) pre-treatment. B: In vitro alleviation of oxidative stress and apoptosis in hepatocytes after exosome/melatonin treatment before hypoxic stimulation. C: In vivo impacts of exosome/melatonin treatment on inflammation, oxidative stress, DNA damage, mitochondrial damage, apoptosis, and immune reactions that contribute to impaired hepatocyte and histological integrity. LPS: lipopolysaccharide, MIF: migration inhibitory factor, MMP-9: matrix metalloproteinase 9, TNF-α: tumor necrosis factor alpha, IL-1β: interleukin-1 beta, COX-2: cyclooxygenase-2, NOX-1: NADPH oxidase 1, NOX-2: NADPH oxidase 2, c-Casp 3: cleaved caspase 3, c-PARP: cleaved poly ADP ribose polymerase, IL: interleukin, PBMNC: peripheral blood mononuclear cell, NF-κB: nuclear factor kappaB, ICAM-1: intercellular adhesion molecule 1, RANTES: regulated on activation, normal T cell expressed and secreted , HO-1: heme oxygenase-1, NQO: quinone oxidoreductase 1, cyt-Cyto C: cytosolic cytochrome C, mit-Cyto C: mitochondrial cytochrome C, AST: aspartate aminotransferase.

Similar articles

Cited by

References

    1. Khashab M, Tector AJ, Kwo PY. Epidemiology of acute liver failure. Curr Gastroenterol Rep. 2007;9:66–73. - PubMed
    1. Henrion J. Hypoxic hepatitis. Liver Int. 2012;32:1039–1052. - PubMed
    1. Fuhrmann V, Kneidinger N, Herkner H, Heinz G, Nikfardjam M, Bojic A, Schellongowski P, Angermayr B, Kitzberger R, Warszawska J, Holzinger U, Schenk P, Madl C. Hypoxic hepatitis: underlying conditions and risk factors for mortality in critically ill patients. Intensive Care Med. 2009;35:1397–1405. - PubMed
    1. Lee WM. Acute liver failure. Semin Respir Crit Care Med. 2012;33:36–45. - PubMed
    1. Singanayagam A, Bernal W. Update on acute liver failure. Curr Opin Crit Care. 2015;21:134–141. - PubMed

LinkOut - more resources