

FGF-16 protects against adverse cardiac remodeling in the infarct diabetic heart
- PMID: 28469770
- PMCID: PMC5411913
FGF-16 protects against adverse cardiac remodeling in the infarct diabetic heart
Abstract
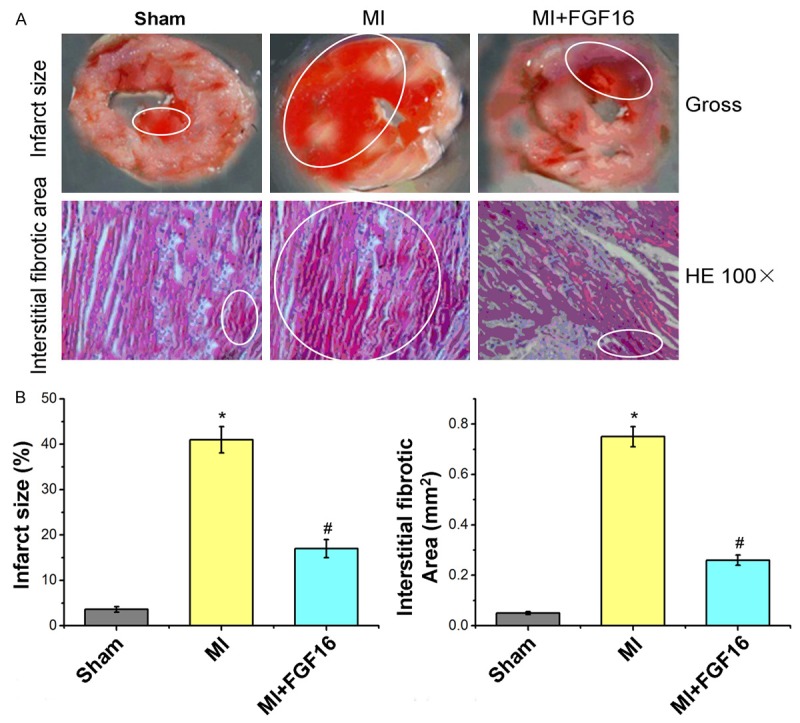
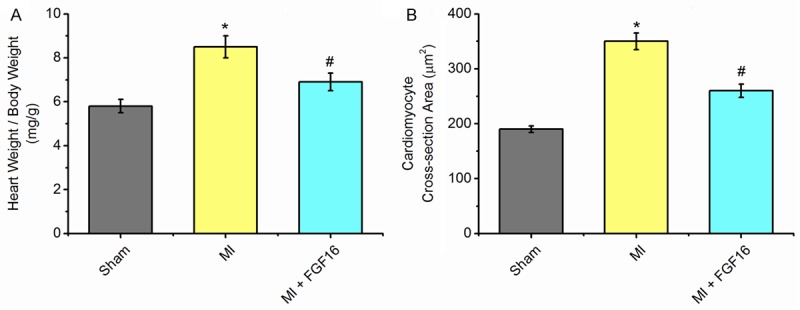
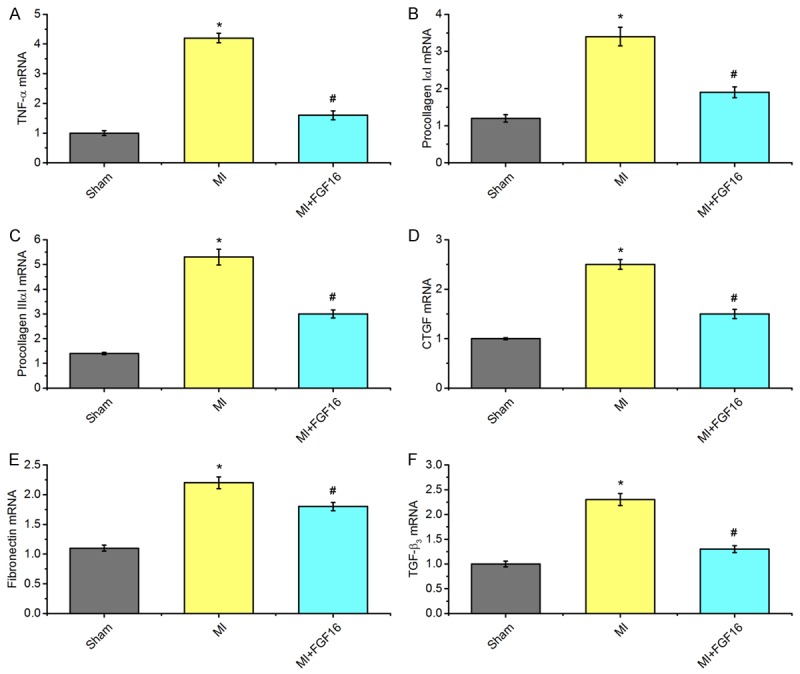
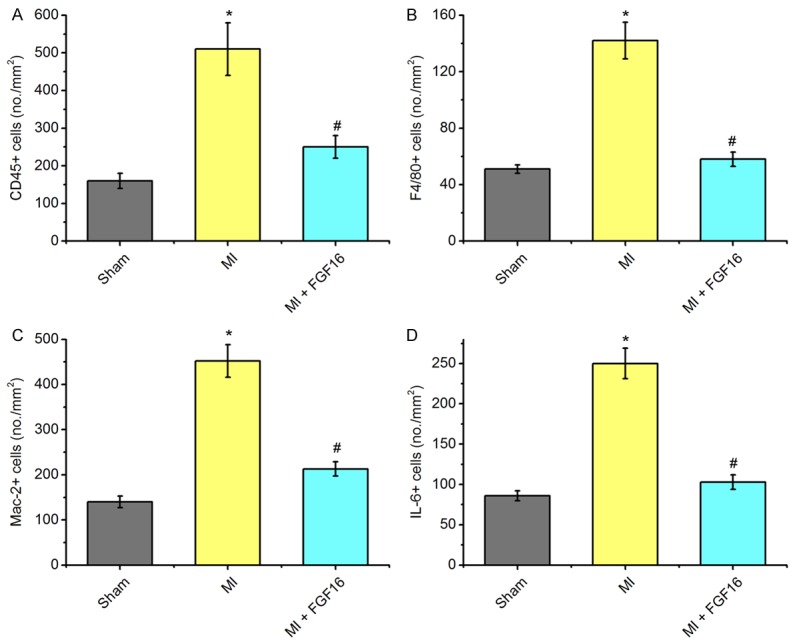
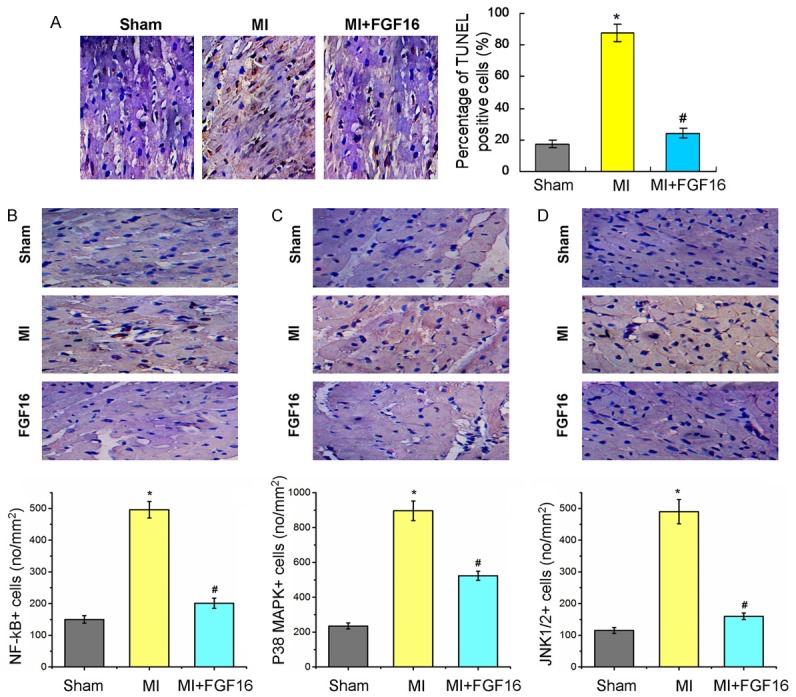
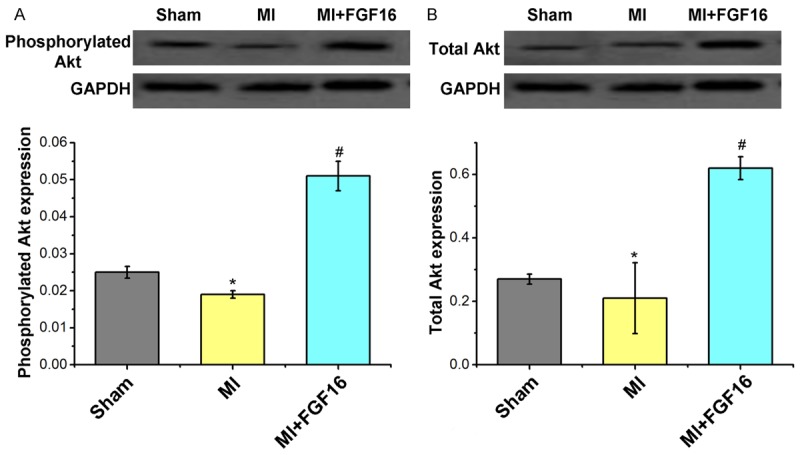
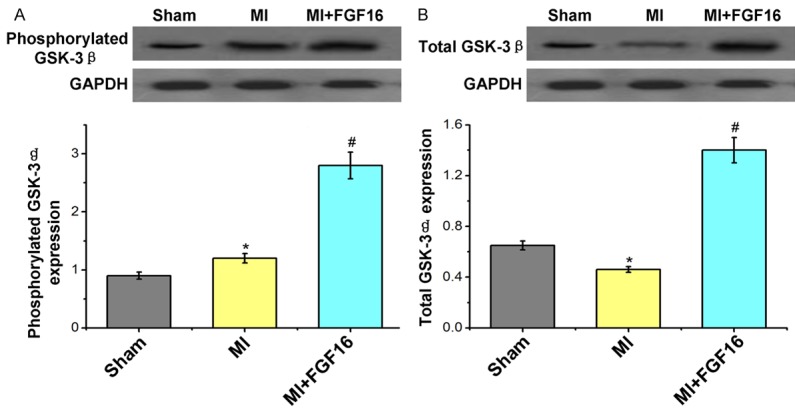
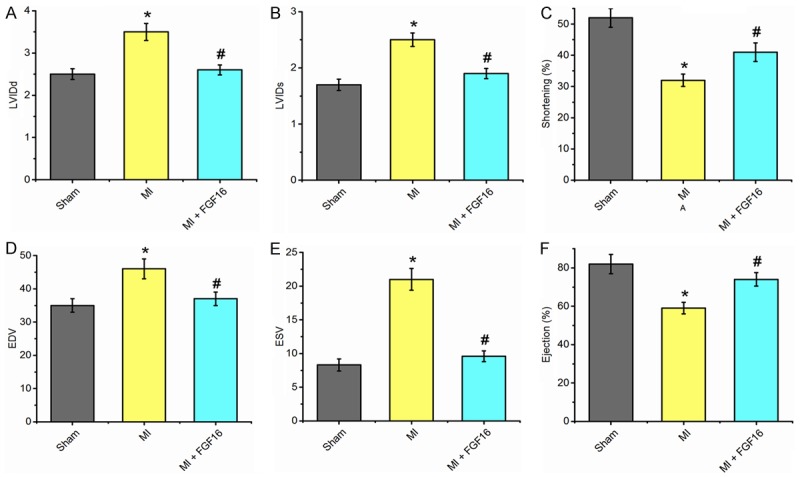
Till now, no functional studies for FGF-16 in diabetic heart have been reported. Therefore, this study aims to evaluate the potential function of FGF-16 in inhibiting adverse cardiac remodeling in post myocardial infarction (MI) of diabetic heart. We investigated the role of fibroblast growth factor-16 (FGF-16) in post-MI remodeling and role of cardio-protection in the diabetic infarct heart. Adult db/db diabetic mice were assigned to sham group, MI group and MI+FGF-16 group, respectively. MI group was induced by permanent coronary artery ligation, and the mice were subjected to 2D trans-thoracic echocardiography 2-4 weeks post-surgery. The results showed that the infiltration of monocytes, the associated pro-inflammatory cytokines were significantly increased, and the adverse cardiac remodeling and left ventricular dysfunction were observed in MI group. FGF-16 treatment protected against apoptosis, cardiac dysfunction and chamber dilatation post-MI, and decreased monocyte infiltration and cardiomyocyte hypertrophy/apoptosis. Meanwhile, the FGF-16 treatment also attenuated interstitial fibrosis and myocardial inflammation post-MI, increased M2 macrophage differentiation and associated anti-inflammatory cytokines, reduced adverse remodeling, and improved cardiac function. In conclusion, our results suggest that the heart appears to be a target of systemic and possibly locally generated FGF-16, which plays a therapeutic role in cardiac protection in the post-MI diabetic heart.
Keywords: FGF-16; cardiac remodeling; diabetes; myocardial infarction.
Conflict of interest statement
None.
Figures
Similar articles
-
Fibroblast growth factor-9 enhances M2 macrophage differentiation and attenuates adverse cardiac remodeling in the infarcted diabetic heart.PLoS One. 2015 Mar 13;10(3):e0120739. doi: 10.1371/journal.pone.0120739. eCollection 2015. PLoS One. 2015. PMID: 25768089 Free PMC article.
-
Cardioprotective role of growth/differentiation factor 1 in post-infarction left ventricular remodelling and dysfunction.J Pathol. 2015 Jul;236(3):360-72. doi: 10.1002/path.4523. Epub 2015 Mar 30. J Pathol. 2015. PMID: 25726944
-
Oral levosimendan prevents postinfarct heart failure and cardiac remodeling in diabetic Goto-Kakizaki rats.J Hypertens. 2009 Oct;27(10):2094-107. doi: 10.1097/HJH.0b013e32832f0ce4. J Hypertens. 2009. PMID: 19730126
-
Clinical aspects of left ventricular diastolic function assessed by Doppler echocardiography following acute myocardial infarction.Dan Med Bull. 2001 Nov;48(4):199-210. Dan Med Bull. 2001. PMID: 11767125 Review.
-
Adaptive Immune Responses Contribute to Post-ischemic Cardiac Remodeling.Front Cardiovasc Med. 2019 Jan 10;5:198. doi: 10.3389/fcvm.2018.00198. eCollection 2018. Front Cardiovasc Med. 2019. PMID: 30687720 Free PMC article. Review.
Cited by
-
High-Fat Diet Differentially Regulates Fibroblast Growth Factor Expression in Metabolic Tissues of Young and Aged Male Mice.J Endocr Soc. 2025 May 29;9(8):bvaf096. doi: 10.1210/jendso/bvaf096. eCollection 2025 Aug. J Endocr Soc. 2025. PMID: 40585885 Free PMC article.
-
The FGF/FGFR system in the microglial neuroinflammation with Borrelia burgdorferi: likely intersectionality with other neurological conditions.J Neuroinflammation. 2023 Jan 17;20(1):10. doi: 10.1186/s12974-022-02681-x. J Neuroinflammation. 2023. PMID: 36650549 Free PMC article.
-
IRX1 hypermethylation promotes heart failure by inhibiting CXCL14 expression.Cell Cycle. 2019 Dec;18(23):3251-3262. doi: 10.1080/15384101.2019.1673099. Epub 2019 Oct 22. Cell Cycle. 2019. PMID: 31640472 Free PMC article.
-
Fibroblast growth factor 16: Molecular mechanisms, signalling crosstalk, and emerging roles in cardiac biology and metabolic regulation.Pharmacol Res. 2025 Aug;218:107858. doi: 10.1016/j.phrs.2025.107858. Epub 2025 Jul 13. Pharmacol Res. 2025. PMID: 40664344 Free PMC article. Review.
-
The Multifunctional Contribution of FGF Signaling to Cardiac Development, Homeostasis, Disease and Repair.Front Cell Dev Biol. 2021 May 14;9:672935. doi: 10.3389/fcell.2021.672935. eCollection 2021. Front Cell Dev Biol. 2021. PMID: 34095143 Free PMC article. Review.
References
-
- Khan IA. Coronary artery disease and diabetes-management during ramadan. J Pak Med Assoc. 2015;65(Suppl):S62–64. - PubMed
LinkOut - more resources
Full Text Sources
Other Literature Sources
Miscellaneous