. 2017 Jul;79(5):1506-1523.
doi: 10.3758/s13414-017-1331-8.

Confident failures: Lapses of working memory reveal a metacognitive blind spot

Affiliations

Confident failures: Lapses of working memory reveal a metacognitive blind spot

Kirsten C S Adam et al. Atten Percept Psychophys. 2017 Jul.

Abstract

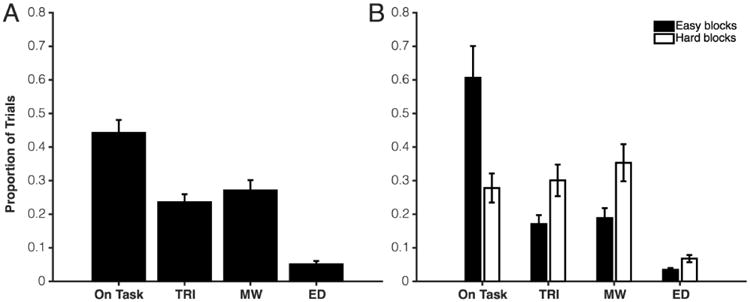
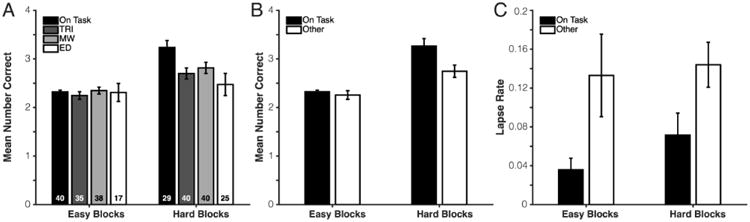
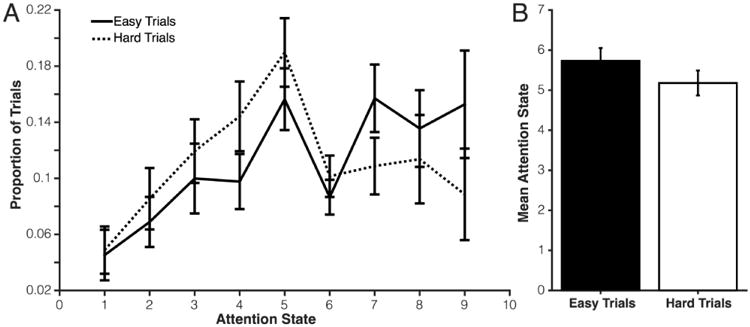
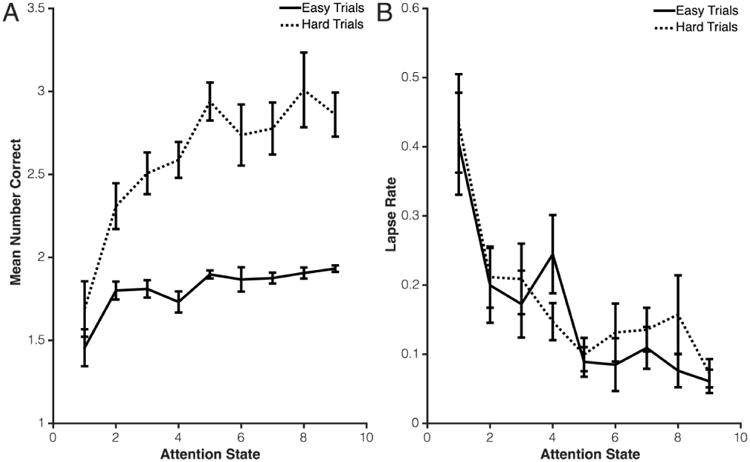
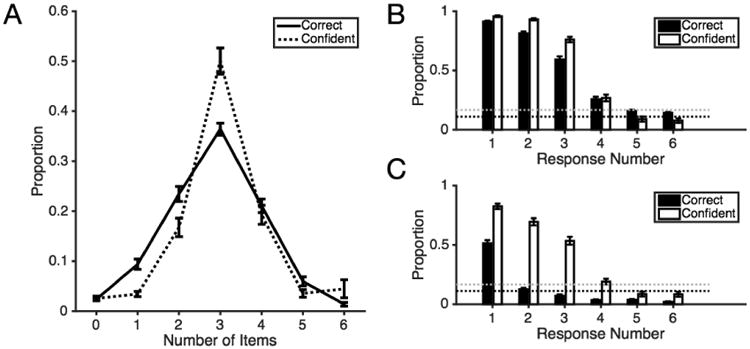
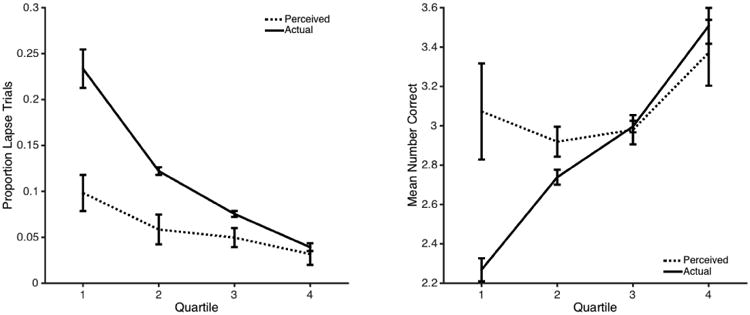
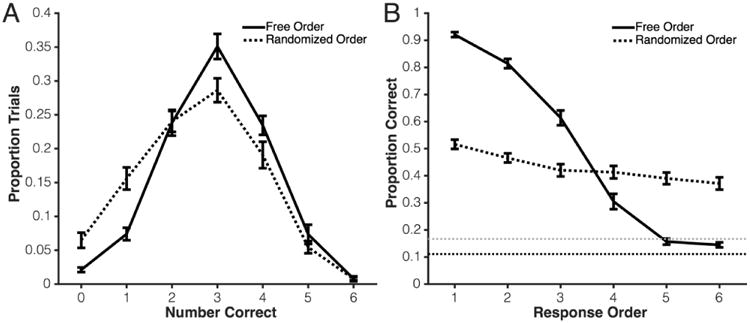
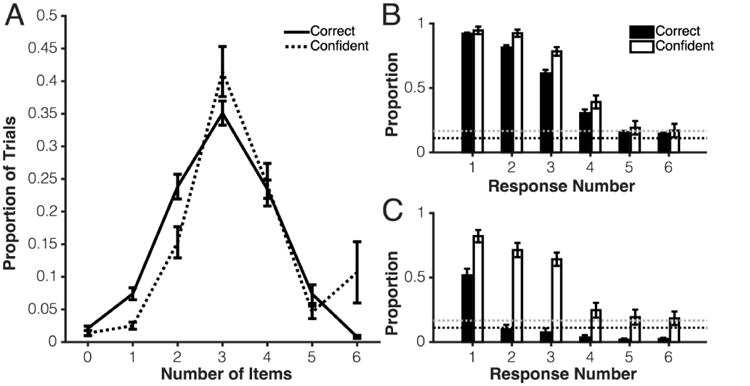
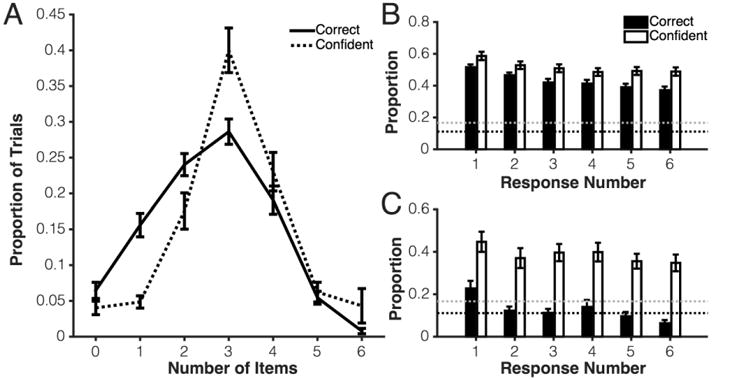
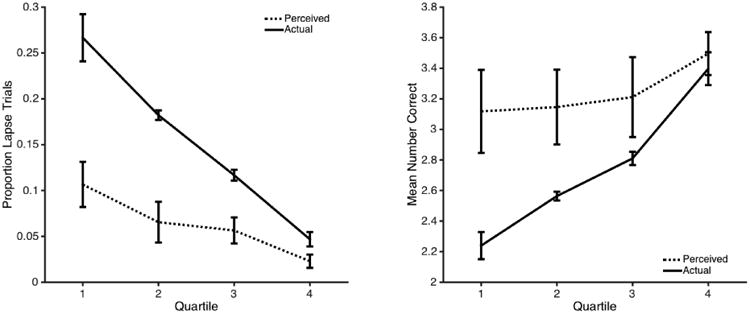
Working memory performance fluctuates dramatically from trial to trial. On many trials, performance is no better than chance. Here, we assessed participants' awareness of working memory failures. We used a whole-report visual working memory task to quantify both trial-by-trial performance and trial-by-trial subjective ratings of inattention to the task. In Experiment 1 (N = 41), participants were probed for task-unrelated thoughts immediately following 20% of trials. In Experiment 2 (N = 30), participants gave a rating of their attentional state following 25% of trials. Finally, in Experiments 3a (N = 44) and 3b (N = 34), participants reported confidence of every response using a simple mouse-click judgment. Attention-state ratings and off-task thoughts predicted the number of items correctly identified on each trial, replicating previous findings that subjective measures of attention state predict working memory performance. However, participants correctly identified failures on only around 28% of failure trials. Across experiments, participants' metacognitive judgments reliably predicted variation in working memory performance but consistently and severely underestimated the extent of failures. Further, individual differences in metacognitive accuracy correlated with overall working memory performance, suggesting that metacognitive monitoring may be key to working memory success.

Keywords: Attentional control; Metacognition; Visual working memory.


Conflict of interest statement

Conflicts of Interest: none

Figures

Figure 1
Figure 1. Distribution of thought-probe responses in Experiment 1
TRI = Task-Related Interference; MW = Mind-Wandering; ED = External Distraction. (A) Proportion of responses for all trials. (B) Proportion of responses separated by easy blocks (set-sizes 2 and 3) and hard blocks (set-sizes 6 and 8).
Figure 2
Figure 2. Performance as a function of thought-probe response in Experiment 1
TRI = Task-Related Interference; MW = Mind-Wandering; ED = External Distraction. (A) Mean number correct as a function of thought-probe response. Not all participants used all four response categories in the easy and hard conditions. Each bar is calculated separately using only participants who used each category. Digits represent the number of participants contributing to each bar, and error bars represent one standard error of the mean. (B) Mean number correct as a function of thought-probe response. Here, all three off-task probes are collapsed into the category “other”. Only participants who contributed to all four categories (N = 27) are included in the graph. (C) Lapse rate as a function of thought-probe response. Again, only participants who contributed trials to all four categories (N = 27) are included in the graph.
Figure 3
Figure 3. Distribution of attention state ratings by condition in Experiment 2
Error bars represent one standard error of the mean. Attention state ratings reflected the degree to which participants felt they were focused on completing the task at hand, with 1 meaning “not at all focused on the task” and 9 meaning “totally focused on completing the task.” (A) Distribution of attention state ratings as a function of set-size (easy versus hard). (B) Average attention state rating as a function of trial difficulty.
Figure 4
Figure 4. Performance as a function of attention state rating in Experiment 2
Error bars represent one standard error of the mean. Attention state ratings reflected the degree to which participants felt they were focused on completing the task at hand, with 1 meaning “not at all focused on the task” and 9 meaning “totally focused on completing the task.” Solid lines: Easy trials (set-size 2). Dotted lines: Hard trials (set-size 6). (A) Mean number correct as a function of attention state rating. (B) Lapse rate (0 or 1 correct) as a function of attention state rating.
Figure 5
Figure 5. The relationship between correct and confident responses in Experiment 3a
Error bars represent one standard error of the mean. (A) Dotted line: Proportion of trials where participants reported that they were confident about 0 though 6 items. Solid line: Proportion of trials where subject correctly reported 0 through 6 items. (B) Distribution of correct and confident responses across each response in time across all trials. Response Number = 1 represents the first item the subject reported. Response Number = 6 represents the last item the subject reported. The gray dotted line represents a “smart” guessing strategy of remembering the colors of 3 items and guessing only among the 6 possible non-remembered colors (1/6), and the black dotted line represents a “purely random” guessing strategy among all possible colors (1/9). (C) Distribution of correct and confident responses across each response in time only for lapse trials (participants got a total of 0 or 1 items correct).
Figure 6
Figure 6. Metacognitive bias as a function of task performance in Experiment 3a
Left: Lapse rate (perceived and actual) as a function of task performance (quartile split). Right: Mean number of items correct (perceived and actual) as a function of task performance (quartile split). Error bars represent standard error of the mean.
Figure 7
Figure 7. Overall performance in Experiment 3b
All error bars represent one standard error of the mean. The solid line represents performance in the free response order condition and the dotted line represents performance in the randomized response order condition. (A) Distribution of performance outcomes. (B) Performance as a function of response order (1 = the first item reported, 6 = the last item reported). The gray dotted line represents a “smart” guessing strategy of remembering the colors of 3 items and guessing only among the 6 possible non-remembered colors (1/6), and the black dotted line represents a “purely random” guessing strategy among all possible colors (1/9).
Figure 8
Figure 8. The relationship between correct and confident responses in Experiment 3b: Free Response-Order
Error bars represent one standard error of the mean. (A) Dotted line: Proportion of trials where participants reported that they were confident about 0 though 6 items. Solid line: Proportion of trials where subject correctly reported 0 through 6 items. (B) Distribution of correct and confident responses across each response in time across all trials. Response Number = 1 represents the first item the subject reported. Response Number = 6 represents the last item the subject reported. The gray dotted line represents a “smart” guessing strategy of remembering the colors of 3 items and guessing only among the 6 possible non-remembered colors (1/6), and the black dotted line represents a “purely random” guessing strategy among all possible colors (1/9). (C) Distribution of correct and confident responses across each responses in time only for lapse trials (participants got a total of 0 or 1 items correct).
Figure 9
Figure 9. The relationship between correct and confident responses in Experiment 3b: Randomized Response Order
Error bars represent one standard error of the mean. (A) Dotted line: Proportion of trials where participants reported that they were confident about 0 though 6 items. Solid line: Proportion of trials where subject correctly reported 0 through 6 items. (B) Distribution of correct and confident responses across each response in time across all trials. Response Number = 1 represents the first item the subject reported. Response Number = 6 represents the last item the subject reported. The gray dotted line represents a “smart” guessing strategy of remembering the colors of 3 items and guessing only among the 6 possible non-remembered colors (1/6), and the black dotted line represents a “purely random” guessing strategy among all possible colors (1/9). (C) Distribution of correct and confident responses across each responses in time only for lapse trials (participants got a total of 0 or 1 items correct).
Figure 10
Figure 10. Metacognitive bias as a function of task performance in Experiment 3b
Trials were combined across the free and random conditions. Left: Lapse rate (reported and actual) as a function of task performance (quartile split). Right: Mean number of items correct (reported and actual) as a function of task performance (quartile split). Error bars represent standard error of the mean.

References

    1. Adam KCS, Mance I, Fukuda K, Vogel EK. The Contribution of Attentional Lapses to Individual Differences in Visual Working Memory Capacity. Journal of Cognitive Neuroscience. 2015;27(8):1601–1616. https://doi.org/10.1162/jocn_a_00811. - DOI - PMC - PubMed
    1. Adam KCS, Vogel EK. Reducing failures of working memory with performance feedback. Psychonomic Bulletin & Review. 2016 https://doi.org/10.3758/s13423-016-1019-4. - DOI - PMC - PubMed
    1. Antrobus JS. Information theory and stimulus-independent thought. British Journal of Psychology. 1968;59(4):423–430. https://doi.org/10.1111/j.2044-8295.1968.tb01157.x. - DOI
    1. Bays PM, Husain M. Dynamic Shifts of Limited Working Memory Resources in Human Vision. Science. 2008;321(5890):851–854. https://doi.org/10.1126/science.1158023. - DOI - PMC - PubMed
    1. Bona S, Silvanto J. Accuracy and Confidence of Visual Short-Term Memory Do Not Go Hand-In-Hand: Behavioral and Neural Dissociations. PLoS ONE. 2014;9(3):e90808. https://doi.org/10.1371/journal.pone.0090808. - DOI - PMC - PubMed

LinkOut - more resources