Review
. 2017 May;59(4):175-187.
doi: 10.1111/dgd.12348. Epub 2017 May 4.

New perspective on the regionalization of the anterior forebrain in Osteichthyes

Affiliations
Review

New perspective on the regionalization of the anterior forebrain in Osteichthyes

Kei Yamamoto et al. Dev Growth Differ. 2017 May.

Abstract

In the current model, the most anterior part of the forebrain (secondary prosencephalon) is subdivided into the telencephalon dorsally and the hypothalamus ventrally. Our recent study identified a new morphogenetic unit named the optic recess region (ORR) between the telencephalon and the hypothalamus. This modification of the forebrain regionalization based on the ventricular organization resolved some previously unexplained inconsistency about regional identification in different vertebrate groups. The ventricular-based comparison also revealed a large diversity within the subregions (notably in the hypothalamus and telencephalon) among different vertebrate groups. In tetrapods there is only one hypothalamic recess, while in teleosts there are two recesses. Most notably, the mammalian and teleost hypothalami are two extreme cases: the former has lost the cerebrospinal fluid-contacting (CSF-c) neurons, while the latter has increased them. Thus, one to one homology of hypothalamic subregions in mammals and teleosts requires careful verification. In the telencephalon, different developmental processes between Sarcopterygii (lobe-finned fish) and Actinopterygii (ray-finned fish) have already been described: the evagination and the eversion. Although pallial homology has been long discussed based on the assumption that the medial-lateral organization of the pallium in Actinopterygii is inverted from that in Sarcopterygii, recent developmental data contradict this assumption. Current models of the brain organization are largely based on a mammalian-centric point of view, but our comparative analyses shed new light on the brain organization of Osteichthyes.

Keywords: evolution; hypothalamus; optic recess region; telencephalon; ventricle.


Figures

Figure 1
Figure 1
Phylogenetic tree of vertebrates. A simplified phylogenetic tree focusing on the evolution of Osteichthyes (bony fish). Osteichthyes is divided into two categories: Sarcopterygii (lobe‐finned fish) that contains tetrapods, and Actinopterygii (ray‐finned fish) that contains teleosts. Based on recent findings, it is hypothesized that two rounds of whole genome duplication (WGD) occurred before the gnathostomes‐cyclostomes split. The teleost lineage went through an additional WGD.
Figure 2
Figure 2
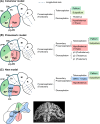
Different models for the subdivision of the forebrain. Representative vertebrate brains from a lateral view (rostral to the left) are shown to demonstrate three different models. (A) The columnar model in which the hypothalamus is considered to be the ventral half of the diencephalon. (B) The prosomeric model which was originally proposed by Puelles and Rubenstein in the early 1990s and has been modified over time. In this model, the hypothalamus is proposed to be the ventral half of the most anterior part of the forebrain, and the telencephalon and hypothalamus consists of the secondary prosencephalon. (C) A new model proposed by Affaticati et al. (2015), in which the secondary prosencephalon is divided into three parts, the telencephalon, hypothalamus, and optic recess region (ORR). At the bottom, 3D illustration (left; modified from Picker et al. 2009) and a confocal image of DAPI staining (right) of a frontal section of a zebrafish embryo demonstrate that the eyes are continuous with the ORR. 2ndP, secondary prosencephalon; Die, Diencephalon; Hy, hypothalamus; M, mesencephalon; ORR, optic recess region; OS, optic stalk; P, pallium; p, prosomeric subdivision; PO, preoptic area; R, rhombencephalon; r, rhombomeric subdivision; SP, subpallium; Tel, telencephalon; Th, thalamus.
Figure 3
Figure 3
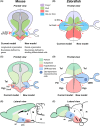
Regional boundaries defined by abutting differentiated neurons. (A, B) Ventral (A) and lateral (B) views of the zebrafish embryonic brain showing three cell masses, the telencephalon (Tel), optic recess region (ORR), and hypothalamus (Hyp). Cell nuclei are labeled with DAPI (gray) and ventricular zones are labeled with ZO‐1 (green). (C, D) Ventral (C) and lateral (D) views of the zebrafish embryonic brain showing gradient cell maturation from the ventricular zones. Differentiating cells are labeled with elavl3 (green) and differentiated neurons are labeled with HuC/D (magenta). Two rows of HuC/D cells originating from different ventricular zones are in apposition at boundaries (arrowheads) of Tel, ORR, and Hyp. (E, F) Schematic drawing of the ventral (E) and lateral (F) views of the embryonic zebrafish brain, showing the telencephalon (green), ORR (blue), and hypothalamus (red). Simple anatomical landmarks of their boundaries are anterior (ac) and postoptic (poc) commissures. ac, anterior commissure; Hyp, hypothalamus; LR, lateral recess; OR, optic recess; ORR, optic recess region; poc, postoptic commissure; PR, posterior recess; Tel, telencephalon.
Figure 4
Figure 4
A new model solving discrepancies of homology in the current model. Frontal (A–D) and lateral (E–F) views of the anterior forebrain in mouse (A, C, E) and zebrafish (B, D, F). Frontal planes (A–D) represent embryonic brain sections showing both current (left) and new (right) models on the regional identity of the anterior forebrain. (A, B) The color code represents gene expression data in mouse (A) and zebrafish (B). In the current view (left side of the brain), the ventral limit of the telencephalon is often delineated by the expression of Dlx2 (arrowhead) or Foxg1 (arrow), but the two borders do not coincide (which is more prominent in the teleost brain). In the new model, regional boundaries are delineated by abutting differentiated neurons, and they do not necessarily correspond to the limit delineated by gene expression. (C, D) The color code represents proposed regional identity in mouse (C) and zebrafish (D). In the current model established in amniotes (left side of the brain in C), the preoptic area (PO) is considered to be a part of the subpallium due to the expression of Foxg1 or Dlx genes, and Otp‐dependent neuroendocrine cells are considered to be located in the hypothalamus. While in teleosts, the area called the PO contains the otp‐dependent neuroendocrine cells (left side of the brain in D). In the new model, the corresponding area is the optic recess region (ORR). Considering the Otp‐positive area in mouse as the ORR solves the discrepancy of the homology of neuroendocrine cell population between amniotes and teleosts. (E, F) Lateral view of mature brain sections of mouse (E) and zebrafish (F), representing the new model on the regional identity of the anterior forebrain. The color code of each region is the same as C and D. The anterior commissure (ac) and postoptic commissure (poc) can be simple anatomical landmarks for the regional boundary.
Figure 5
Figure 5
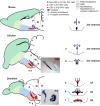
Comparison of the hypothalamic organization in mouse, chicken, and zebrafish. Lateral views of mouse, chicken, and zebrafish brain sections (rostral to the left) are shown on the left, and frontal views around the hypothalamic recess are shown on the right (levels of the frontal planes are indicated with gray lines in the lateral view). In mouse and chicken, there is only one hypothalamic recess (3rd ventricle), while in zebrafish, there are two: the lateral recess (LR) and the posterior recess (PR). Some comparable monoaminergic cell groups are plotted on the schematic drawings. TH2/ TPH1‐expressing CSF‐c DA and 5‐HT cells (red diamonds) are commonly found along the hypothalamic recesses throughout vertebrates (images shown in chicken and zebrafish), while mammals have lost the monoaminergic CSF‐c cells. The A11‐like TH1‐expressing DA cell population (blue dots; non CSF‐c cells) projecting to the spinal cord is commonly found dorsolateral to the CSF‐c cells in different vertebrate groups. It is not clear whether the corresponding area is the hypothalamus or the posterior tuberculum (vertical pink lines). LR, lateral recess; M, mesencephalon; ORR, optic recess region; P, prosencephalon; PR, posterior recess; R, rhombencephalon.
Figure 6
Figure 6
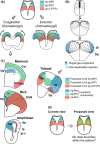
Organization of the pallium in Osteichthyes. (A) Schematic drawings showing the classical view of evagination (left) and eversion (right) of the pallium. The color codes represent a proposed homologous pallial region between Sarcopterygii and Actinopterygii based on the assumption that the pallial organization of Actinopterygii is an inverted version of the pallium of Sarcopterygii. Based on this theory, the piriform pallium (pp; red) originates from the ventral end of the pallium in both Sarcopterygii and Actinopterygii. (B) Schematic drawings modified from Dirian et al. (2014) showing the pallial development in zebrafish. The lateral and posterior zones of the teleost pallium (Dl and Dp) are formed from the dorsal tip of the pallium, and neurogenesis of this region starts much later than the rest of the pallium. (C) Schematic drawings of frontal sections of mature brains in the mammal, bird, amphibian, and teleost (midline on the left). The colors indicate brain regions proposed to be homologous to the MP (blue), DP (green), and LP (red), respectively. The horizontal blue, slanted green, and vertical red lines indicate pallial areas functionally similar to the hippocampal pallium, general pallium, and piriform pallium, respectively (but the topology does not fit the classical view). (D) Proposed modification of the concept of pallial subdivisions. We propose that there is no distinct subdivision within the pallium. The topology is not a critical factor for determining the pallial properties, and any part of the pallium has potential to generate hippocampal‐like, cortical‐like, piriform‐like, and amygdala‐like characteristics. Amy, amygdala; Ctx, neocortex; Dm, medial zone of dorsal telencephalic area; Dl, lateral zone of dorsal telencephalic area; DP, dorsal pallium (morphotype subdivision); dp, dorsal pallium (amphibian structure); Dp, posterior zone of dorsal telencephalic area; DVR, dorsal ventricular ridge; gp, general pallium; H, hyperpallium; Hp, hippocampus; hp, hippocampal pallium; LP, lateral pallium (morphotype subdivision); lp, lateral pallium (amphibian structure); lp‐v, ventral part of the lateral pallium (amphibian structure); MP, medial pallium (morphotype subdivision); mp, medial pallium (amphibian structure); Pir, piriform cortex; pp, piriform pallium; VP, ventral pallium.

References

    1. Affaticati, P. , Yamamoto, K. , Rizzi, B. , Bureau, C. , Peyrieras, N. , Pasqualini, C. , Demarque, M. & Vernier, P. 2015. Identification of the optic recess region as a morphogenetic entity in the zebrafish forebrain. Sci. Rep. 5, 8738. - PMC - PubMed
    1. Ball, J. N. 1981. Hypothalamic control of the pars distalis in fishes, amphibians, and reptiles. Gen. Comp. Endocrinol. 44, 135–170. - PubMed
    1. Bally‐Cuif, L. & Vernier, P. 2010. Organization and physiology of the zebrafish nervous system. In: Zebrafish (eds Perry S. F., Ekker M., Farrell A. P. & Brauner C. J.), pp. 25–80. Elsevier, Amsterdam.
    1. Biran, J. , Tahor, M. , Wircer, E. & Levkowitz, G. 2015. Role of developmental factors in hypothalamic function. Front. Neuroanat. 9, 47. - PMC - PubMed
    1. Bruce, L. L. & Braford, M. R. 2009. Evolution of the limbic system. In: Encyclopedia of Neuroscience (ed. Squire L. R.), Vol. 4, pp. 43–55. Academic Press, Oxford.

LinkOut - more resources