. 2017 May;18(3):170-181.
doi: 10.1002/acm2.12091. Epub 2017 May 4.

Tuning of AcurosXB source size setting for small intracranial targets

Affiliations

Tuning of AcurosXB source size setting for small intracranial targets

Stephen J Gardner et al. J Appl Clin Med Phys. 2017 May.

Abstract

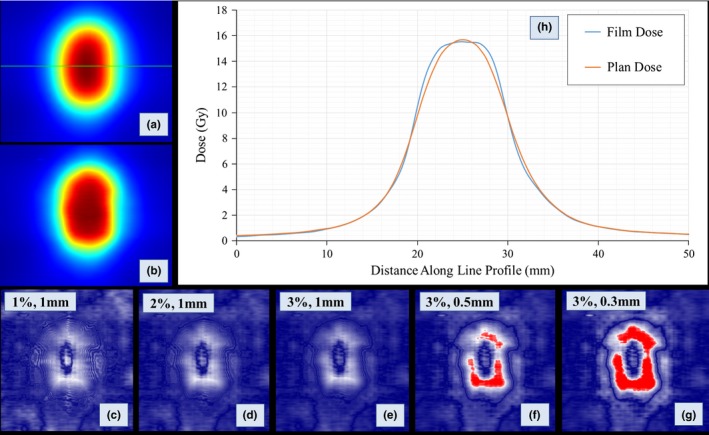
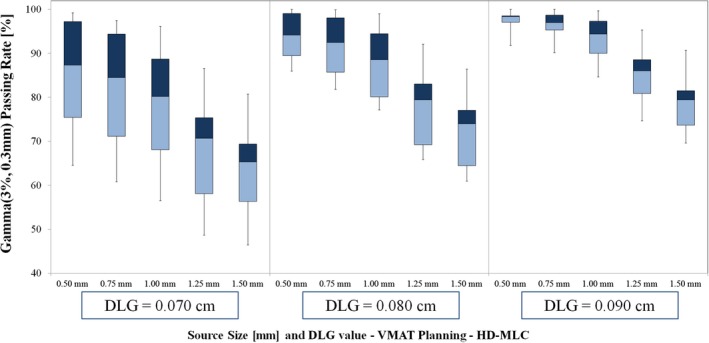
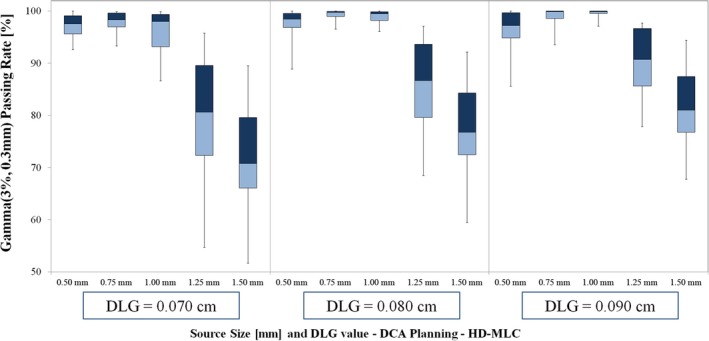
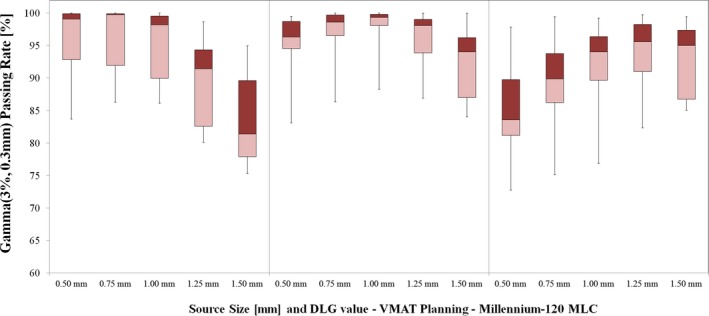
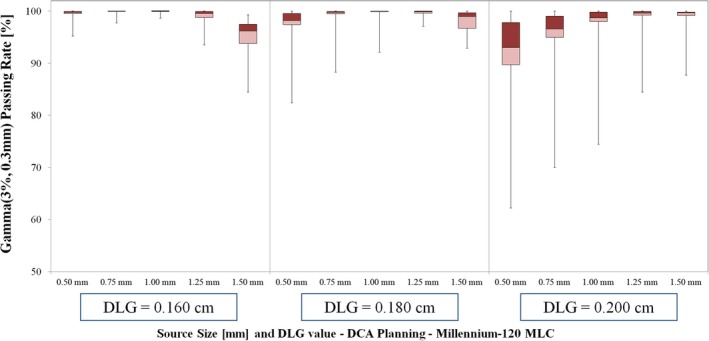
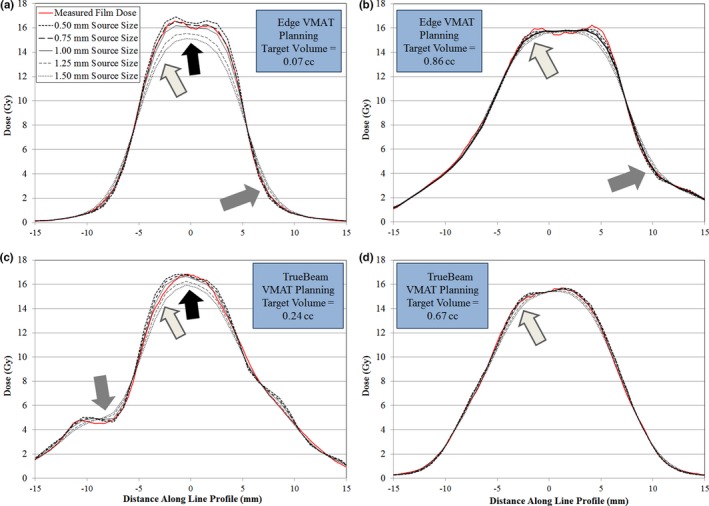
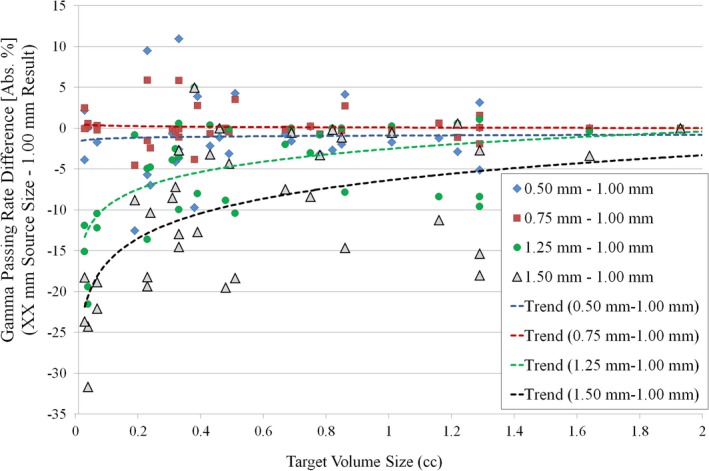
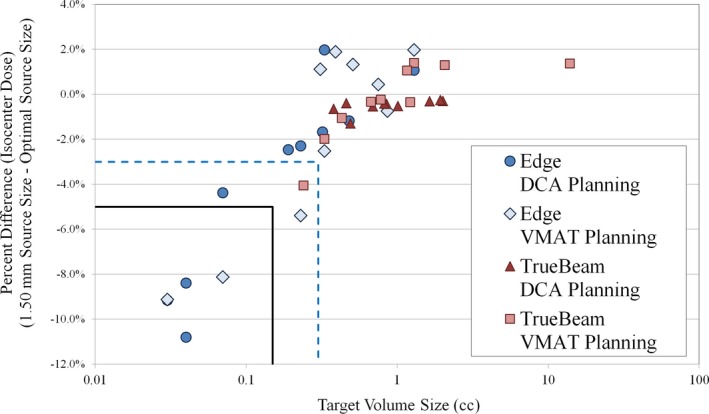
This study details a method to evaluate the source size selection for small field intracranial stereotactic radiosurgery (SRS) deliveries in Eclipse treatment planning system (TPS) for AcurosXB dose calculation algorithm. Our method uses end-to-end dosimetric data to evaluate a total of five source size selections (0.50 mm, 0.75 mm, 1.00 mm, 1.25 mm, and 1.50 mm). The dosimetric leaf gap (DLG) was varied in this analysis (three DLG values were tested for each scenario). We also tested two MLC leaf designs (standard and high-definition MLC) and two delivery types for intracranial SRS (volumetric modulated arc therapy [VMAT] and dynamic conformal arc [DCA]). Thus, a total of 10 VMAT plans and 10 DCA plans were tested for each machine type (TrueBeam [standard MLC] and Edge [high-definition MLC]). Each plan was mapped to a solid water phantom and dose was calculated with each iteration of source size and DLG value (15 total dose calculations for each plan). To measure the dose, Gafchromic film was placed in the coronal plane of the solid water phantom at isocenter. The phantom was localized via on-board CBCT and the plans were delivered at planned gantry, collimator, and couch angles. The planned and measured film dose was compared using Gamma (3.0%, 0.3 mm) criteria. The vendor-recommended 1.00 mm source size was suitable for TrueBeam planning (both VMAT and DCA planning) and Edge DCA planning. However, for Edge VMAT planning, the 0.50 mm source size yielded the highest passing rates. The difference in dose calculation among the source size variations manifested primarily in two regions of the dose calculation: (1) the shoulder of the high-dose region, and (2) for small targets (volume ≤ 0.30 cc), in the central portion of the high-dose region. Selection of a larger than optimal source size can result in increased blurring of the shoulder for all target volume sizes tested, and can result in central axis dose discrepancies in excess of 10% for target volumes sizes ≤ 0.30 cc. Our results indicate a need for evaluation of the source size when AcurosXB is used to model intracranial SRS delivery, and our methods represent a feasible process for many clinics to perform tuning of the AcurosXB source size parameter.

Keywords: SRS dose delivery; radiochromic film dosimetry; small field dosimetry.


Figures

Figure 1
Figure 1
Comparison of Gamma analysis criteria for one representative case from the study. The red regions in each Gamma map represent failing pixels for the relevant Gamma criteria used. a, Planned dose (1.50 mm source size) plane with line profile geometry (green horizontal line). b, Green channel film dose plane. c, Gamma map for 1%,1 mm criteria. d, Gamma map for 2%, 1 mm criteria. e, Gamma map for 3%, 1 mm criteria. f, Gamma map for 3%, 0.5 mm criteria. g, Gamma map for 3%, 0.3 mm criteria. h, Line profile comparing the AcurosXB planned dose (1.50 mm source size) and green channel film dose. Note the disagreement between planned and measured dose in the shoulder of the high‐dose region. Gamma analysis using 1 mm dose‐to‐agreement criteria is insensitive to such discrepancy in the dose distribution, while Gamma analysis with tighter distance‐to‐agreement criteria (e.g., 0.3 or 0.5 mm) shows failing points in the shoulder of the high‐dose region that match observed dose distribution discrepancies. The Gamma analysis criteria used for this study: 3%, 0.3 mm.
Figure 2
Figure 2
Gamma passing rate results for VMAT planning with Edge linac (HDMLC). Note that the highest passing rates occur for the 0.090 cm DLG setting, and the optimal source size varies with DLG setting. For DLG value of 0.090 cm, the 0.50 mm source size results in the highest passing rate (mean ± SD passing rate of 97.51 ± 2.38%). The vendor‐recommended source size setting (1.00 mm) with the same DLG value (0.090 cm) yields a lower mean passing rate result with larger variation–mean ± SD passing rate 93.72 ± 4.96%.
Figure 3
Figure 3
Gamma passing rate results for DCA planning with Edge linac (HDMLC). The optimal source size for these data is 1.00 mm for DLG value 0.090 cm (corresponding to the optimal DLG value for VMAT planning). For DLG values of 0.070 cm and 0.080 cm, the highest passing rates occurred for calculations with 0.75 mm source size setting.
Figure 4
Figure 4
Gamma passing rate results for VMAT planning with TrueBeam linac (Millennium‐120 MLC). Note that the highest passing rates occur for the 0.180 cm DLG setting, and the optimal source size varies with DLG setting. For DLG value of 0.180 cm, the 1.00 mm source size yields the highest passing rates (mean ± SD): 97.84 ± 3.66%. For lower DLG value (0.160 cm), the average passing rate results for 0.50 mm, 0.75 mm and 1.00 mm settings were within 0.7% of one another. The highest passing rate for DLG value 0.160 cm occurred for smaller source size – 0.75 mm setting with mean±SD passing rate of 96.16 ± 5.83%. For the larger DLG value (0.200 cm), the highest average passing rate occurred for larger source size – 1.25 mm setting with mean ± SD passing rate of 93.65 ± 6.19%.
Figure 5
Figure 5
Gamma passing rate results for DCA planning with TrueBeam linac (Millennium‐120 MLC). For 0.180 cm DLG value, the highest passing rates occurred for source sizes of 1.00 mm (99.16 ± 2.47%) and 1.25 mm (99.45 ± 0.99%).
Figure 6
Figure 6
Comparison of measured dose (red solid line) with calculated dose for the source size settings tested for VMAT planning with Edge and TrueBeam linacs. All calculations performed using optimal DLG value: 0.090 cm for Edge linac and 0.180 cm for TrueBeam linac. a, VMAT planning for a small volume target (0.07 cc) with Edge linac. As the source size increases, the magnitude of the central high‐dose region is dramatically reduced (indicated by black arrow), the shoulder of the high‐dose region exhibits blurring (light gray arrow), and the low dose region also exhibits differences as a function of source size (gray arrow). b, VMAT planning for a typical volume target (0.86 cc) with Edge linac. Note the similar blurring of the shoulder of the high‐dose region (black arrow), but no difference in the magnitude of the central high‐dose region. c, VMAT planning for a smaller volume target (0.24 cc) for TrueBeam linac. Note the similar behavior in the central region, shoulder of the high‐dose region, and low dose region to profile comparison in (a). d, VMAT planning for a typical volume target (0.67 cc). Again, there remains characteristic blurring of the shoulder of the high‐dose region without variation in the magnitude of the central high‐dose region.
Figure 7
Figure 7
Difference in Gamma Analysis passing rate for each source size tested relative to the vendor‐recommended source size (1.00 mm) for all cases tested (all machine types and all delivery types). Note the sharp decrease in passing rate for smaller target volume size (volume ≤ 0.30 cc) for source sizes larger than the recommended 1.00 mm value (1.25 mm and 1.50 mm).
Figure 8
Figure 8
Comparison of isocenter dose for Edge and TrueBeam linacs for VMAT and DCA planning. Dose difference is the isocenter dose 1.50 mm source size relative to isocenter dose for optimal VMAT source size (0.50 mm for Edge linac and 1.00 mm for TrueBeam linac). The blue dashed lines indicate region of target volume less than 0.30 cc and dose difference less than −3%. The black solid lines indicate region with target volume less than 0.15 cc and dose difference less than 5%. The largest dose discrepancy was −10.80% for 0.03 cc volume target.

References

    1. Alexander E, Moriarty TM, Davis RB, et al. Stereotactic radiosurgery for the definitive, noninvasive treatment of brain metastases. J Natl Cancer Inst. 1995;87:34–40. - PubMed
    1. Ryu SI, Chang SD, Kim DH, et al. Image‐guided hypo‐fractionated stereotactic radiosurgery to spinal lesions. Neurosurgery. 2001;49:838–846. - PubMed
    1. Andrews DW, Scott CB, Sperduto PW, et al. Whole brain radiation therapy with or without stereotactic radiosurgery boost for patients with one to three brain metastases: Phase III results of the RTOG 9508 randomised trial. The Lancet. 2004;363:1665–1672. - PubMed
    1. Huang Y, Zhao B, Chetty IJ, Brown S, Gordon J, Wen N. Targeting accuracy of image‐guided radiosurgery for intracranial lesions a comparison across multiple linear accelerator platforms. Technol Cancer Res Treat. 2015;15:243–248. - PubMed
    1. Kim J, Jin J‐Y, Walls N, et al. Image‐guided localization accuracy of stereoscopic planar and volumetric imaging methods for stereotactic radiation surgery and stereotactic body radiation therapy: A phantom study. Int J Radiat Oncol Biol Phys. 2011;79:1588–1596. - PubMed

LinkOut - more resources