

Fully automated atlas-based method for prescribing 3D PRESS MR spectroscopic imaging: Toward robust and reproducible metabolite measurements in human brain
- PMID: 28470861
- PMCID: PMC5670025
- DOI: 10.1002/mrm.26718
Fully automated atlas-based method for prescribing 3D PRESS MR spectroscopic imaging: Toward robust and reproducible metabolite measurements in human brain
Abstract
Purpose: To implement a fully automated atlas-based method for prescribing 3D PRESS MR spectroscopic imaging (MRSI).
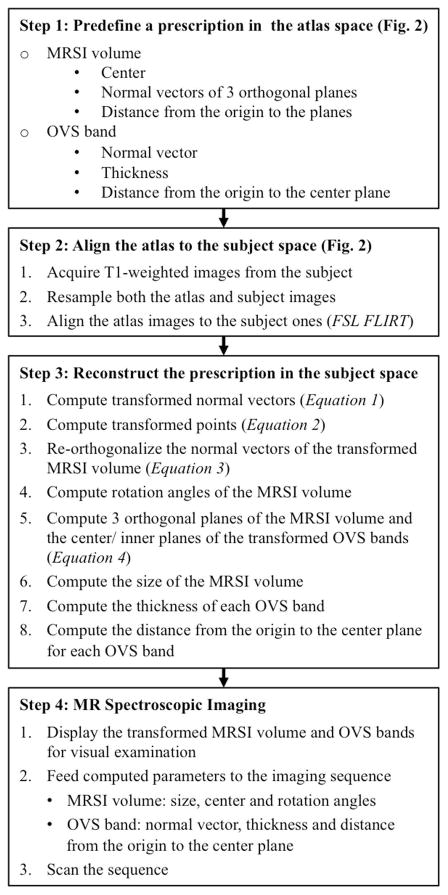
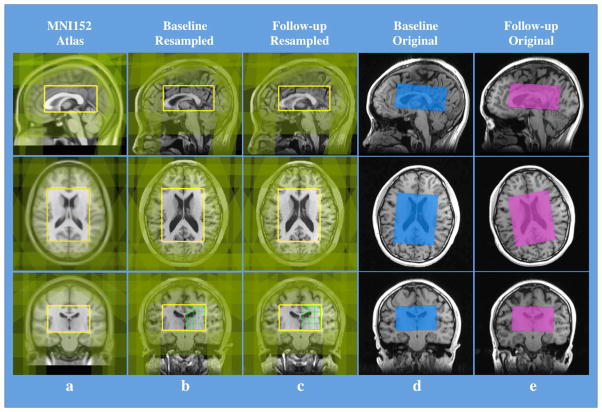
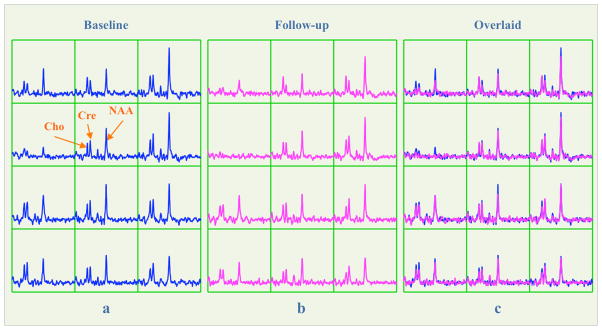
Methods: The PRESS selected volume and outer-volume suppression bands were predefined on the MNI152 standard template image. The template image was aligned to the subject T1 -weighted image during a scan, and the resulting transformation was then applied to the predefined prescription. To evaluate the method, H-1 MRSI data were obtained in repeat scan sessions from 20 healthy volunteers. In each session, datasets were acquired twice without repositioning. The overlap ratio of the prescribed volume in the two sessions was calculated and the reproducibility of inter- and intrasession metabolite peak height and area ratios was measured by the coefficient of variation (CoV). The CoVs from intra- and intersession were compared by a paired t-test.
Results: The average overlap ratio of the automatically prescribed selection volumes between two sessions was 97.8%. The average voxel-based intersession CoVs were less than 0.124 and 0.163 for peak height and area ratios, respectively. Paired t-test showed no significant difference between the intra- and intersession CoVs.
Conclusion: The proposed method provides a time efficient method to prescribe 3D PRESS MRSI with reproducible imaging positioning and metabolite measurements. Magn Reson Med 79:636-642, 2018. © 2017 International Society for Magnetic Resonance in Medicine.
Keywords: MRSI; atlas-based; automated; prescription; reproducibility.
© 2017 International Society for Magnetic Resonance in Medicine.
Figures
References
-
- Bottomley PA. Spatial localization in NMR spectroscopy in vivo. Ann N Y Acad Sci. 1987;508:333–48. - PubMed
-
- Li BS, Babb JS, Soher BJ, Maudsley AA, Gonen O. Reproducibility of 3D proton spectroscopy in the human brain. Magn Reson Med. 2002;47:439–46. - PubMed
-
- Langer DL, Rakaric P, Kirilova A, Jaffray DA, Damyanovich AZ. Assessment of metabolite quantitation reproducibility in serial 3D-(1)H-MR spectroscopic imaging of human brain using stereotactic repositioning. Magn Reson Med. 2007;58:666–73. - PubMed
Publication types
MeSH terms
Grants and funding
LinkOut - more resources
Full Text Sources
Other Literature Sources
Medical
Molecular Biology Databases
