Review
. 2017 May 10;34(5):529-557.
doi: 10.1039/c7np00016b.

The role of metals in mammalian olfaction of low molecular weight organosulfur compounds

Affiliations
Review

The role of metals in mammalian olfaction of low molecular weight organosulfur compounds

Eric Block et al. Nat Prod Rep. .

Abstract

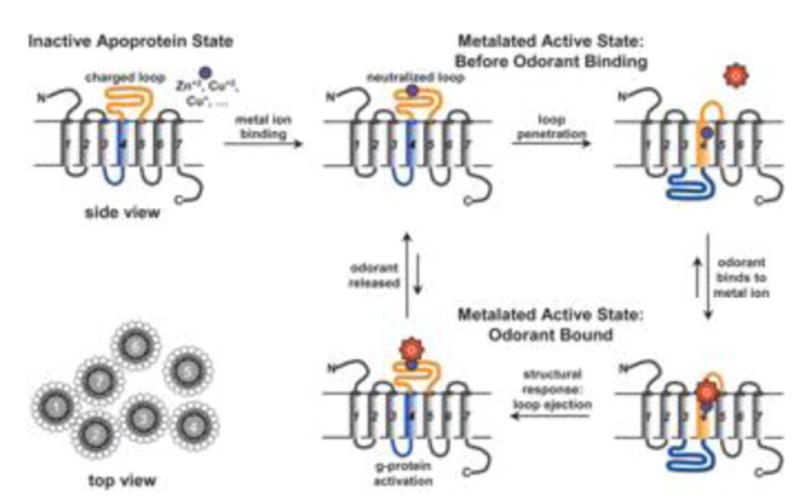
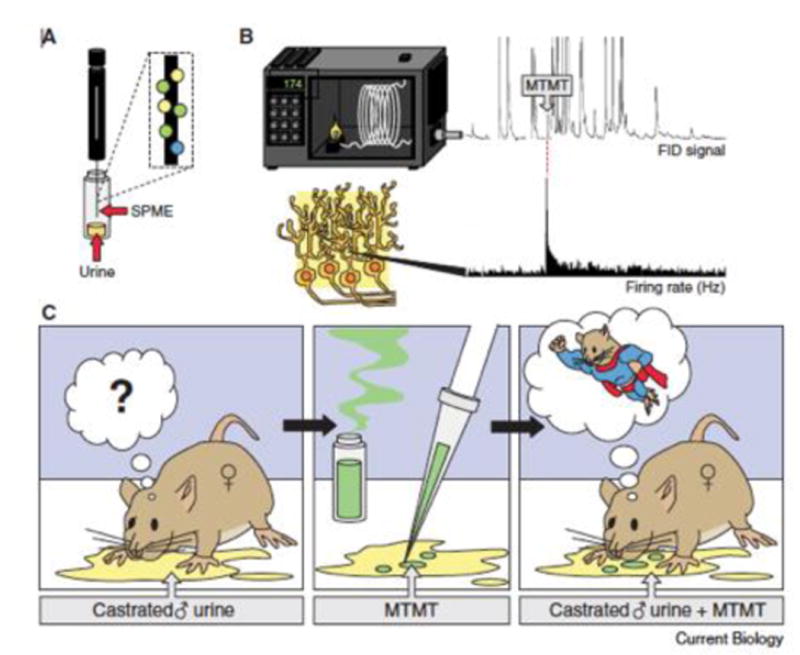
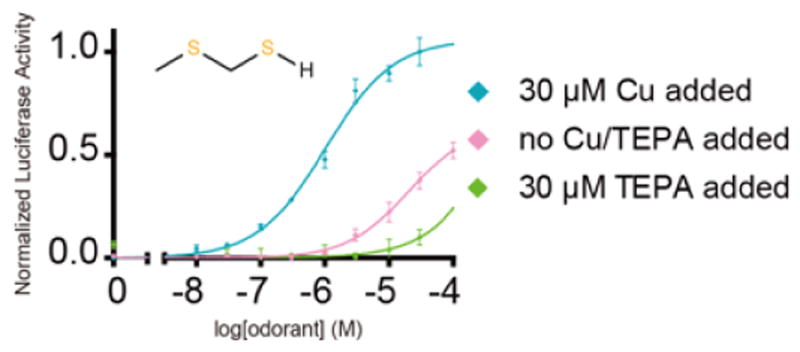
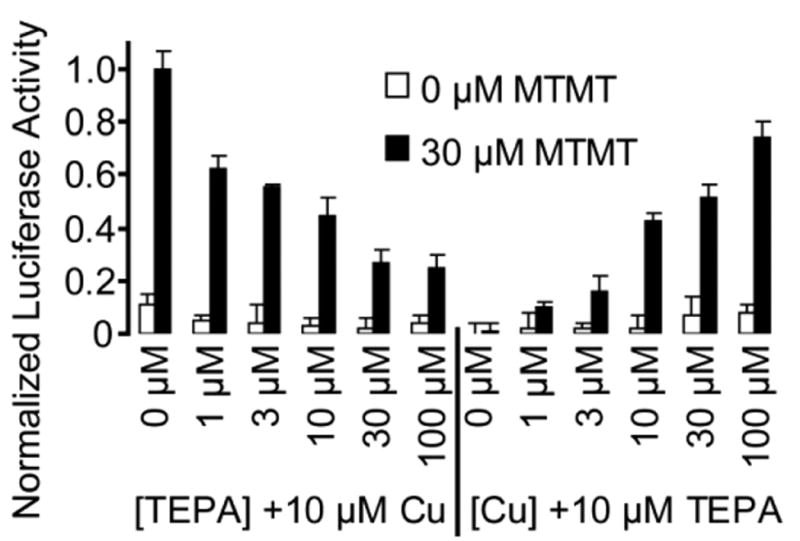
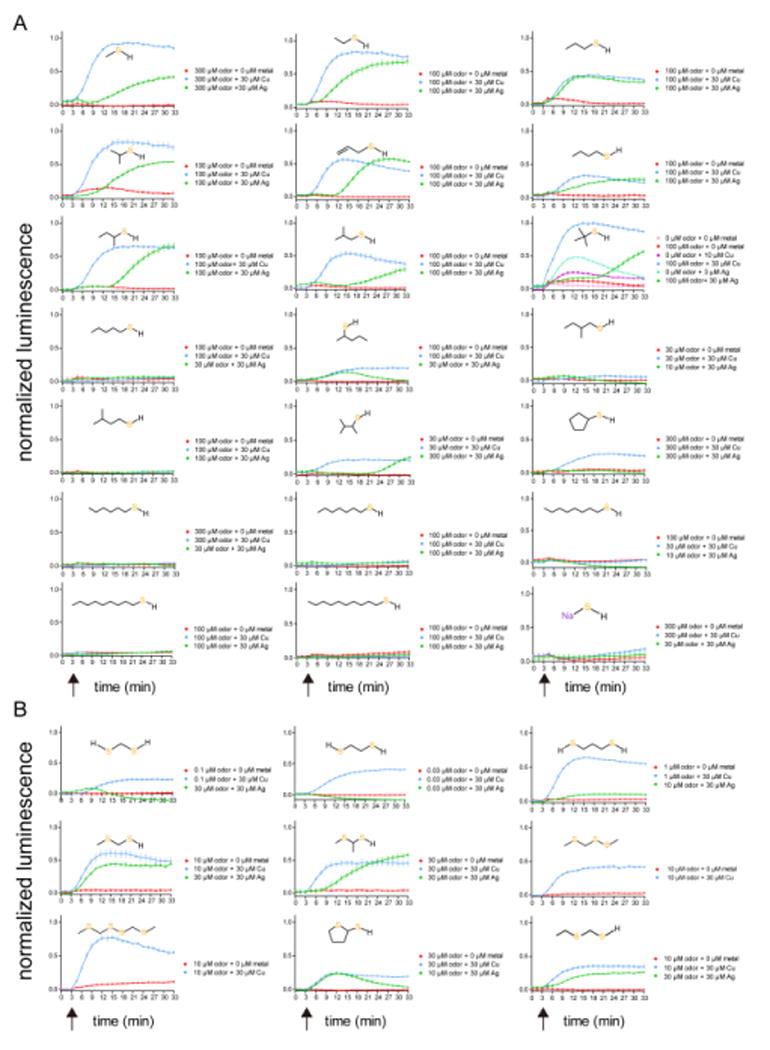
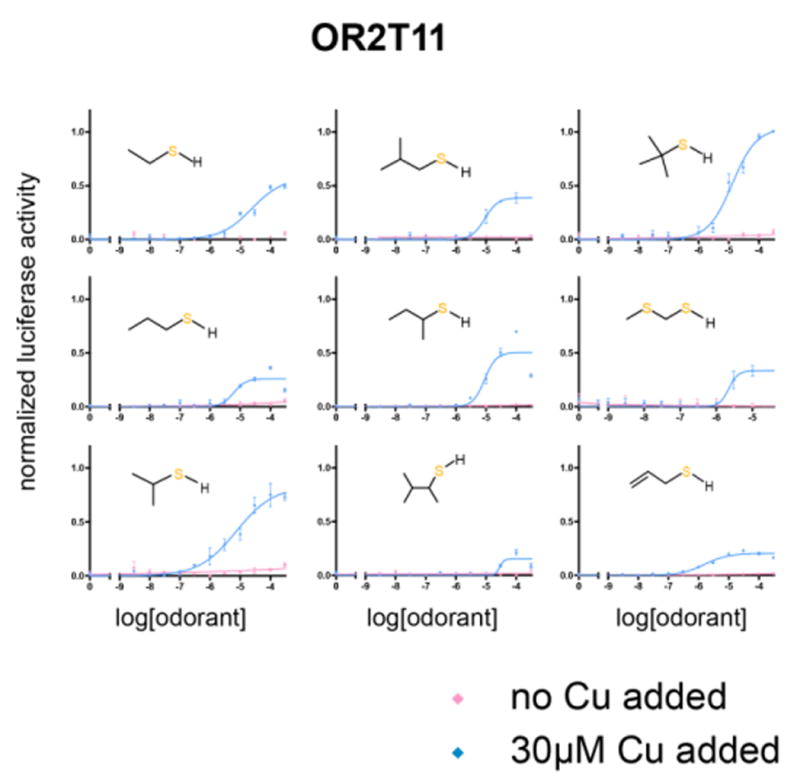
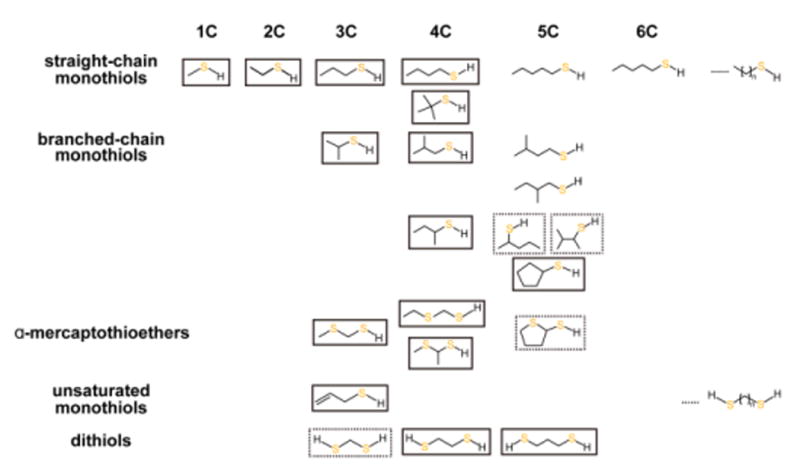
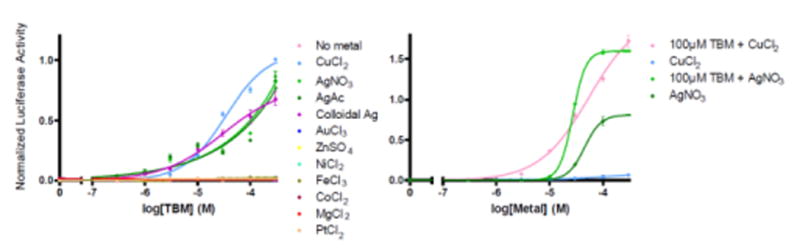
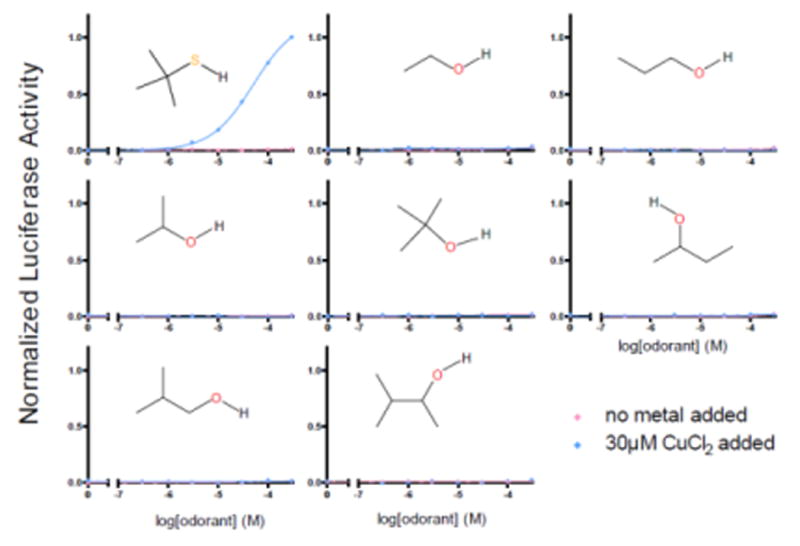
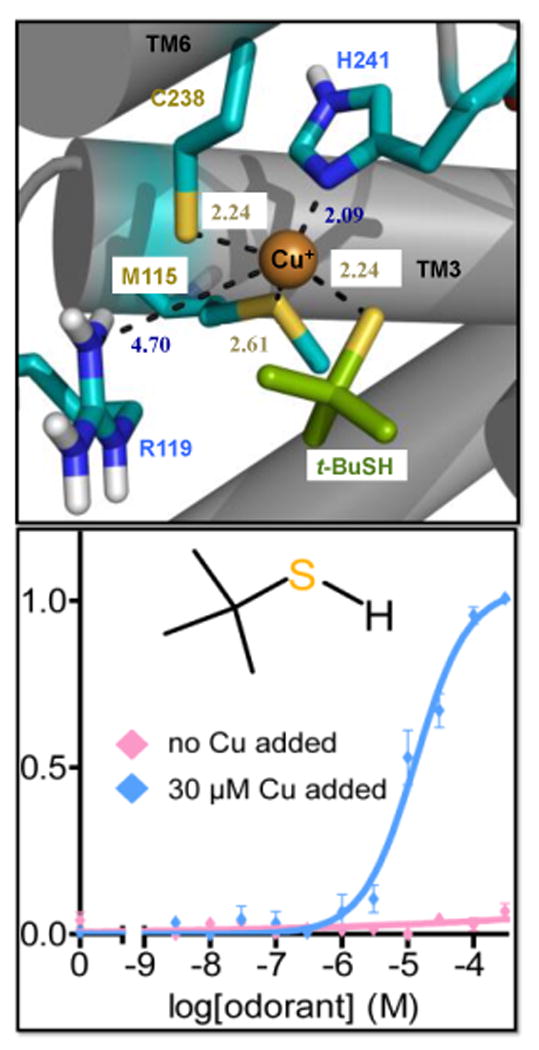
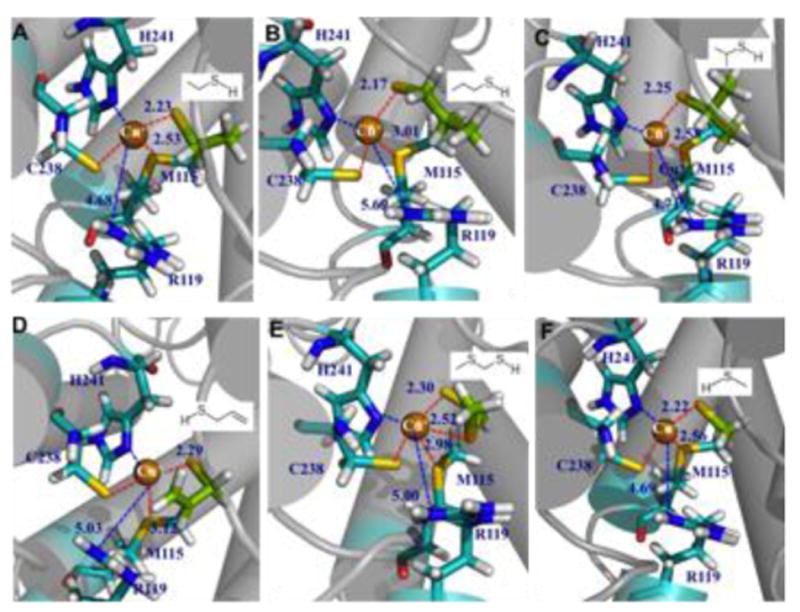
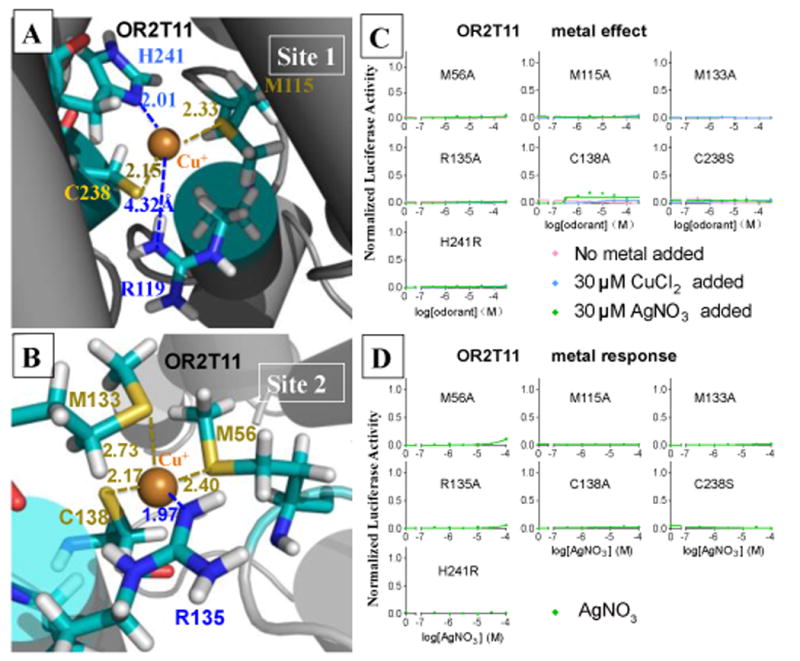
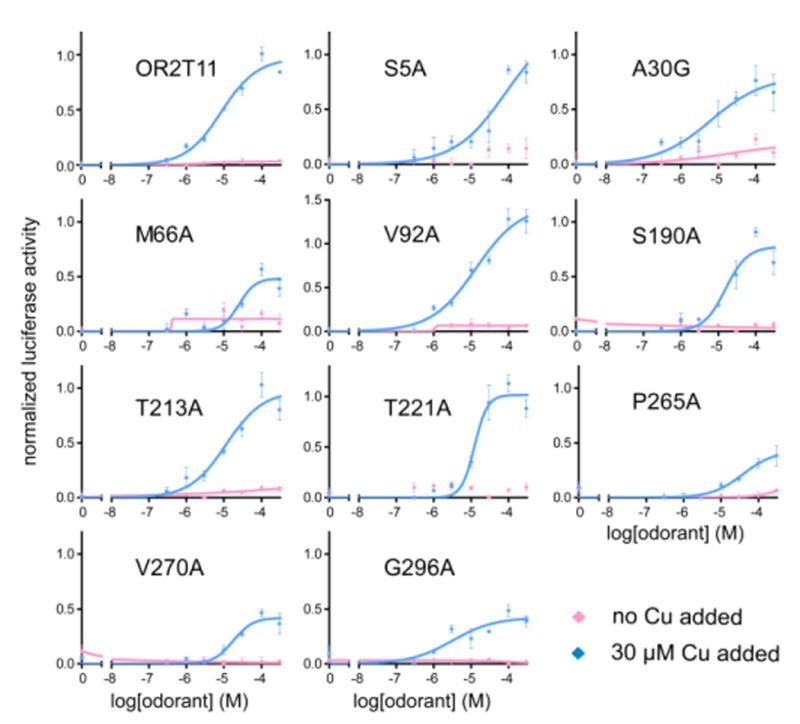
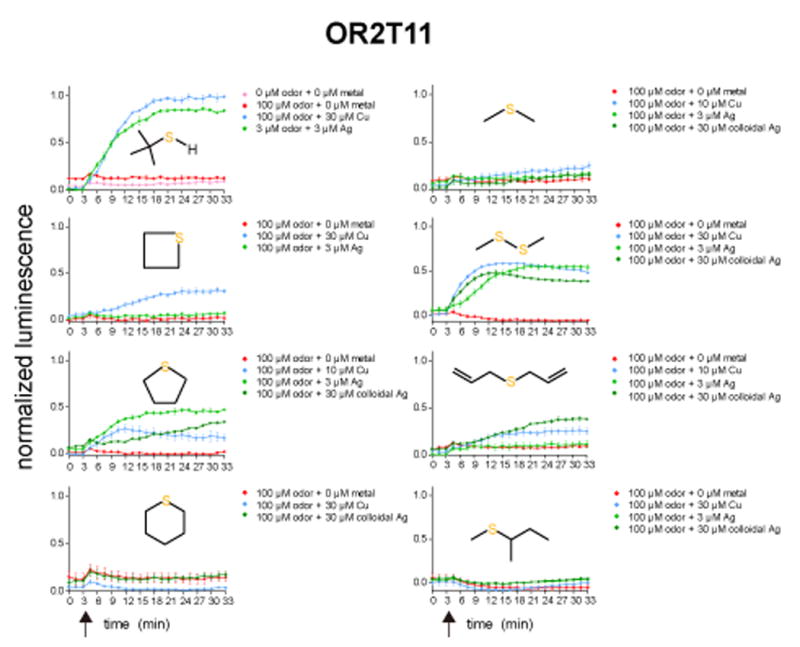
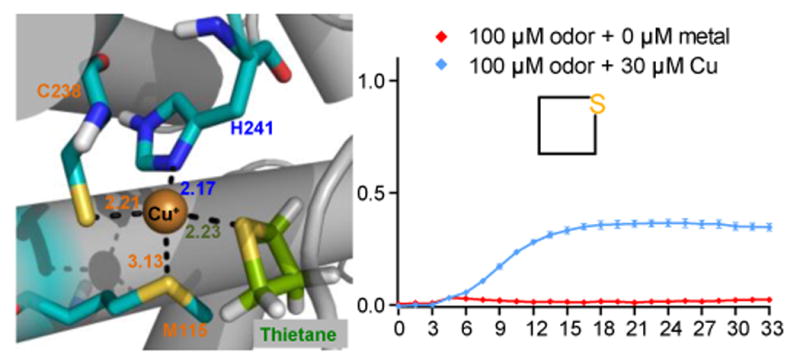
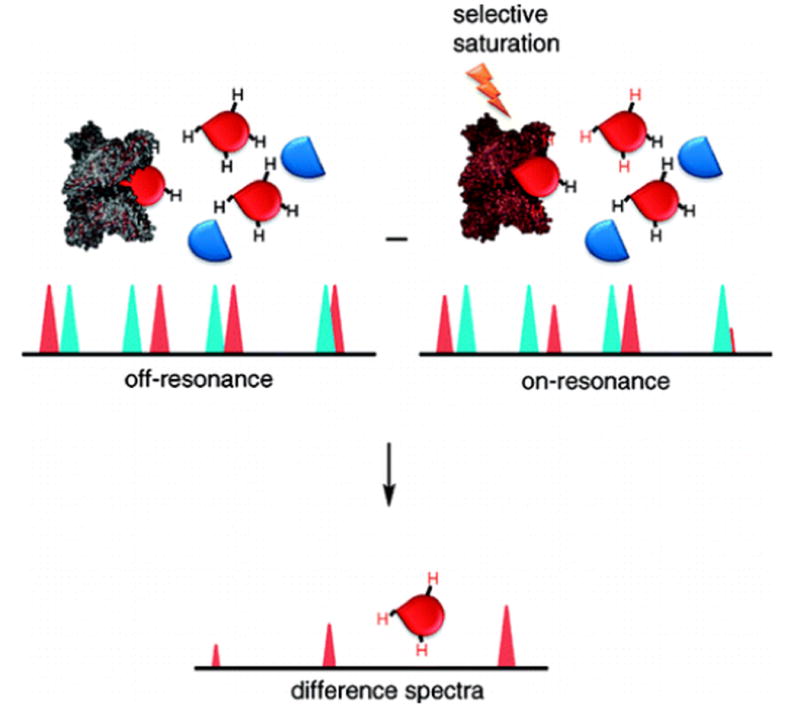
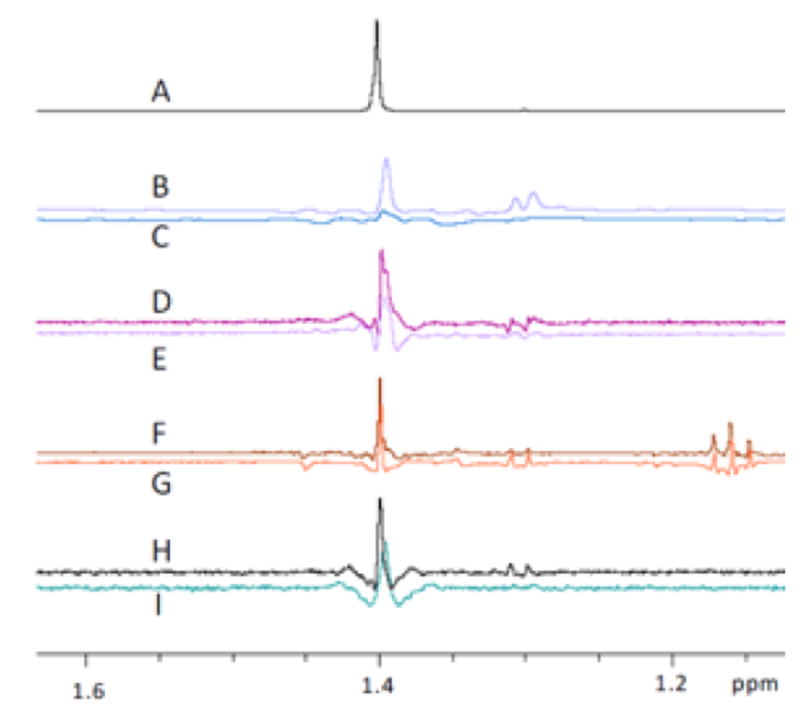
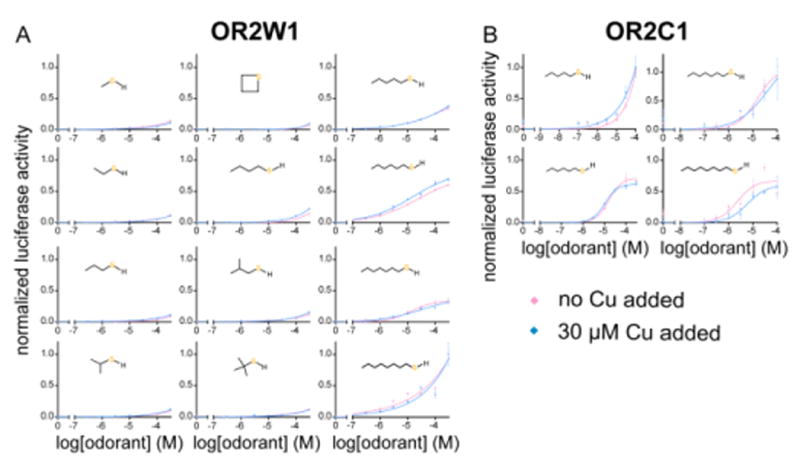
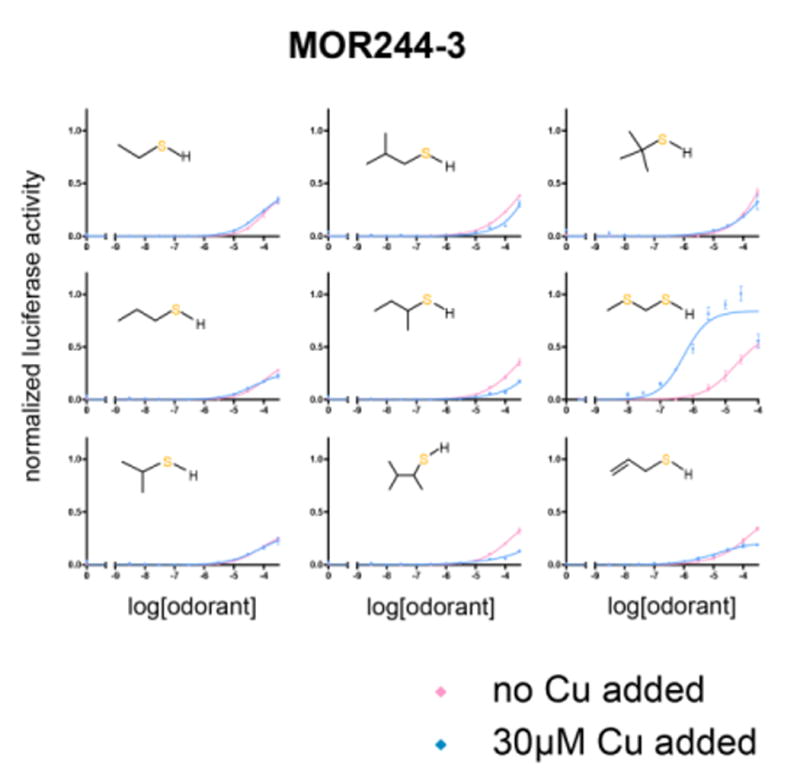
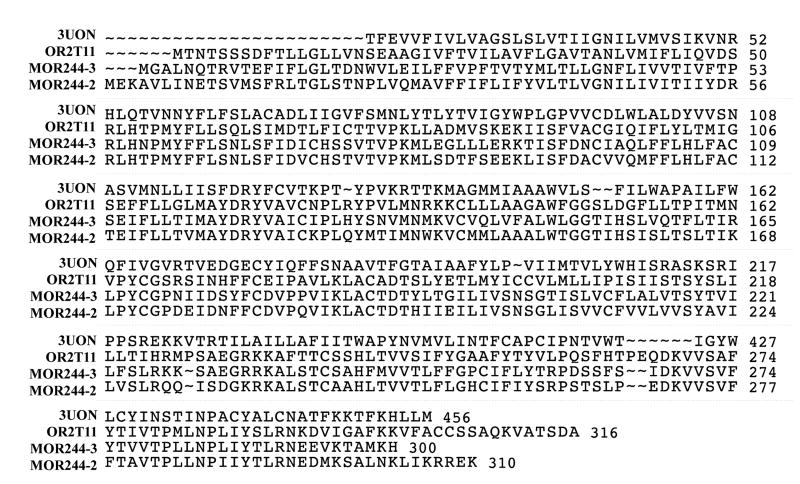
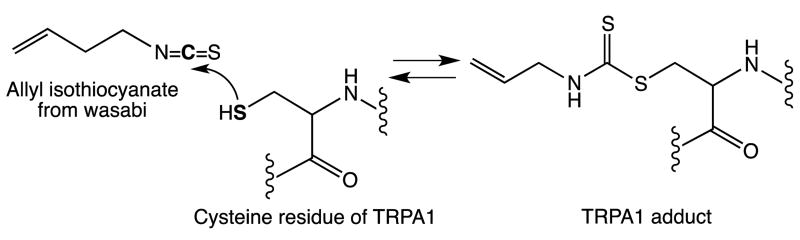
Covering: up to the end of 2017While suggestions concerning the possible role of metals in olfaction and taste date back 50 years, only recently has it been possible to confirm these proposals with experiments involving individual olfactory receptors (ORs). A detailed discussion of recent experimental results demonstrating the key role of metals in enhancing the response of human and other vertebrate ORs to specific odorants is presented against the backdrop of our knowledge of how the sense of smell functions both at the molecular and whole animal levels. This review emphasizes the role of metals in the detection of low molecular weight thiols, sulfides, and other organosulfur compounds, including those found in strong-smelling animal excretions and plant volatiles, and those used in gas odorization. Alternative theories of olfaction are described, with evidence favoring the modified "shape" theory. The use of quantum mechanical/molecular modeling (QM/MM), site-directed mutagenesis and saturation-transfer-difference (STD) NMR is discussed, providing support for biological studies of mouse and human receptors, MOR244-3 and OR OR2T11, respectively. Copper is bound at the active site of MOR244-3 by cysteine and histidine, while cysteine, histidine and methionine are involved with OR2T11. The binding pockets of these two receptors are found in different locations in the three-dimensional seven transmembrane models. Another recently deorphaned human olfactory receptor, OR2M3, highly selective for a thiol from onions, and a broadly-tuned thiol receptor, OR1A1, are also discussed. Other topics covered include the effects of nanoparticles and heavy metal toxicants on vertebrate and fish ORs, intranasal zinc products and the loss of smell (anosmia).


Figures

Fig. 1
Fig. 1
Human olfactory thresholds for detection of a series of comparable molecules with the structure CH3–X.
Fig. 2
Fig. 2
Space-filling models of ethanol (left) and ethanethiol (right) (from Wikipedia).
Fig. 3
Fig. 3
Human olfactory system. 1: Olfactory bulb 2: Mitral cells 3: Bone 4: Nasal epithelium 5: Glomerulus 6: Olfactory sensory neurons (OSNs) terminating in olfactory receptors (ORs) on cilia, bathed in nasal mucus [by Patrick J. Lynch, medical illustrator; from Wikipedia: Olfaction].
Fig. 4
Fig. 4
A schematic diagram of olfactory signal transduction. Olfactory signal transduction begins with the activation of an olfactory receptor (OR) in the ciliary membrane; this leads to an increase in cyclic AMP (cAMP) synthesis through the activation of adenylyl cyclase type III (ACIII) enzyme via a G protein (Golf)-coupled cascade. The increase in cAMP concentration causes cyclic nucleotide-gated (CNG) ion channels to open, leading to an increase in intracellular Ca2+ concentration and depolarization of the cell membrane by the Ca2+-activated Cl channel. Among several molecules of the olfactory signal transduction, OR, olfactory marker protein (OMP), Golf protein α-subunit (Gαolf), and ACIII have known to be olfactory specific molecules. [Reproduced from Kang, 2012]
Fig. 5
Fig. 5
Steric hindrance can eliminate odor: 2,6-di-tert-butyl-pyridine (with space-filling drawing [Ben Mills, Wikipedia], 2-(trimethylsilyl)thiophenol and ortho-substituted benzeneisonitrile.
Fig. 6
Fig. 6
The proposed mechanism of olfactory receptor response via a shuttlecock mechanism. In the absence of an odorant, the metal binding site is in a helical conformation. Upon odorant binding, the primary response is helix ejection (lower center). Copyright (2003), National Academy of Sciences.
Fig. 7
Fig. 7
Cartoon of the experimental approach used to identify MTMT as a mouse semiochemical [From Current Biology, with permission: Current Biology, 2005, 15(7), R255-257.]
Fig. 8
Fig. 8
Dose-response curves of MOR244-3 to MTMT with and without 30 μM exogenous copper ion. The horizontal scale shows the exponent of the odorant molar concentration (e.g., −6 = 10−6 M) while the vertical axis shows the normalized luciferase activity, an indirect measure of the response of the receptor to substrates. A dose–response curve with 30 μM of TEPA is also shown. An F-test was used to compare the dose–response curves with or without copper ion, with the results showing significant p-values after Bonferroni corrections. Adapted with permission; Copyright 2012, PNAS.
Fig. 9
Fig. 9
Responses of MOR244-3 to 0 and 30 μM MTMT with 10 μM Cu2+ or TEPA and increasing the amount of TEPA or Cu2+, respectively. Responses are normalized to the highest response to MTMT. Adapted with permission; Copyright 2012, PNAS.
Fig. 10
Fig. 10
Mice were trained to associate either eugenol or MTMT with sugar reward. On the test day, mice were injected with distilled water or TEPA and then tested for the ability to discriminate the two odors. Left: TEPA injection specifically abolishes olfactory detection of MTMT. Right: Recovery of olfactory discrimination ability for eugenol and MTMT two days after TEPA injection. Two days after the initial testing, mice were retested for the recovery of the ability to discriminate the two odors. The y axis represents time spent investigating each odorant during the 9-min test period, shown as mean ± SEM. Paired t test was used to compare the investigation times between groups. *P < 0.05 (n = 4). Adapted with permission; Copyright 2012, PNAS.
Fig. 11
Fig. 11
Schematic representation of response profiles of the MTMT derivatives.
Fig. 12
Fig. 12
Dose–response curves of MOR244-3 to selected sulfur-containing compounds with and without 30 μM exogenous Cu2+ addition. For odors with a significant response in the absence of exogenous Cu2+, as defined arbitrarily by a top value greater than 0.32, dose–response curves with 30 μM of TEPA are also shown. F tests were used to compare the pairs of dose–response curves with or without Cu2+. Asterisks represent significance of P values after Bonferonni corrections. **P < 0.01 (n = 3). Adapted with permission; Copyright 2012, PNAS.
Fig. 13
Fig. 13
Proposed mechanism for the initial reaction of thiols with Cu(II) and Cu(I)–thiol complex formation. Only the thiol ligands are shown. Adapted from H. Yi, C. Song, Y. Li, C. W. Pao, J. F. Lee and A. Lei, Chemistry: A European Journal, 2016, 22(51), 18331–18334. Copyright John Wiley and Sons, 2016.
Fig. 14
Fig. 14
Candidate copper-binding sites in MOR244-3 as shown by single point mutations; H = histidine (red), C = cysteine (yellow), M = methionine (green). The grey rectangle represents the lipid bilayer. Not shown is a glycosylation site near the extracellular N-terminal region and putative disulfide bridges between the cysteines in the extracellular loops. Residues circled in blue are those that exhibited complete loss-of-function phenotypes in the luciferase assay. Adapted with permission; Copyright 2012, PNAS.
Fig. 15
Fig. 15
(Top) (a) QM/MM model of the MOR244-3, including an aqueous channel (green) inside the barrel of TM α-helices (pink). (b) MTMT bound to Cu+ coordinated to the heteroatoms of H105 and C109, and surrounded by a cage of H-bonds linking H105, D180, K269, Y258, and water molecules. (Bottom) The active site of MOR244-3 without (c) and with (d) the MTMT ligand.
Fig. 16
Fig. 16
QM/MM optimized models of the MOR244-3 C109V (a) and C109M (b) mutants with MTMT bound to Cu+. Coordination distances (dashed lines) are in Angstroms.
Fig. 17
Fig. 17
Copper enhances the activation of the ortholog of MOR244-3 in response to MTMT in Myotis lucifugus (the little brown bat).
Fig. 18
Fig. 18
On March 18, 1937 in New London, Texas, a school tragedy sparked the need for gas odorization (photo courtesy of Dr. T. J. Bruno).
Fig. 19
Fig. 19
OR2T11 responds to selected thiol compounds in the GloSensor™ cAMP assay. Real-time measurement of OR2T11 activation in response to (A) monothiols and sodium hydrosulfide (at pH 6.14), and (B) dithiols and α-mercaptothioethers as detected within 30 min of odorant addition. Metals used in the assay were CuCl2 and AgNO3, except for methanethiol and sodium hydrosulfide, where colloidal silver was used. The arrow along the x-axis indicates the time point of odorant addition; y-axis indicates normalized luminescence±SEM (N = 3). All responses are normalized to the highest response of OR2T11 to TBM. Reprinted with permission from S. Li, L. Ahmed, R. Zhang, Y. Pan, H. Matsunami, J. L. Burger, E. Block, V. S. Batista and H. Zhuang. J. Am. Chem. Soc., 2016, 138, 13281–13288. Copyright 2016 American Chemical Society.
Fig. 20
Fig. 20
OR2T11 responds with a copper effect to unbranched and branched alkanethiols with 1-4 carbons, as well as MTMT and 2-propenethiol in the luciferase assay. Reprinted with permission from S. Li, L. Ahmed, R. Zhang, Y. Pan, H. Matsunami, J. L. Burger, E. Block, V. S. Batista and H. Zhuang. J. Am. Chem. Soc., 2016, 138, 13281–13288. Copyright 2016 American Chemical Society.
Fig. 21
Fig. 21
A schematic diagram of sulfur-containing compounds screened with OR2T11. Odors boxed with solid lines showed prominent responses in the presence of 30 μM Cu2+ and odors boxed with dashed lines showed less prominent responses, as defined by a more than 70% reduction in efficacy compared with TBM in the GloSensor™ cAMP assay. “1C” through “6C” refer to the number of the carbon atoms in the original straight-chain monothiol compounds. Straight-chain monothiols with 10 > C > 5 were tested and deemed inactive. Reprinted with permission from S. Li, L. Ahmed, R. Zhang, Y. Pan, H. Matsunami, J. L. Burger, E. Block, V. S. Batista and H. Zhuang. J. Am. Chem. Soc., 2016, 138, 13281–13288. Copyright 2016 American Chemical Society.
Fig. 22
Fig. 22
Human thiol receptor responds to tert-butyl mercaptan (TBM) with silver as well as copper effect; it also responds to silver but not copper without added thiol. Reprinted with permission from S. Li, L. Ahmed, R. Zhang, Y. Pan, H. Matsunami, J. L. Burger, E. Block, V. S. Batista and H. Zhuang. J. Am. Chem. Soc., 2016, 138, 13281–13288. Copyright 2016 American Chemical Society.
Fig. 23
Fig. 23
Dose-response curves for human OR2T11 and selected alcohols; y-axis indicates normalized response ± SEM (N = 3). Responses are normalized to the highest thiol response of each OR. Reprinted with permission from S. Li, L. Ahmed, R. Zhang, Y. Pan, H. Matsunami, J. L. Burger, E. Block, V. S. Batista and H. Zhuang. J. Am. Chem. Soc., 2016, 138, 13281–13288. Copyright 2016 American Chemical Society.
Fig. 24
Fig. 24
Human thiol receptor OR2T11: QM/MM modeling, showing binding of Cu+ to TBM and to C238, H241, R119 and M115.
Fig. 25
Fig. 25
QM/MM optimized models of (A) EtSH, (B) n-PrSH, (C) i-PrSH, (D) 2-propenethiol, (E) (methylthio)methanethiol, and (F) methanethiol, all bound to the Cu+ ion in the OR2T11 site consisting of M115, C238 and H241. The cysteine and ligands are in the thiolate form. Reprinted with permission from S. Li, L. Ahmed, R. Zhang, Y. Pan, H. Matsunami, J. L. Burger, E. Block, V. S. Batista and H. Zhuang. J. Am. Chem. Soc., 2016, 138, 13281–13288. Copyright 2016 American Chemical Society.
Fig. 26
Fig. 26
Binding sites of OR2T11. Panels (A) and (B) show the two binding sites of OR2T11 consisting of M115, C238 and H241, and M56, M133, R135 and C138, respectively; panels (C) and (D) show the mutagenesis studies on the corresponding amino acid residues in the binding site of OR2T11 (e.g., in (C), M56A indicates that methionine 56 has been mutated to alanine). The cysteine is in the thiolate form. Reprinted with permission from S. Li, L. Ahmed, R. Zhang, Y. Pan, H. Matsunami, J. L. Burger, E. Block, V. S. Batista and H. Zhuang. J. Am. Chem. Soc., 2016, 138, 13281–13288. Copyright 2016 American Chemical Society.
Fig. 27
Fig. 27
OR2T11 control mutants. Dose-response curves of OR2T11 control mutants to TBM. The y-axis indicates normalized response±SEM (N = 3). All responses are normalized to the highest response of wild type OR2T11 to TBM with 30 μM of Cu added.
Fig. 28
Fig. 28
Response of sulfur compounds to OR2T11 in the presence or absence of copper and silver salts and colloidal silver in the GloSensor cAMP assay. Real-time measurement of OR2T11 activation is shown as detected within 30 min of odorant addition. The arrow indicates the time point of odorant addition. y-axis indicates normalized luminescence±SEM (N = 3). All responses are normalized to the highest response of OR2T11 to TBM. Reprinted with permission from S. Li, L. Ahmed, R. Zhang, Y. Pan, H. Matsunami, J. L. Burger, E. Block, V. S. Batista and H. Zhuang. J. Am. Chem. Soc., 2016, 138, 13281–13288. Copyright 2016 American Chemical Society.
Fig. 29
Fig. 29
QM/MM optimized models, with indicated distances, of thietane bound to the Cu+ ion in the OR2T11 site consisting of M115, C238 and H241. The cysteine is in the thiolate form.
Fig. 30
Fig. 30
Saturation-transfer difference (STD) NMR spectroscopy. Reprinted with permission from Viegas, J. Manso, F. L. Nobrego and E. J. Cabrita, J. Chem. Educ., 2011, 88 (7), 990–994. Copyright 2011 American Chemical Society.
Fig. 31
Fig. 31
(A) NMR spectrum of TBM in acetone-d6; STD spectrum of cells transfected to express OR2T11 in HBSS/D2O with TBM and (B) with CuCl2 or (C) prior to CuCl2 addition. STD spectrum of cells transfected to express OR2T11 in HBSS/D2O with TBM and (D) with AgNO3 or (E) prior to AgNO3 addition. STD spectrum of cells transfected to express MOR244-3 in HBSS/D2O with TBM and (F) with CuCl2 or (G) prior to CuCl2 addition. STD spectrum of cells transfected to express MOR244-3 in HBSS/D2O with TBM and (H) with AgNO3 or (I) prior to AgNO3 addition. Reprinted with permission from S. Li, L. Ahmed, R. Zhang, Y. Pan, H. Matsunami, J. L. Burger, E. Block, V. S. Batista and H. Zhuang. J. Am. Chem. Soc., 2016, 138, 13281–13288. Copyright 2016 American Chemical Society.
Fig. 32
Fig. 32
OR2W1 and OR2C1 respond to selected monothiols. Dose-response curves of (A) OR2W1 and (B) OR2C1 to various monothiols in the luciferase assay. The y-axis indicates normalized response±SEM (N = 3). All responses are normalized to the highest response of each receptor (N = 3). Reprinted with permission from S. Li, L. Ahmed, R. Zhang, Y. Pan, H. Matsunami, J. L. Burger, E. Block, V. S. Batista and H. Zhuang. J. Am. Chem. Soc., 2016, 138, 13281–13288. Copyright 2016 American Chemical Society.
Fig. 33
Fig. 33
MOR244-3 selectively employs copper in binding to thiols, only showing a copper effect with MTMT; y-axis indicates normalized response ±SEM (N = 3). All responses are normalized to the highest thiol response of each OR. Reprinted with permission from S. Li, L. Ahmed, R. Zhang, Y. Pan, H. Matsunami, J. L. Burger, E. Block, V. S. Batista and H. Zhuang. J. Am. Chem. Soc., 2016, 138, 13281–13288. Copyright 2016 American Chemical Society.
Fig. 34
Fig. 34
Multiple sequence alignment of the human M2 muscarinic receptor, human olfactory receptor OR2T11, mouse olfactory receptors MOR244-3 and MOR244-2. Reprinted with permission from S. Li, L. Ahmed, R. Zhang, Y. Pan, H. Matsunami, J. L. Burger, E. Block, V. S. Batista and H. Zhuang. J. Am. Chem. Soc., 2016, 138, 13281–13288. Copyright 2016 American Chemical Society.
Scheme 1
Scheme 1
Proposed reaction pathway for the reversible activation of TRPA1 by allyl isothiocyante from wasabi.

Similar articles

Cited by

References

    1. Su X, Matsunami H, Zhuang H. In: Bioelectronic Nose. Park TH, editor. Ch. 4. Springer; 2014. pp. 69–81.
    1. Ohloff G, Pickenhagen W, Kraft P. Scent and Chemistry: The Molecular World of Odors. Wiley-VCH; Zurich: 2012.
    1. Andersen KK, Bernstien DT, Caret RL, Romanczyk LJ. Tetrahedron. 1982;38:1965–1970.
    2. Wood WF, Sollers BG, Dragoo GA, Dragoo JW. J Chem Ecol. 2002;28:1865–1870. - PubMed
    1. Duque C, Bonilla A, Bautista E, Zea S. Biochem Syst Ecol. 2001;29:459–467. - PubMed
    2. Shirasu M, Fujioka K, Kakishima S, Nagai S, Tomizawa Y, Tsukaya H, Murata J, Manome Y, Touhara K. Biosci Biotechnol Biochem. 2010;74(12):2550–2554. - PubMed
    3. Stensmyr MC, Urru I, Collu I, Celander M, Hansson BS, Angioy AM. Nature. 2002;420:625–626. - PubMed
    1. Askim JR, Mahmoudi M, Suslick KS. Chem Soc Rev. 2013;42:8649–8682. - PubMed
    2. Fischer E, Penzoldt F. Justus Liebigs Ann Chem. 1887;239:131–135.
    3. Kraft P, Mannschreck A. J Chem Educ. 2010;87:598–603.
    4. Barham P, Skibsted LH, Bredie WLP, Frøst MB, Møller P, Risbo J, Snitkjær P, Mortensen LM. Chem Rev. 2010;110:2313–2365. - PMC - PubMed

Publication types