. 2017 Jun 6;89(11):5940-5948.
doi: 10.1021/acs.analchem.7b00396. Epub 2017 May 18.

Metabolite Spectral Accuracy on Orbitraps

Affiliations

Metabolite Spectral Accuracy on Orbitraps

Xiaoyang Su et al. Anal Chem. .

Abstract

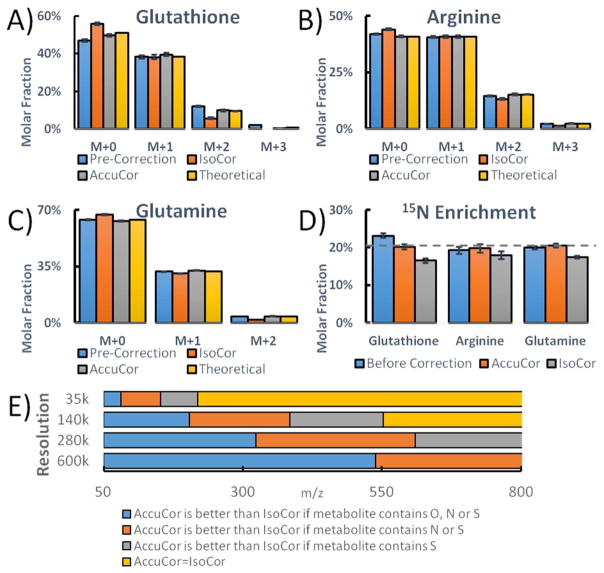
Orbitraps are high-resolution ion-trap mass spectrometers that are widely used in metabolomics. While the mass accuracy and resolving power of orbitraps have been extensively documented, their spectral accuracy, i.e., accuracy in measuring the abundances of isotopic peaks, remains less studied. In analyzing spectra of unlabeled metabolites, we discovered a systematic under representation of heavier natural isotopic species, especially for high molecular weight metabolites (∼20% under-measurement of [M + 1]/[M + 0] ratio at m/z 600). We hypothesize that these discrepancies arise for metabolites far from the lower limit of the mass scan range, due to the weaker containment in the C-trap that results in suboptimal trajectories inside the Orbitrap analyzer. Consistent with this, spectral fidelity was restored by dividing the mass scan range (initially 75 m/z to 1000 m/z) into two scan events, one for lower molecular weight and the other for higher molecular weight metabolites. Having thus obtained accurate mass spectra at high resolution, we found that natural isotope correction for high-resolution labeling data requires more sophisticated algorithms than typically employed: the correction algorithm must take into account whether isotopologues with the same nominal mass are resolved. We present an algorithm and associated open-source code, named AccuCor, for this purpose. Together, these improvements in instrument parameters and natural isotope correction enable more accurate measurement of metabolite labeling and thus metabolic flux.


Figures

Figure 1
Figure 1
Impact of spectral accuracy on metabolic flux analysis. A) Simplified metabolic network (similar to glycolysis and pentose phosphate pathway) used to illustrate relationship between spectral accuracy and fluxes. The circles represent carbon atoms. A is 100% 2-13C labeled, which is colored in blue. B–F are partially labeled, which are colored in green. Given the fluxes v1v6 in the network, the steady-state labeling patterns of B and F can be determined as shown below. These labeling patterns also uniquely determine v2v6, relative to v1. B) The plot shows possible flux combinations given certain spectral error ranges. v2 and v6 are shown on the two axes, due to the fact that these are the two free fluxes in the network, which at steady state determine v3, v4, and v5 by flux balance. The dash lines show the true fluxes v2=110 and v4=20.
Figure 2
Figure 2
Spectral accuracy of NAD. A) The measured mass distribution of unlabeled NAD is compared to the theoretical mass distribution due to isotope natural abundance. B) The correlation between absolute spectral error and metabolite m/z. C) The correlation between absolute spectral error and metabolite ion counts. D) The spectral discrepancies of NAD under two AGC target settings. E) The extracted ion chromatogram of NAD. F) The scan-by-scan mass accuracy of NAD. G) The scan-by-scan spectral discrepancy of NAD. H) The spectral accuracy of NAD under different resolution. The bars represent mean of n=4 and the error bars represent s.d.
Figure 3
Figure 3
Mass scan window affects spectral accuracy. A) The spectral discrepancy of NAD using full scan (m/z 75–1000) and SIM (m/z 660–670). B–F) The spectral discrepancy of different metabolites under full scan and split scan windows. The bars represent mean of n=4; error bars represent s.d.
Figure 4
Figure 4
High resolution results in isotopologue separation. A) The mass spectra of serine M+1 at different mass spectrometer resolving power. The relative intensity of each peak is labeled on the spectra. B) The minimal nominal resolution is plotted for each isotope for 13C labeled compounds. C) The minimal nominal resolution is plotted for each isotope for 15N labeled compounds. D) The minimal nominal resolution is plotted for each isotope for 2H labeled compounds.
Figure 5
Figure 5
The comparison of correction methods. A–C) The labeling patterns of glutathione, arginine and glutamine before and after correction are plotted. The theoretical pattern is calculated based on the experimental condition of 20% 15N enrichment. D) 15N enrichment is calculated from the labeling patterns (n=6, mean ± s.d.). The experimentally introduced enrichment of 20% is shown by the dashed line. E) Performance of AccuCor and IsoCor as a function of analyte m/z and atomic composition and mass spectrometer resolving power.

References

    1. Zamboni N, Saghatelian A, Patti GJ. Mol Cell. 2015;58:699–706. - PMC - PubMed
    1. Buescher JM, Antoniewicz MR, Boros LG, Burgess SC, Brunengraber H, Clish CB, DeBerardinis RJ, Feron O, Frezza C, Ghesquiere B, Gottlieb E, Hiller K, Jones RG, Kamphorst JJ, Kibbey RG, Kimmelman AC, Locasale JW, Lunt SY, Maddocks OD, Malloy C, Metallo CM, Meuillet EJ, Munger J, Noh K, Rabinowitz JD, Ralser M, Sauer U, Stephanopoulos G, St-Pierre J, Tennant DA, Wittmann C, Vander Heiden MG, Vazquez A, Vousden K, Young JD, Zamboni N, Fendt SM. Curr Opin Biotechnol. 2015;34:189–201. - PMC - PubMed
    1. Antoniewicz MR. J Ind Microbiol Biotechnol. 2015;42:317–325. - PubMed
    1. van Winden WA, Wittmann C, Heinzle E, Heijnen JJ. Biotechnol Bioeng. 2002;80:477–479. - PubMed
    1. Millard P, Letisse F, Sokol S, Portais JC. Bioinformatics. 2012;28:1294–1296. - PubMed

Publication types