Review
. 2017 Jul 25:40:425-451.
doi: 10.1146/annurev-neuro-072116-031418. Epub 2017 May 3.

Circuits and Mechanisms for Surround Modulation in Visual Cortex

Affiliations
Review

Circuits and Mechanisms for Surround Modulation in Visual Cortex

Alessandra Angelucci et al. Annu Rev Neurosci. .

Abstract

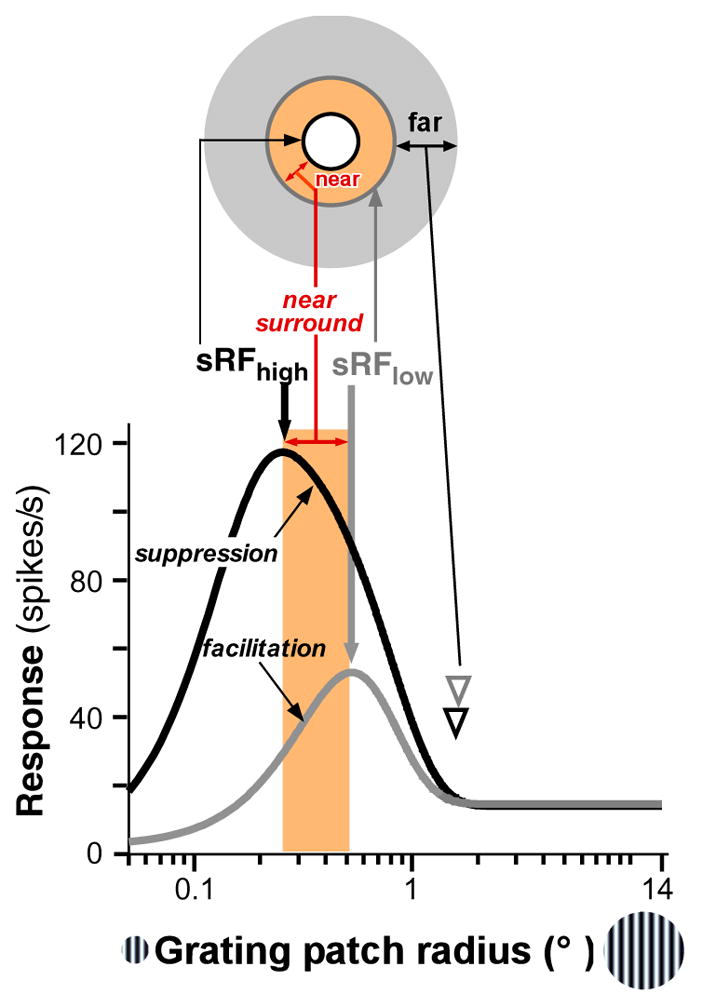
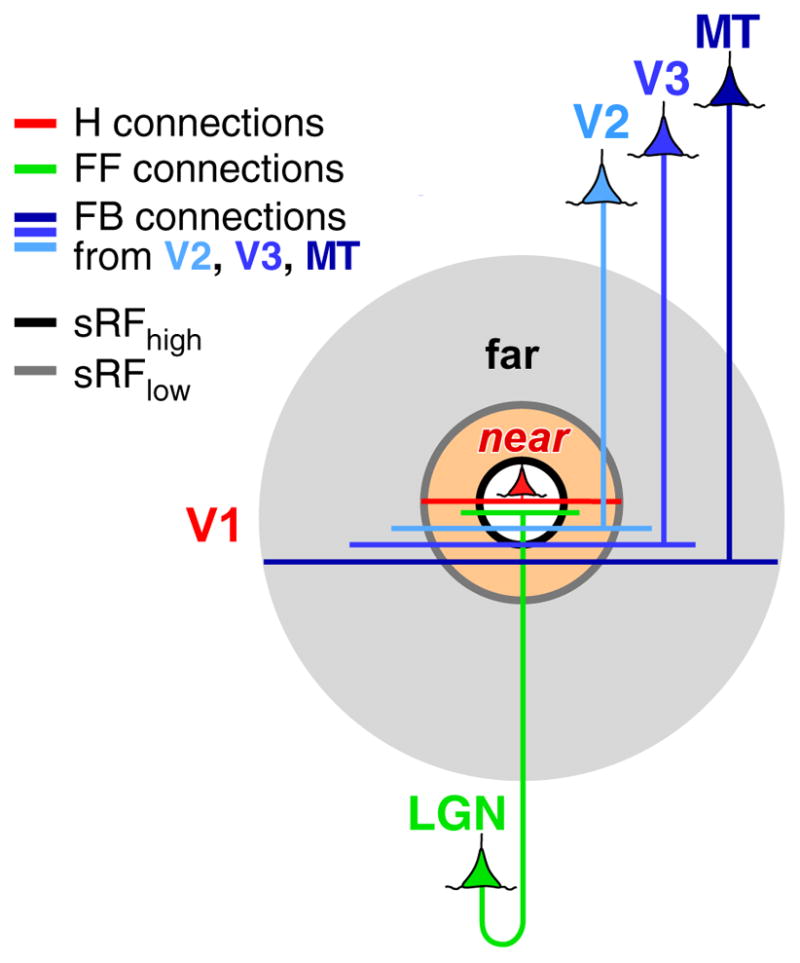
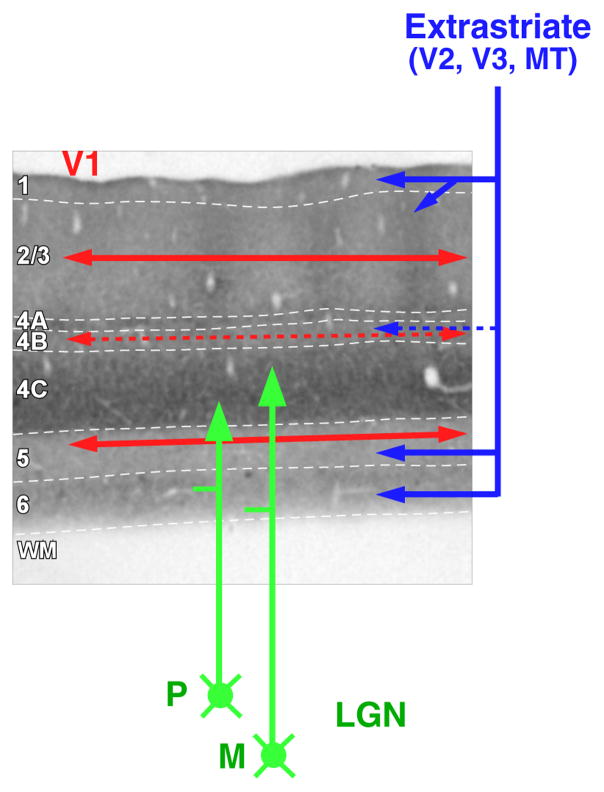
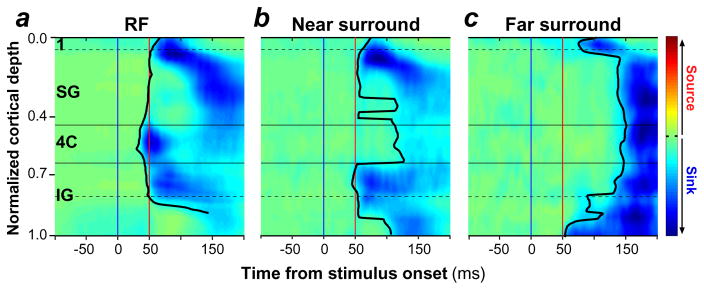
Surround modulation (SM) is a fundamental property of sensory neurons in many species and sensory modalities. SM is the ability of stimuli in the surround of a neuron's receptive field (RF) to modulate (typically suppress) the neuron's response to stimuli simultaneously presented inside the RF, a property thought to underlie optimal coding of sensory information and important perceptual functions. Understanding the circuit and mechanisms for SM can reveal fundamental principles of computations in sensory cortices, from mouse to human. Current debate is centered over whether feedforward or intracortical circuits generate SM, and whether this results from increased inhibition or reduced excitation. Here we present a working hypothesis, based on theoretical and experimental evidence, that SM results from feedforward, horizontal, and feedback interactions with local recurrent connections, via synaptic mechanisms involving both increased inhibition and reduced recurrent excitation. In particular, strong and balanced recurrent excitatory and inhibitory circuits play a crucial role in the computation of SM.

Keywords: extrastriate cortex; feedback; horizontal connection; primary visual cortex; recurrent circuits; striate cortex.


Figures

Figure 1
Figure 1
Spatial summation and SM in V1. Response of a cell in macaque V1 to high-contrast (black curve) and low-contrast (gray curve) grating patches of increasing radius. The cell’s response increases up to a peak, corresponding to the size of the summation RF at high (sRFhigh, thick black arrow) or low (sRFlow, thick gray arrow) contrast, and then is suppressed as the stimulus extends into the RF surround. At low contrast, the peak of the size-tuning curve is shifted to the right relative to the high contrast peak. The near surround is the region between the sRFhigh and sRFlow (orange shading). Stimulation of this region causes suppression at high contrast but facilitation at low contrast. The far surround is the region beyond the near surround (gray annulus). Far-SM shows similar contrast dependence to near-SM. Arrowheads indicate the surround radius. The diagram at the top is a schematic representation of the different components of the sRF and surround. Figure modified from Shushruth et al. (2009). Abbreviations: sRF, summation receptive field; SM, surround modulation.
Figure 2
Figure 2
Hypothetical circuits for SM in V1. FF (green), H (red), and FB (blue) connections all contribute to the RF (white shaded area) and to near-SM (orange shaded area), but only feedback contributes to far-SM (gray shaded area), with feedback arising from areas V2, V3, and MT contributing to progressively more distant surround regions. Figure modified from Angelucci et al. (2002). Abbreviations: FB, feedback; FF, feedforward; H, horizontal; sRFhigh and sRFlow, summation receptive field measured at high or low contrast, respectively; SM, surround modulation.
Figure 3
Figure 3
Laminar specificity of feedforward, horizontal, and feedback projections. The main V1 laminar terminations of geniculocortical (green arrows), intra-V1 horizontal (red arrows), and feedback (blue arrows) connections are shown on a pia-to-WM section of V1 stained for cytochrome oxidase. Solid arrows indicate denser projections and dashed arrows weaker projections. White dashed contours indicate laminar boundaries. Abbreviations: LGN, lateral geniculate nucleus; M, magnocellular LGN inputs; P, parvocellular LGN inputs; WM, white matter.
Figure 4
Figure 4
Onset latency of CSD signals evoked by stimulation of the RF, near surround, or far surround. Population averages of baseline-corrected (z-scored) CSD signals across V1 layers evoked by stimulation of (a) the aggregate RF, (b) the near-surround, and (c) the far-surround of neurons in the recorded center V1 column. Prior to averaging, CSD signals from each penetration were half-wave rectified to eliminate current sources, and then normalized. The solid black contour indicates the measured onset latency of current sinks, and the blue and red vertical lines mark the time of stimulus onset and 50 ms after stimulus onset, respectively. Horizontal lines mark the main cortical boundaries. Figure modified from M. Bijanzadeh, L. Nurminen, S. Merlin & A. Angelucci (submitted manuscript). Abbreviations: 4C, layer 4C; CSD, current source density; IG, infragranular layers; RF, receptive field; SG, supragranular layers.
Figure 5
Figure 5
Optogenetic inactivation of V2 feedback affects receptive field size, surround suppression, and response gain in V1 neurons. (a) Lateral view of the marmoset brain. Areas V1 and V2 inside the boxed region are shown enlarged in (b). (b) The inactivation paradigm. Area V2 was injected with adeno-associated-virus (AAV9) expressing the genes for the inhibitory opsin ArchT and green fluorescent protein (GFP). Laser photoactivation of ArchT-expressing V2 feedback terminals was directed to V1, while recording V1 neuron responses using linear electrode arrays at the photoactivated site. (c) Size-tuning curve of an example V1 cell recorded with intact (black) and reduced (green) V2 feedback activity. The gray shaded area highlights the response reduction to stimuli inside the RF. The green shaded area highlights the response increase (reduced suppression) in the proximal surround region. (d) Size-tuning curve of an example V1 cell measured with intact feedback (black) and with reduced feedback activity (green) using laser stimulation at two different intensities (dashed curve: higher laser intensity). Other conventions as in (c). Figure modified from Nurminen et al (2016).
Figure 6
Figure 6
A recurrent network model of SM in layer 2/3 of macaque V1. (a) The network architecture. A center hypercolumn consisting of 32 recurrently connected orientation columns, of which only 2 (preferring 0° and −22.5° orientation) are shown for simplicity. Each column consists of excitatory neurons (E) and two kinds of inhibitory neurons (I and B). The surround pathways (red) are orientation specific, whereas the local recurrent connections (blue) are broadly tuned. Feedforward projections (green) from layer 4C are also orientation specific and contact E and B, but not I, neurons. (b) Input/response function of E, B, and I neurons in the model. (c) The mechanism underlying orientation-tuned surround suppression. Diagrams show the inputs that most affect the E1 cell response for a center stimulus at the optimal orientation (0°) for cell E1 (left) and after addition of a surround stimulus at 0° orientation (right). Only the relevant cells and connections that most affect the E1 cell response in the model are depicted. Line thickness indicates input strength. Adding a 0° grating to the surround leads to increased inhibition of the E1 cell via the surround inputs, which in turn leads to less recurrent excitation within the hypercolumn, as E1 provides the strongest recurrent excitation within the hypercolumn when a center stimulus of 0° (its preferred orientation) is presented. (d) Inputs to the E1 cell preferring 0° orientation for varying surround orientations, when the RF is stimulated with a center grating at the optimal orientation for the recorded cell. Local recurrent inputs from E neurons in other orientation columns (solid blue curve), local recurrent inputs (negative) from B neurons in the same and other orientation columns (dashed blue curve), and input (negative) from the surround (red curve) are shown. Note that the surround input (red y-axis) is much smaller than the local recurrent inputs (blue y-axis). (e) Contrast-dependent spatial summation in the model. Size-tuning curves at high (85%; solid lines) and low (15%; dashed lines) contrast are shown. Icons at top indicate different components of the RF and surround activated (red shading) at the indicated point in the size-tuning curve. Panels (a–d) modified from Shushruth et al. (2012); panel (e) modified from Schwabe et al. (2006). Abbreviations: B, basket-like inhibitory cell; E, excitatory cell; FB. feedback; FF, feedforward; H, horizontal; I, local inhibitory cell; RF, receptive field; SM, surround modulation.

References

    1. Adesnik H, Bruns W, Taniguchi H, Huang ZJ, Scanziani M. A neural circuit for spatial summation in visual cortex. Nature. 2012;490:226–31. - PMC - PubMed
    1. Alitto HJ, Usrey WM. Origin and dynamics of extraclassical suppression in the lateral geniculate nucleus of the macaque monkey. Neuron. 2008;57:135–46. - PMC - PubMed
    1. Allman J, Miezin F, McGuinness E. Stimulus specific responses from beyond the classical receptive field: neurophysiological mechanisms for local–global comparisons in visual neurons. Annu Rev Neurosci. 1985;8:407–30. - PubMed
    1. Anderson JC, Martin KAC. The synaptic connections between cortical areas V1 and V2 in macaque monkey. J Neurosci. 2009;29:11283–93. - PMC - PubMed
    1. Angelucci A, Bressloff PC. The contribution of feedforward, lateral and feedback connections to the classical receptive field center and extra-classical receptive field surround of primate V1 neurons. Prog Brain Res. 2006;154:93–121. - PubMed

Publication types

LinkOut - more resources