. 2017 May 4;12(5):e0176679.
doi: 10.1371/journal.pone.0176679. eCollection 2017.

Aggressive rat prostate tumors reprogram the benign parts of the prostate and regional lymph nodes prior to metastasis

Affiliations

Aggressive rat prostate tumors reprogram the benign parts of the prostate and regional lymph nodes prior to metastasis

Kerstin Strömvall et al. PLoS One. .

Abstract

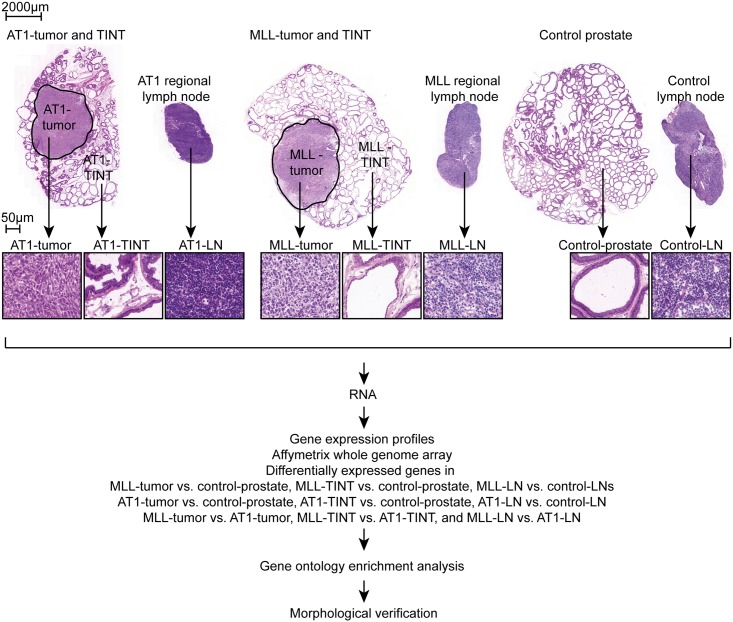
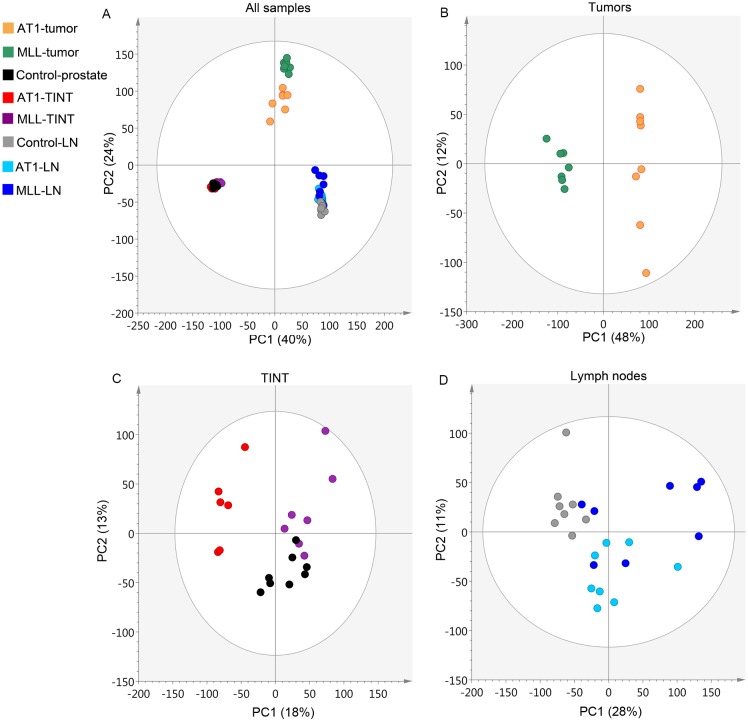
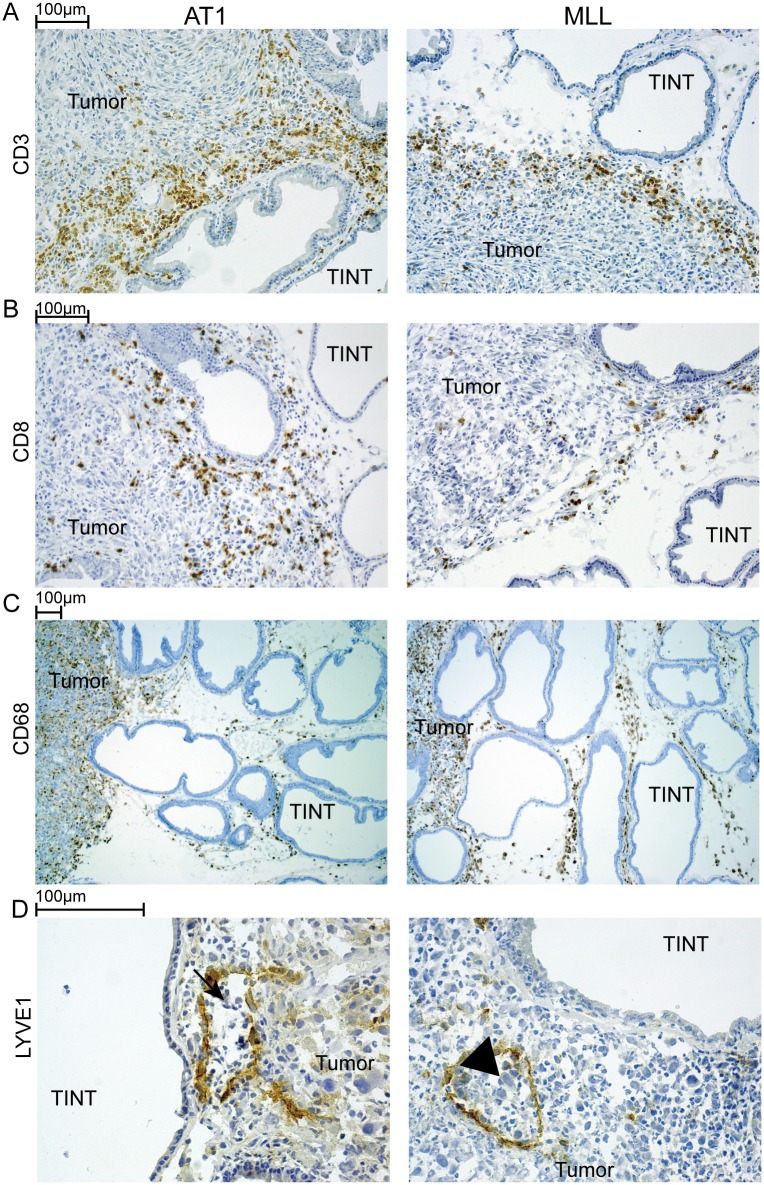
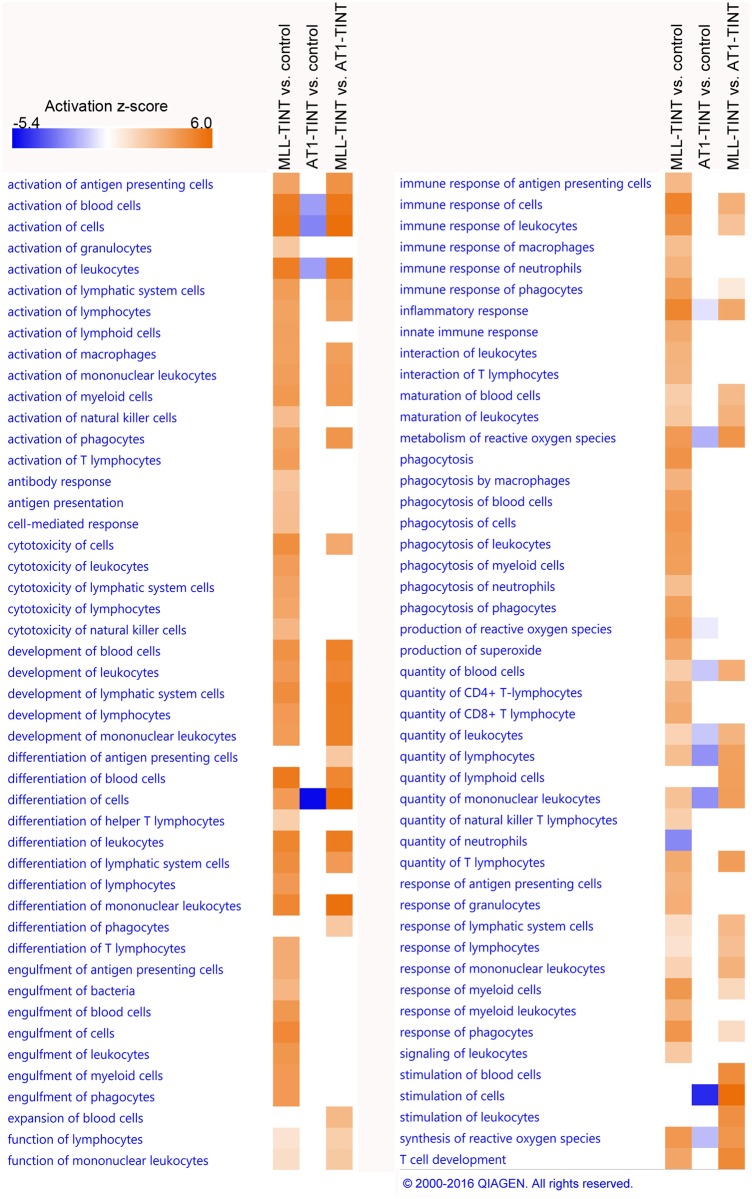
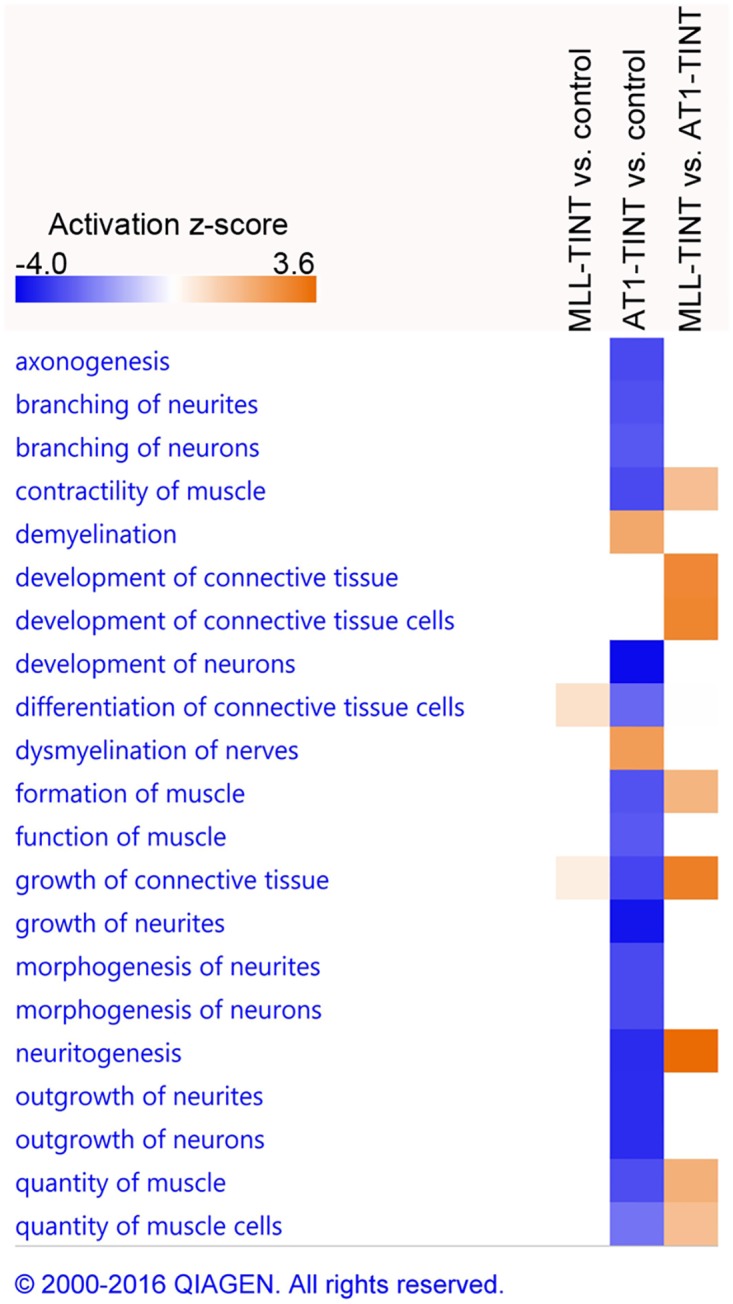
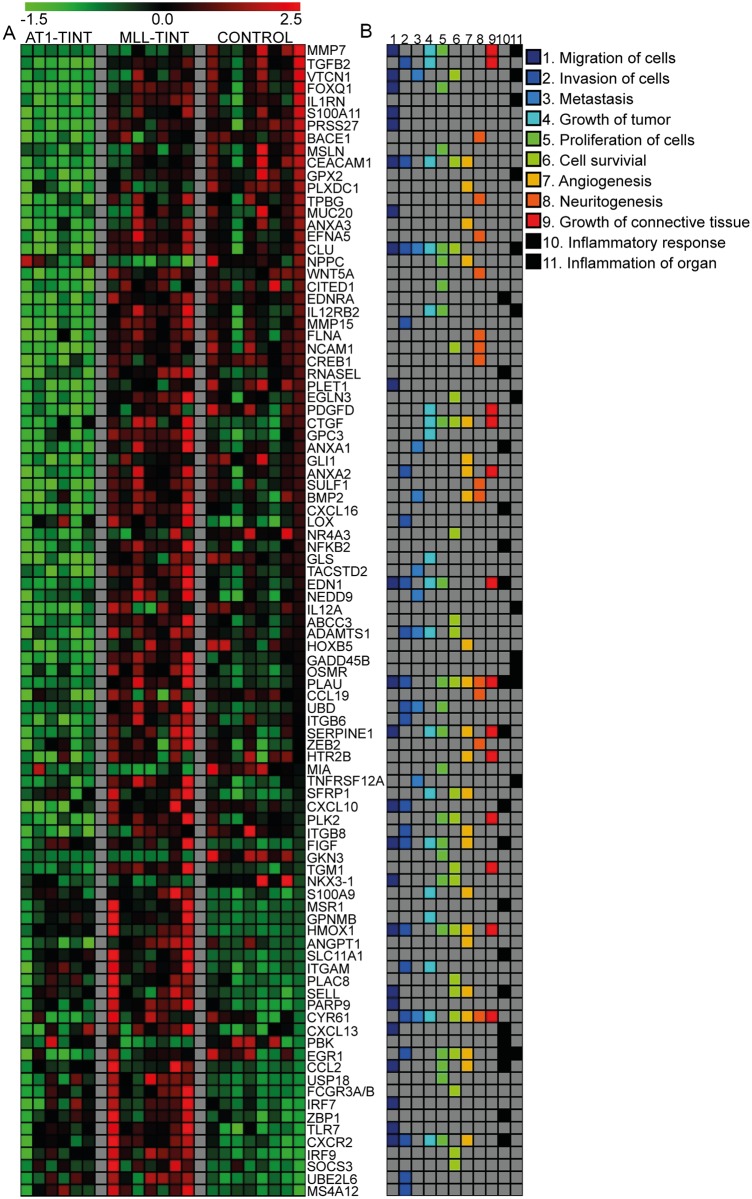
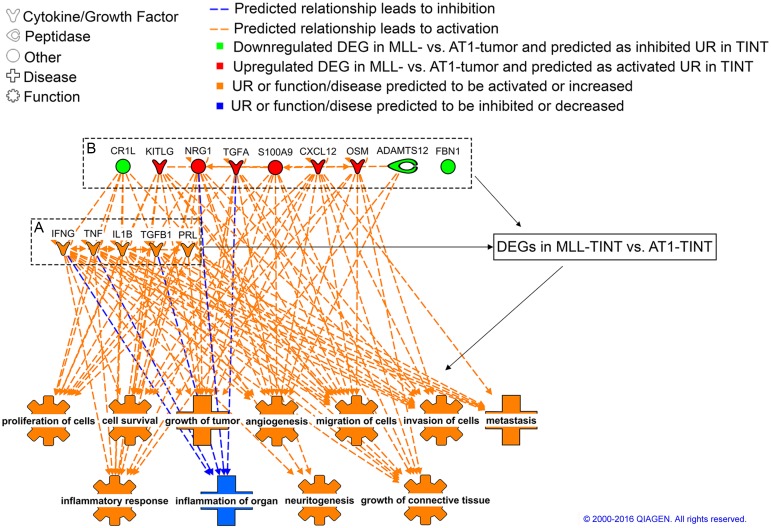
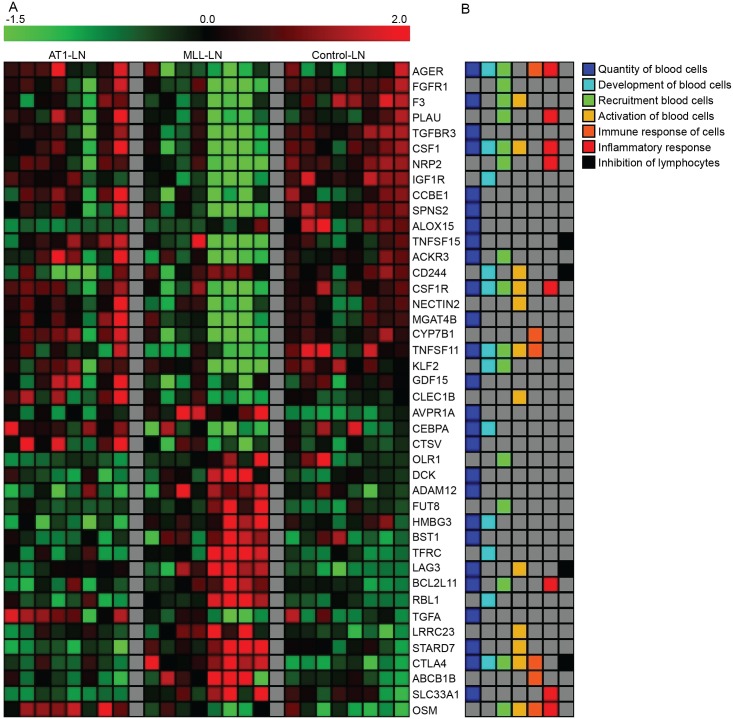
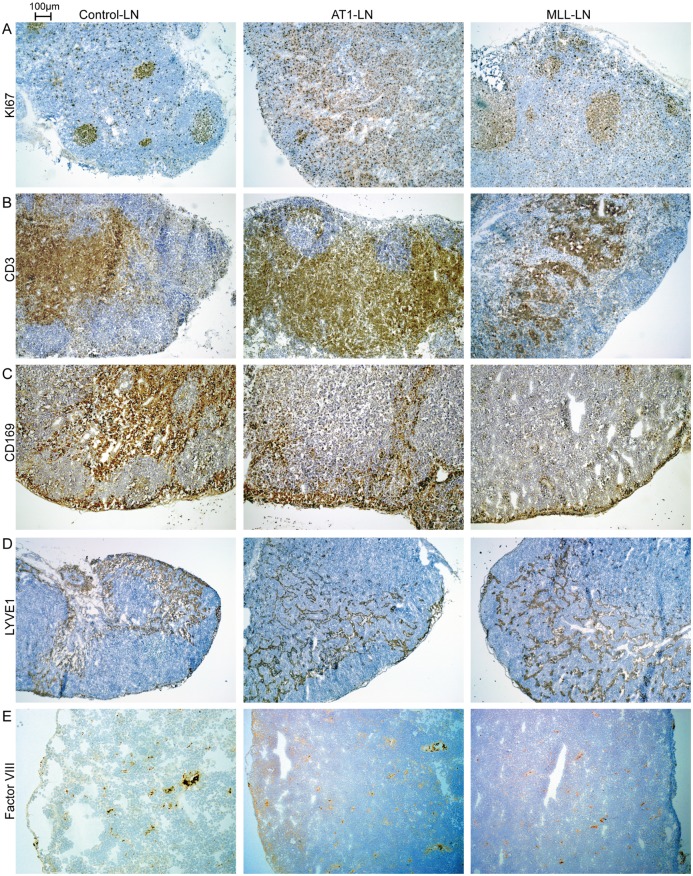
In order to grow and spread tumors need to interact with adjacent tissues. We therefore hypothesized that small but aggressive prostate cancers influence the rest of the prostate and regional lymph nodes differently than tumors that are more indolent. Poorly metastatic (Dunning AT1) or highly metastatic (Dunning MLL) rat prostate tumor cells were injected into the ventral prostate lobe of immunocompetent rats. After 10 days-when the tumors occupied about 30% of the prostate lobe and lymph node metastases were undetectable-the global gene expression in tumors, benign parts of the prostate, and regional iliac lymph nodes were examined to define tumor-induced changes related to preparation for future metastasis. The tumors induced profound effects on the gene expression profiles in the benign parts of the prostate and these were strikingly different in the two tumor models. Gene ontology enrichment analysis suggested that tumors with high metastatic capacity were more successful than less metastatic tumors in inducing tumor-promoting changes and suppressing anti-tumor immune responses in the entire prostate. Some of these differences such as altered angiogenesis, nerve density, accumulation of T-cells and macrophages were verified by immunohistochemistry. Gene expression alterations in the regional lymph nodes suggested decreased quantity and activation of immune cells in MLL-lymph nodes that were also verified by immunostaining. In summary, even when small highly metastatic prostate tumors can affect the entire tumor-bearing organ and pre-metastatic lymph nodes differently than less metastatic tumors. When the kinetics of these extratumoral influences (by us named TINT = tumor instructed normal tissue) are more precisely defined they could potentially be used as markers of disease aggressiveness and become therapeutic targets.


Conflict of interest statement

Competing Interests: The authors have declared that no competing interests exist.

Figures

Fig 1
Fig 1. Experimental design.
Eosin-hematoxylin stained frozen sections representative of tumors (AT1-tumor and MLL-tumor), prostate TINT (AT1-TINT and MLL-TINT), regional LNs (AT1-LN and MLL-LN), control prostate, and control LNs. The different groups were compared by analyzing global gene expression, gene ontology enrichment analysis, and morphology. TINT, Tumor Instructed Normal Tissue; LN, Lymph Node.
Fig 2
Fig 2. Principal component analysis.
Score plots showing the variability explained by the 1st and 2nd components of PCA-models constructed using gene expression signal intensity values in A) all samples, B) tumors, C) prostate TINT and control prostate, and D) regional LNs. MLL-tumor, n = 7; AT1-tumor, n = 8; MLL-TINT, n = 7; AT1-TINT, n = 6; MLL-LN, n = 8; AT1-LN, n = 8; control-prostate, n = 8; control-LN, n = 8. PCA, Principal component analysis; TINT, Tumor Instructed Normal Tissue; LN, Lymph Node.
Fig 3
Fig 3. Immunostained tissue sections from AT1- and MLL- tumors.
A) CD3+ T-lymphocytes (brown) and B) CD8+ cells (brown) were more common in the peripheral parts of AT1- than MLL-tumors. In contrast C) CD68+ macrophages (brown) were more common in the peripheral parts of MLL-tumors and in MLL-TINT than in the AT1-model. D) Large tumor cells (arrowhead) were seen inside lymph vessels (LYVE1+, brown) in the peripheral parts of MLL-tumors. Lymph vessels in AT1-tumors seldom contained tumor cells but more commonly small lymphocyte-like cells (arrow). TINT, Tumor Instructed Normal Tissue.
Fig 4
Fig 4. GO enrichment analysis of prostate TINT—Immune-related disease and function annotations.
IPA core analyses were performed for each comparison (MLL vs. control, AT1 vs. control, and MLL vs. AT1). DEGs with FC ≥ 1.25 and p ≤ 0.05 were included in the analyses. Significant (p ≤ 0.05, z-score > 2 (absolute value)) immune-related function annotations are shown. The heatmap illustrates the predicted activation z-scores, blue = negative score, decreased activity, and orange = positive score, increased activity. MLL, n = 7; AT1, n = 6; control, n = 8. GO, Gene Ontology; TINT, Tumor Instructed Normal Tissue; IPA, Ingenuity Pathway Analysis; DEG, Differentially Expressed Gene; FC, Fold Change. Reprinted from IPA under a CC BY license, with permission from Qiagen, original copyright 2016.
Fig 5
Fig 5. GO enrichment analysis of prostate TINT—Stroma-related disease and function annotations.
IPA core analyses were performed for each comparison (MLL vs. control, AT1 vs. control, and MLL vs. AT1). DEGs with FC ≥ 1.25 and p ≤ 0.05 were included in the analyses. Significant (p ≤ 0.05, z-score > 2 (absolute value)) stroma-related function annotations are shown. The heatmap illustrates the predicted activation z-scores, blue = negative score, decreased activity, and orange = positive score, increased activity. MLL, n = 7; AT1, n = 6; control, n = 8. GO, Gene Ontology; TINT, Tumor Instructed Normal Tissue; IPA, Ingenuity Pathway Analysis; DEG, Differentially Expressed Gene; FC, Fold Change. Reprinted from IPA under a CC BY license, with permission from Qiagen, original copyright 2016.
Fig 6
Fig 6. TINT gene expression heatmap.
A) Expression of DEGs associated with affected biological functions in TINT, as predicted by the IPA algorithm (Table 1). The top 10 DEGs (highest FC) in support of the prediction made by IPA are included. Top genes present in more than one analysis are presented once. Gene expression signal intensity z-score is showed for each sample, black = mean signal intensity, red = number of standard deviations above the mean, green = number of standard deviations below the mean. B) The multicolored panel shows gene-function associations. MLL, n = 7; AT1, n = 6; control, n = 8. TINT, Tumor Instructed Normal Tissue; DEG, Differentially Expressed Gene; FC, Fold Change; IPA, Ingenuity Pathway Analysis.
Fig 7
Fig 7. GO enrichment analysis of prostate TINT—Upstream regulators.
IPA core analysis of MLL- vs. AT1-TINT DEGs (FC ≥ 1.25 and p ≤ 0.05) was performed. The figure shows predicted upstream regulators. A) the five most significant (according to p-value) upstream regulators overall and B) upstream regulators that could possibly be secreted from the tumors. All upstream regulators are associated with the predicted downstream effects via relations to target genes in TINT (black arrows), but some are also directly associated. UR, Upstream Regulator; GO, Gene Ontology; TINT, Tumor Instructed Normal Tissue; IPA, Ingenuity Pathway Analysis; DEG, Differentially expressed gene; FC, Fold Change. Reprinted from IPA under a CC BY license, with permission from Qiagen, original copyright 2016.
Fig 8
Fig 8. Immunostained tissue sections from control prostate, AT1-, and MLL-TINT.
The densities of A) blood vessels (Factor VIII+, brown) and B) lymph vessels (LYVE1+, brown) and were higher in MLL-TINT than in AT1-TINT. C) Neurons (NFL+, brown) could be detected in the periglandular smooth muscle cell layer (arrows). Quantification showed that the density of NFL+ neurons was particularly decreased in AT1-TINT compared to the controls.
Fig 9
Fig 9. LN gene expression heatmap.
A) Expression of DEGs associated with immune-related functions in LNs, as predicted by the IPA algorithm. All MLL- vs. AT1-LN DEGs in support of the prediction made by IPA are included. Gene expression signal intensity z-score is showed for each sample, black = mean signal intensity, red = number of standard deviations above the mean, green = number of standard deviations below the mean. B) The multicolored panel shows gene-function associations. MLL, n = 8; AT1, n = 8; control, n = 8. LN, Lymph Node; DEG, Differentially Expressed Gene; IPA, Ingenuity Pathway Analysis.
Fig 10
Fig 10. Immunostained tissue sections from control-, AT1-, and MLL-LNs.
A) Proliferating cells (Ki67+, brown) were seen in lymph follicles (presumably B-lymphocytes) and in para-follicular areas (presumably T-lymphocytes) in control-LNs. In AT1-LNs, the para-follicular areas dominated, and contained most of the proliferating cells. In MLL-LNs, the para-follicular regions appeared to contain less proliferating cells than in AT1-LNs. B) CD3+ T-lymphocytes (brown) appeared more common in AT1-LNs compared to MLL-LNs, C) also sinus macrophages (CD169+, brown) appeared decreased in MLL-LNs. D) The density of LYVE1+ (brown) lymph vessels appeared similar in AT1- and MLL-LN. E) The density of Factor VIII+ (brown) blood vessels appeared reduced in MLL-LN.

References

    1. McAllister SS, Weinberg RA. Tumor-host interactions: a far-reaching relationship. J Clin Oncol. 2010;28(26):4022–8. 10.1200/JCO.2010.28.4257 - DOI - PubMed
    1. McAllister SS, Weinberg RA. The tumour-induced systemic environment as a critical regulator of cancer progression and metastasis. Nat Cell Biol. 2014;16(8):717–27. 10.1038/ncb3015 - DOI - PMC - PubMed
    1. Quail DF, Joyce JA. Microenvironmental regulation of tumor progression and metastasis. Nat Med. 2013;19(11):1423–37. 10.1038/nm.3394 - DOI - PMC - PubMed
    1. Barron DA, Rowley DR. The reactive stroma microenvironment and prostate cancer progression. Endocr Relat Cancer. 2012;19(6):R187–204. 10.1530/ERC-12-0085 - DOI - PMC - PubMed
    1. Hagglof C, Bergh A. The stroma-a key regulator in prostate function and malignancy. Cancers (Basel). 2012;4(2):531–48. - PMC - PubMed