

Pharmacodynamics of Isavuconazole for Invasive Mold Disease: Role of Galactomannan for Real-Time Monitoring of Therapeutic Response
- PMID: 28472247
- PMCID: PMC5434340
- DOI: 10.1093/cid/cix198
Pharmacodynamics of Isavuconazole for Invasive Mold Disease: Role of Galactomannan for Real-Time Monitoring of Therapeutic Response
Erratum in
-
Erratum.Clin Infect Dis. 2017 Oct 15;65(8):1431-1433. doi: 10.1093/cid/cix563. Clin Infect Dis. 2017. PMID: 29017252 Free PMC article. No abstract available.
Abstract
Background.: The ability to make early therapeutic decisions when treating invasive aspergillosis using changes in biomarkers as a surrogate for therapeutic response could significantly improve patient outcome.
Methods.: Cox proportional hazards model and logistic regression were used to correlate early changes in galactomannan index (GMI) to mortality and overall response, respectively, from patients with positive baseline GMI (≥0.5) and serial GMI during treatment from a phase 3 clinical trial for the treatment of invasive mold disease. Pharmacokinetic/pharmacodynamic (PK/PD) analysis in patients with isavuconazole plasma concentrations was conducted to establish the exposure necessary for GMI negativity at the end of therapy.
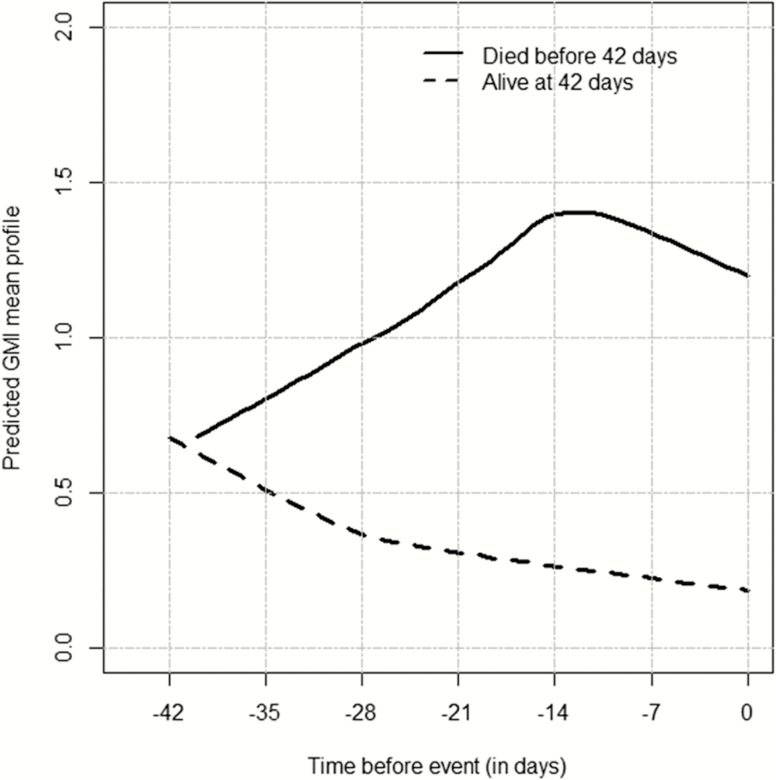
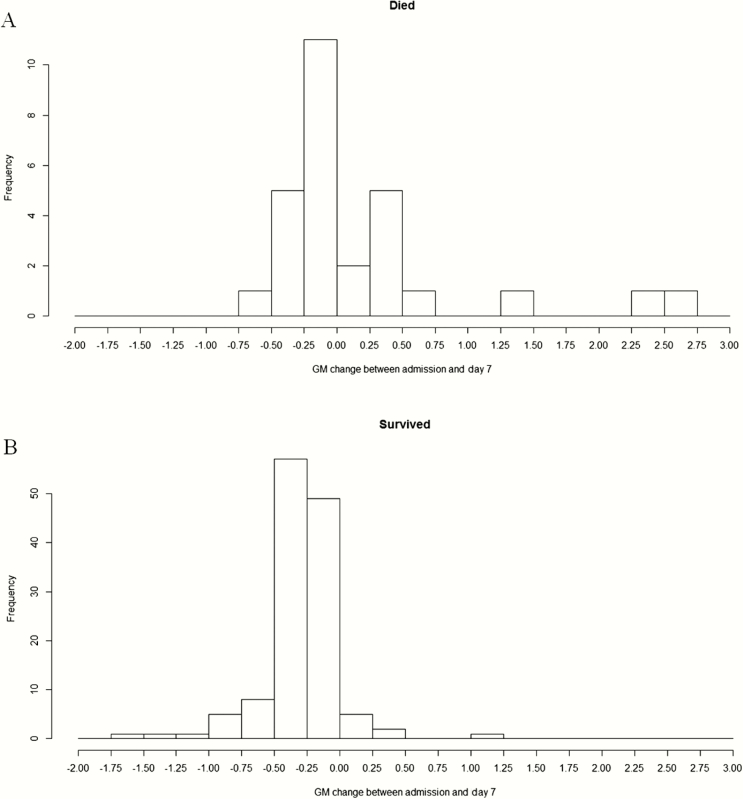
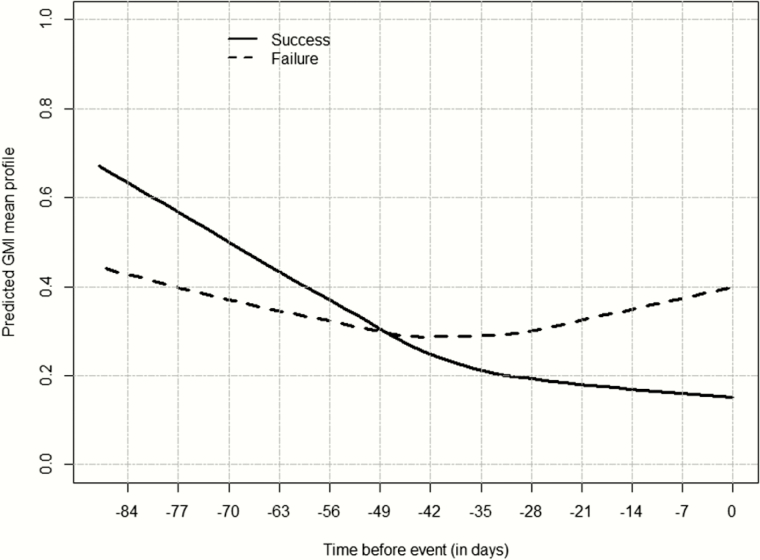
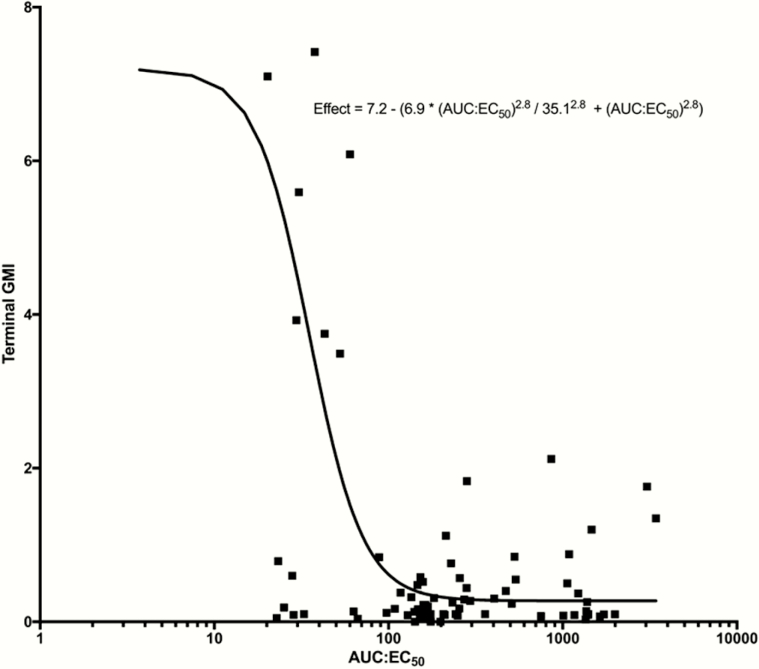
Results.: The study included 158 patients overall and 78 isavuconazole patients in the PK/PD modeling. By day 7, GMI increases of >0.25 units from baseline (3/130 survivors; 9/28 who died) significantly increased the risk of death compared to those with no increase or increases <0.25 (hazard ratio, 9.766; 95% confidence interval [CI], 4.356-21.9; P < .0001). For each unit decrease by day 7 from baseline, the odds of successful therapy doubled (odds ratio, 2.154; 95% CI, 1.173-3.955). An area under the concentration-versus-time curve over half-maximal effective concentration (AUC:EC50) of 108.6 is estimated to result in a negative GMI at the end of isavuconazole therapy.
Conclusions.: Early trends in GMI are highly predictive of patient outcome. GMI increases by day 7 could be considered in context of clinical signs to trigger changes in treatment, once validated. Our data suggest that this improves survival by 10-fold and positive outcome by 3-fold. These data have important implications for individualized therapy for patients and clinical trials.
Clinical trials registration.: NCT00412893.
Keywords: aspergillosis; biomarker; galactomannan; isavuconazole; isavuconazonium sulfate..
© The Author 2017. Published by Oxford University Press for the Infectious Diseases Society of America.
Figures
References
-
- Schmiedel Y, Zimmerli S. Common invasive fungal diseases: an overview of invasive candidiasis, aspergillosis, cryptococcosis, and Pneumocystis pneumonia. Swiss Med Wkly 2016; 146:w14281. - PubMed
-
- Leroux S, Ullmann AJ. Management and diagnostic guidelines for fungal diseases in infectious diseases and clinical microbiology: critical appraisal. Clin Microbiol Infect 2013; 19:1115–21. - PubMed
-
- Lanternier F, Lortholary O. Liposomal amphotericin B: what is its role in 2008? Clin Microbiol Infect 2008; 14(suppl 4):71–83. - PubMed
-
- Enoch DA, Idris SF, Aliyu SH, Micallef C, Sule O, Karas JA. Micafungin for the treatment of invasive aspergillosis. J Infect 2014; 68:507–26. - PubMed
Publication types
MeSH terms
Substances
Associated data
Grants and funding
LinkOut - more resources
Full Text Sources
Other Literature Sources
Medical
