. 2017 May 17;68(11):2717-2729.
doi: 10.1093/jxb/erx147.

Differential expression of a WRKY gene between wild and cultivated soybeans correlates to seed size

Affiliations

Differential expression of a WRKY gene between wild and cultivated soybeans correlates to seed size

Yongzhe Gu et al. J Exp Bot. .

Abstract

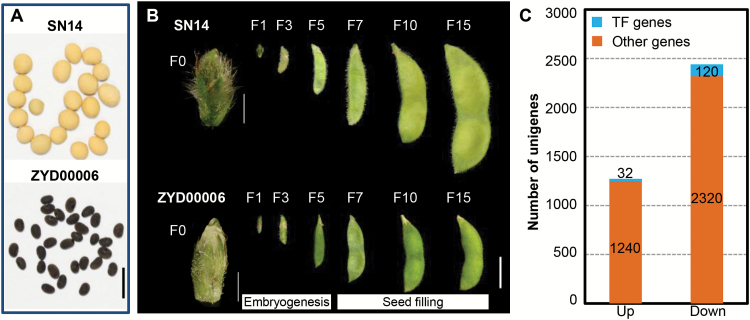
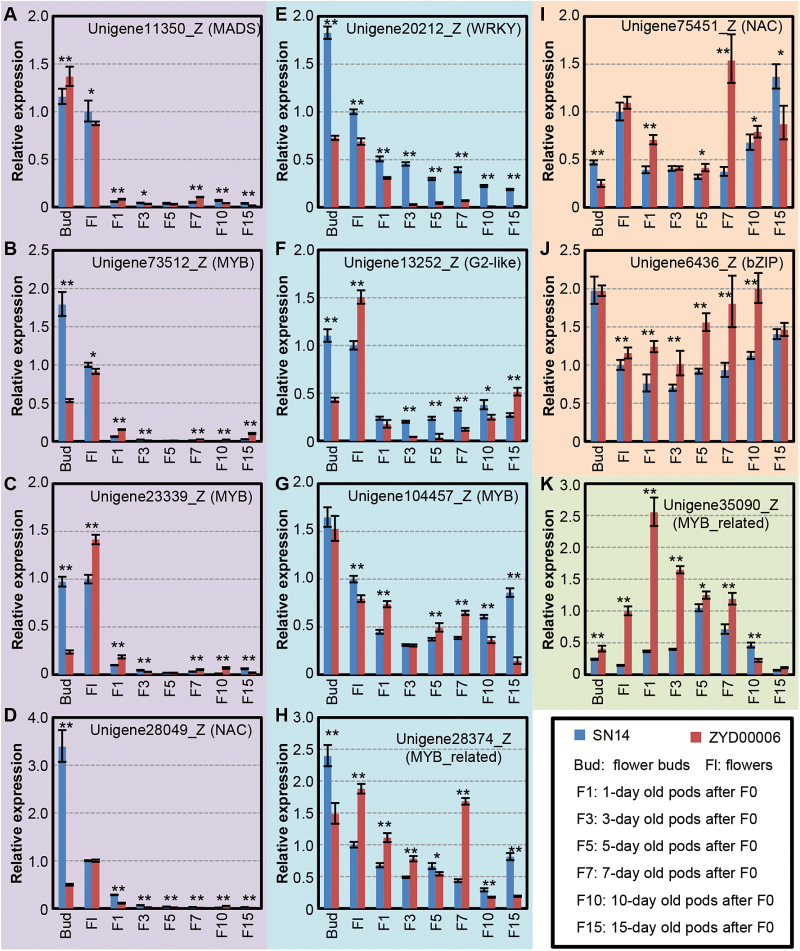
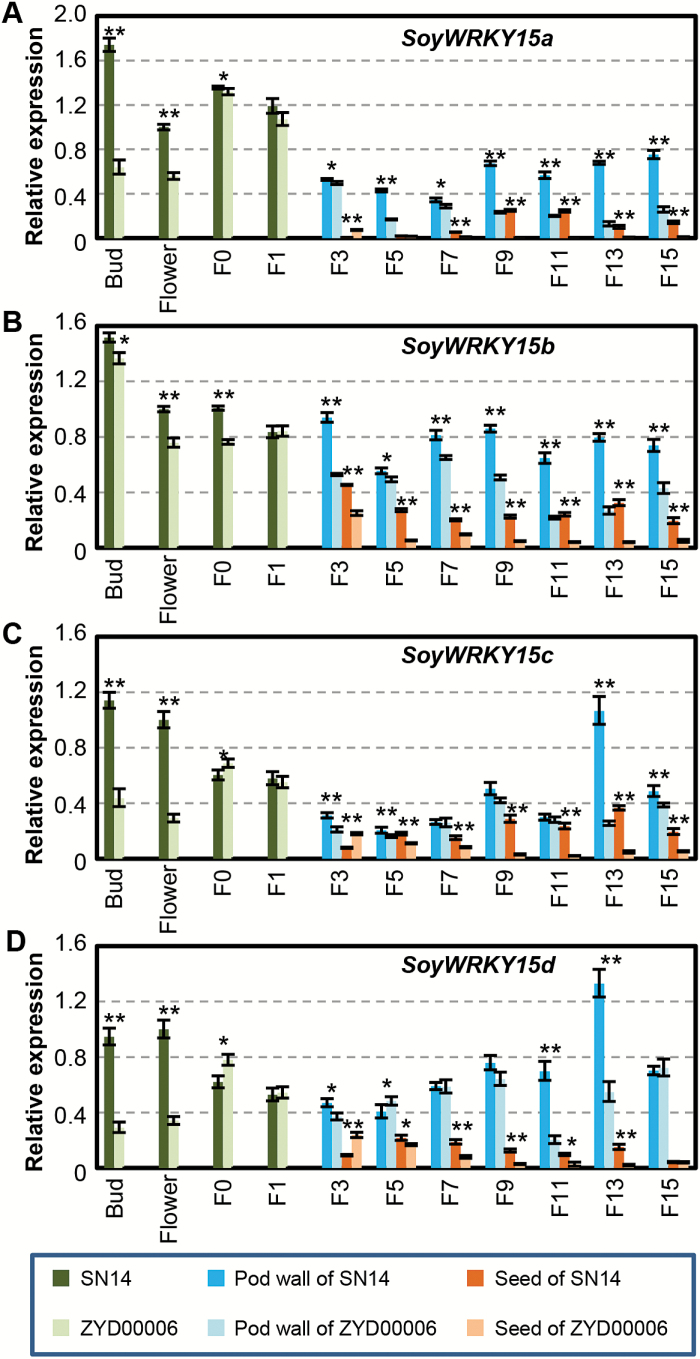
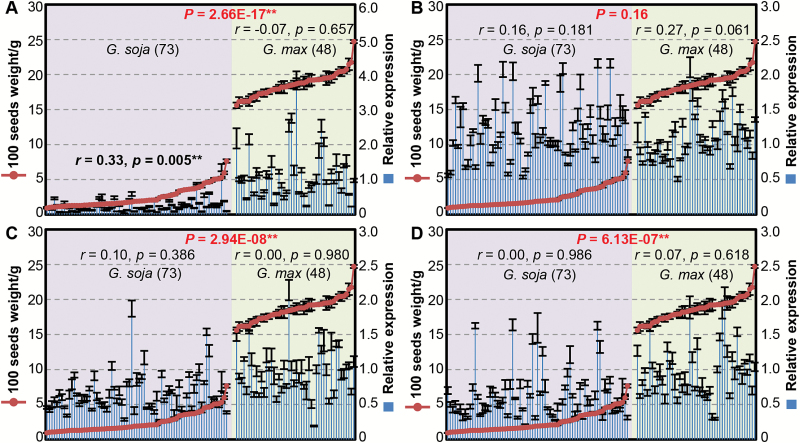
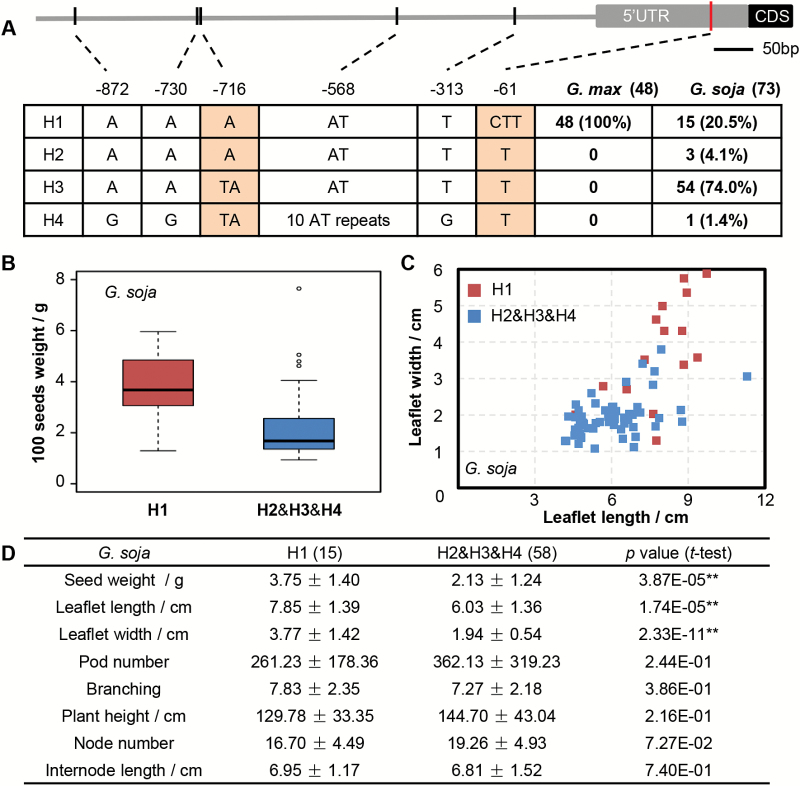
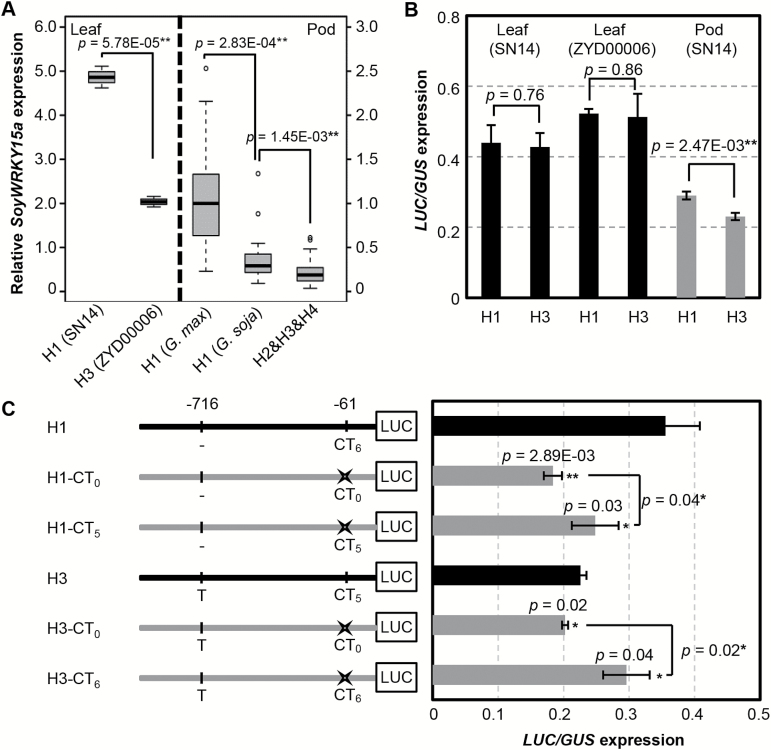
Soybean (Glycine max) probably originated from the wild soybean (Glycine soja). Glycine max has a significantly larger seed size, but the underlying genomic changes are largely unknown. Candidate regulatory genes were preliminarily proposed by data co-localizing RNA sequencing with the quantitative loci (QTLs) for seed size. The soybean gene locus SoyWRKY15a and its orthologous genes from G. max (GmWRKY15a) and G. soja (GsWRKY15a) were analyzed in detail. The coding sequences were nearly identical between the two orthologs, but GmWRKY15a was significantly more highly expressed than GsWRKY15a. Four haplotypes (H1-H4) were found and they varied in the size of a CT-core microsatellite locus in the 5'-untranslated region of this gene. H1 (with six CT-repeats) was the only allelic version found in G. max, while H3 (with five CT-repeats) was the dominant G. soja allele. Differential expression of this gene in soybean pods was correlated with CT-repeat variation, and manipulation of the CT copy number altered the reporter gene expression, suggesting a regulatory role for the simple sequence repeats. Seed weight of wild soybeans harboring H1 was significantly greater than that of soybeans having haplotypes H2, H3, or H4, and seed weight was correlated with gene expression, suggesting the influence of GsWRKY15a in controlling seed size. However, the seed size might be refractory to increased SoyWRKY15a expression in cultivated soybeans. The evolutionary significance of SoyWRKY15a variation in soybean seed domestication is discussed.

Keywords: CT-rich regulatory motif; WRKY gene; domestication; expression variation; seed size; soybean.


Figures

Fig. 1.
Fig. 1.
Morphology and development of soybean fruit and differentially expressed unigenes (DEGs) between SN14 and ZYD00006. (A) Mature seeds of SN14 and ZYD00006. Scale bar=1 cm. (B) Definition of pod development in SN14 and ZYD00006. F0 stage, onset of pod presence from the closed corolla; F1–F15, developing fruits 1–15 d after F0. Scale bars at the F0 stage are 1 mm and the scale bar for other developmental stages is 1 cm. According to a previous report (Le et al., 2007), differentiation of embryo axis and cotyledons during embryogenesis occurs before the F3 stage, and predominance in cell expansion activity during seed filling starts after F5. (C) The number of DEGs during flower and pod development between SN14 and ZYD00006. The numbers in the column indicate the number of DEGs. TF, transcription factor. Up represents that gene expression in SN14 is higher than that of ZYD00006; otherwise it is indicated as Down.
Fig. 2.
Fig. 2.
Expression of the candidate regulatory genes during pod development. (A) Unigene11350_Z. (B) Unigene73512_Z. (C) Unigene23339_Z. (D) Unigene28049_Z. (E) Unigene20212_Z. (F) Unigene13252_Z. (G) Unigene104457_Z. (H) Unigene28374_Z. (I) Unigene75451_Z. (J) Unigene6436_Z. (K) Unigene35090_Z. The transcription factor (TF) families are given in parentheses after the Unigenes. The unfertilized flower buds and different developing pod stages as indicated were harvested from G. max (SN14) and G. soja (ZYD00006). Actin (Glyma18g52780) is used as the internal control in qRT–PCR. The average relative expression and the SD are presented (n=3). Unigenes with a similar expression pattern are in the same background color. The blue column represents gene expression in SN14, while the red column indicates gene expression in ZYD00006. Asterisks indicate significance using Student’s t-test (*P<0.05; **P<0.01) when gene expression in SN14 was compared with that in ZYD00006.
Fig. 3.
Fig. 3.
Expression of SoyWRKY15 genes during fruit development. (A) SoyWRKY15a. (B) SoyWRKY15b. (C) SoyWRKY15c. (D) SoyWRKY15d. The tissues are unfertilized flower buds, flowers, and developing pods as indicated. The pods were divided into pod walls and seeds after the F3 stage. Actin (Glyma18g52780) is used as the internal control in qRT–PCR. The average relative expression and the SD are presented (n=3). The column legends of each graph are the same and are given underneath. Asterisks indicate significance using Student’s t-test (*P<0.05; **P<0.01) when gene expression in SN14 was compared with that in ZYD00006.
Fig. 4.
Fig. 4.
Correlation between SoyWRKY15 gene expression and seed size. (A) SoyWRKY15a. (B) SoyWRKY15b. (C) SoyWRKY15c. (D) SoyWRKY15d. The expression level of each gene at the F7 stage was detected in 73 accessions of G. soja (pink background) and 48 accessions of G. max (green background). The mean relative expression and the SD are presented (n=3). The Pearson correlation coefficient of gene expression and 100-seed size (r) and P-value are given in each background. The P-value in red indicates the significance of the differential gene expression between wild and cultivated soybeans. All related information is presented in Supplementary Table S1.
Fig. 5.
Fig. 5.
Association of the CT-motif variation in SoyWRKY15a and agronomic traits. (A) Nucleotide polymorphisms in the promoter and 5'UTR of the SoyWRKY15a gene. Black and gray boxes represent coding sequence and the UTR, respectively, and the horizontal gray line indicates the promoter region. The sites of variations are shown by vertical lines, and the deletion at –61 in UTRs is highlighted by a red vertical line. Four haplotypes (H1–H4) of the SoyWRKY15a gene were determined based on the polymorphisms detected in the investigated region. The polymorphisms that are different among H1 and H3 are shown on an orange background. The number and proportion of each haplotype in 48 cultivated and 73 wild accessions are given. (B–D) The effect of the defined GsWRKY15a haplotypes on seed weight (B), leaf size (C) and other agronomic traits (D) in wild soybean. The wild haplotypes (H2, H3, and H4) were considered together and compared with the domesticated H1. Mean ±SD is presented in (D). Significant differences (P-value) in the comparisons were detected using the two-tailed t-test.
Fig. 6.
Fig. 6.
The CT-motif variation in SoyWRKY15a affects gene expression. (A) Expression of SoyWRKY15a with different types of CT-motif variation in leaves and F7 pods. The black dashed vertical line separates the leaves and pods as indicated. Left: the gene expression in leaves. H1 and H3 are from SN14 and ZYD00006, respectively. Right: the gene expression variation in pods. The wild haplotypes (H2, H3, and H4) were considered together and compared with the domesticated H1 in both wild and cultivated soybean. (B) Expression of the LUC gene driven by H1 from SN14 and H3 from ZYD00006. The black column indicates gene expression in leaves, and the gray column represents the gene expression in pods. (C) Diagrams of the reporter constructs and transient expression analysis. The mutated constructs harboring mutations in the CT-motif (in gray) in comparison with H1 and H3 of SoyWRKY15a (in black). CT0, CT5, and CT6 behind H1 and H3 indicate the number of CT-repeats, and CT0 is a result of complete deletion of the CT-motif. Relative expression of the LUC gene driven by these constructs is shown in the corresponding columns (n ≥3). The P-values of the two-tailed t-test are given in (A–C). In particular, the P-values in (C) were evaluated via comparison with each control (black column).

References

    1. Alexandrova KS, Conger BV. 2002. Isolation of two somatic embryogenesis-related genes from orchardgrass (Dactylis glomerata). Plant Science 162, 301–307.
    1. Audic S, Claverie JM. 1997. The significance of digital gene expression profiles. Genome Research 7, 986–995. - PubMed
    1. Benjamini Y, Yekutieli D. 2001. The control of the false discovery rate in multiple testing under dependency. Annals of Statistics 29, 1165–1188.
    1. Bradbury PJ, Zhang Z, Kroon DE, Casstevens TM, Ramdoss Y, Buckler ES. 2007. TASSEL: software for association mapping of complex traits in diverse samples. Bioinformatics 23, 2633–2635. - PubMed
    1. Carroll SB. 2008. Evo-devo and an expanding evolutionary synthesis: a genetic theory of morphological evolution. Cell 134, 25–36. - PubMed

Publication types