. 2017 Jul 3;45(W1):W388-W392.
doi: 10.1093/nar/gkx352.

Amino Acid Interaction (INTAA) web server

Affiliations

Amino Acid Interaction (INTAA) web server

Jakub Galgonek et al. Nucleic Acids Res. .

Abstract

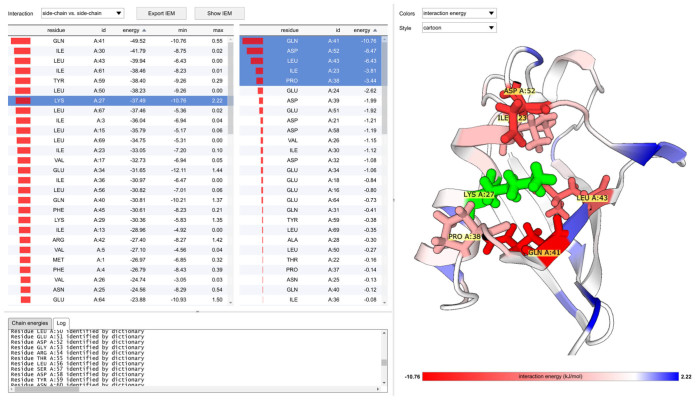
Large biomolecules-proteins and nucleic acids-are composed of building blocks which define their identity, properties and binding capabilities. In order to shed light on the energetic side of interactions of amino acids between themselves and with deoxyribonucleotides, we present the Amino Acid Interaction web server (http://bioinfo.uochb.cas.cz/INTAA/). INTAA offers the calculation of the residue Interaction Energy Matrix for any protein structure (deposited in Protein Data Bank or submitted by the user) and a comprehensive analysis of the interfaces in protein-DNA complexes. The Interaction Energy Matrix web application aims to identify key residues within protein structures which contribute significantly to the stability of the protein. The application provides an interactive user interface enhanced by 3D structure viewer for efficient visualization of pairwise and net interaction energies of individual amino acids, side chains and backbones. The protein-DNA interaction analysis part of the web server allows the user to view the relative abundance of various configurations of amino acid-deoxyribonucleotide pairs found at the protein-DNA interface and the interaction energies corresponding to these configurations calculated using a molecular mechanical force field. The effects of the sugar-phosphate moiety and of the dielectric properties of the solvent on the interaction energies can be studied for the various configurations.


Figures

Figure 1.
Figure 1.
The user interface of the Interaction Energy Matrix Application. The UI provides two interactive tables and an interactive structure viewer. This screenshot captures an analysis of the stabilization role of LYS27 (in 1UBQ). This particular amino-acid residue provides one of the top net interaction energies as found on the left panel, where all net interactions are listed and optionally sorted. The right panel shows the decomposition of the net energy for the selected amino acid. Sorting by energy reveals the strongest interaction partners. The rightmost structure viewer reacts instantly on the actual selection in both panels. In the ‘interaction energy’ mode, the reference residue is coloured green and the others by corresponding interaction energies (the stabilizing interactions in red, the destabilizing and the repulsions in blue). The selected residues with the most stabilizing interactions (ILE23, PRO38, GLN41, LEU43 and ASP52) are additionally highlighted using full-atom representation.
Figure 2.
Figure 2.
In the menu on the right, the user can select the parameters of the distribution, with details available in the ‘Help’ section. In the example provided, the distribution of asparagine side chains around the adenine base was chosen. Only the DNA base atoms were considered in the IE calculation, which was performed in vacuo (relative permittivity = 1). The only amino acid side chains considered in the IE calculations were those that directly contact the DNA base moiety. The protein chains from which these amino acids were extracted from a set in which the sequence identity of any pair of chains is lower than 90%. After you click ‘Submit’, a histogram of the IEs of the amino acid–DNA residue pairs from the selected distribution (the IE profile) is drawn on the left side of the screen. The numbers along the x-axis show the average IE of the contacts represented by that column. The height of each column represents the number of contacts falling into the IE range of that column. If at least one amino acid side-chain cluster exists in the distribution with the chosen parameters, a part of one or more columns is coloured blue. This corresponds to the contacts from that cluster having IEs within the range represented by that column. If some cluster is available and selected from the menu on the top left of the screen, the WebGL visualization tool displays the set of amino acid–DNA residue pairs from that cluster using the parameters chosen from the menu on the right side of the screen. The number (1–6) associated with each cluster in the menu indicates the rank of each cluster if one was to sort them from the one containing the most (cluster 1) to the one containing the fewest (cluster 6) amino acid–deoxyribonucleotide pairs in the original data set. It is possible that fewer than six clusters are listed, particularly when more restrictive sequence redundancy criteria are selected. The pair containing the cluster representative is drawn using green sticks and its 3D coordinates can be downloaded in PDB format by clicking the ‘Download representative’ button. Clicking the ‘Download cluster’ makes it possible to download the 3D coordinates of all members of the selected cluster. Clicking the ‘Download all’ button (available even when no cluster is selected) makes it possible to obtain the 3D coordinates of all amino acid–DNA residue pairs in the distribution.

References

    1. Bendova-Biedermannova L., Hobza P., Vondrasek J.. Identifying stabilizing key residues in proteins using interresidue interaction energy matrix. Proteins. 2008; 72:402–413. - PubMed
    1. Vondrasek J., Bendova L., Klusak V., Hobza P.. Unexpectedly strong energy stabilization inside the hydrophobic core of small protein rubredoxin mediated by aromatic residues: correlated ab initio quantum chemical calculations. J. Am. Chem. Soc. 2005; 127:2615–2619. - PubMed
    1. Kaminski G.A., Friesner R.A., Tirado-Rives J., Jorgensen W.L.. Evaluation and reparametrization of the OPLS-AA force field for proteins via comparison with accurate quantum chemical calculations on peptides. J. Phys. Chem. B. 2001; 105:6474–6487.
    1. Duan Y., Wu C., Chowdhury S., Lee M.C., Xiong G., Zhang W., Yang R., Cieplak P., Luo R., Lee T. et al. . A point-charge force field for molecular mechanics simulations of proteins based on condensed-phase quantum mechanical calculations. J. Comput. Chem. 2003; 24:1999–2012. - PubMed
    1. Berka K., Laskowski R.A., Hobza P., Vondrasek J.. Energy matrix of structurally important side-chain/side-chain interactions in proteins. J. Chem. Theory Comput. 2010; 6:2191–2203. - PubMed

Publication types