. 2017 May 3;94(3):595-610.e6.
doi: 10.1016/j.neuron.2017.04.004.

Releasing Syntaphilin Removes Stressed Mitochondria from Axons Independent of Mitophagy under Pathophysiological Conditions

Affiliations

Releasing Syntaphilin Removes Stressed Mitochondria from Axons Independent of Mitophagy under Pathophysiological Conditions

Mei-Yao Lin et al. Neuron. .

Abstract

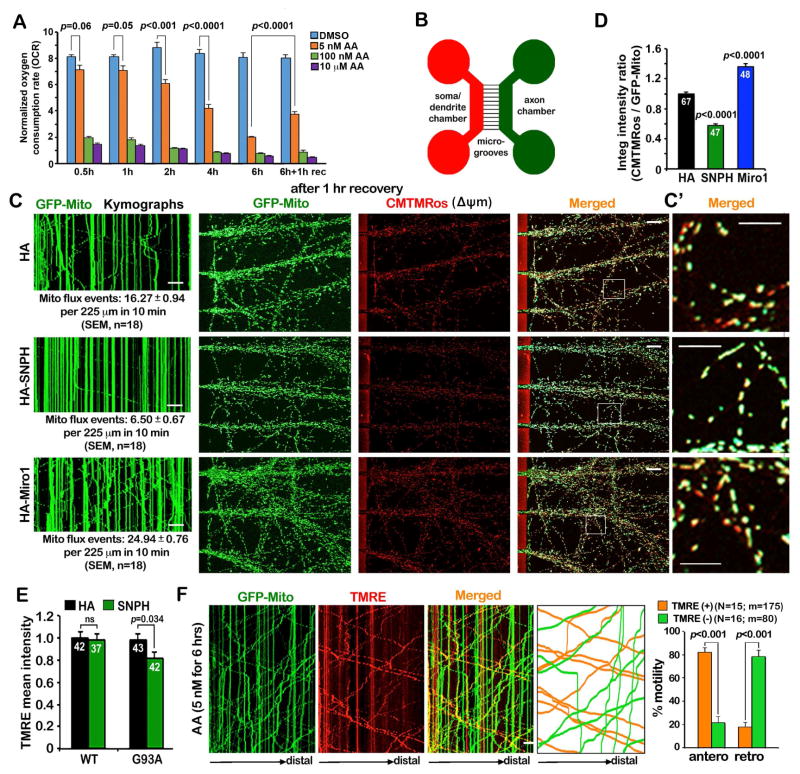
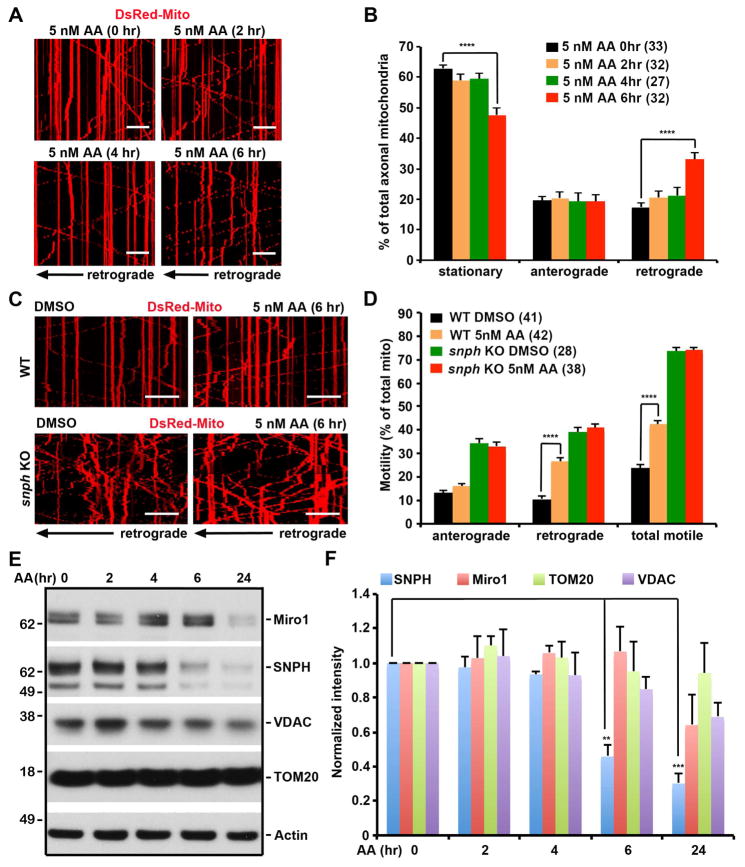
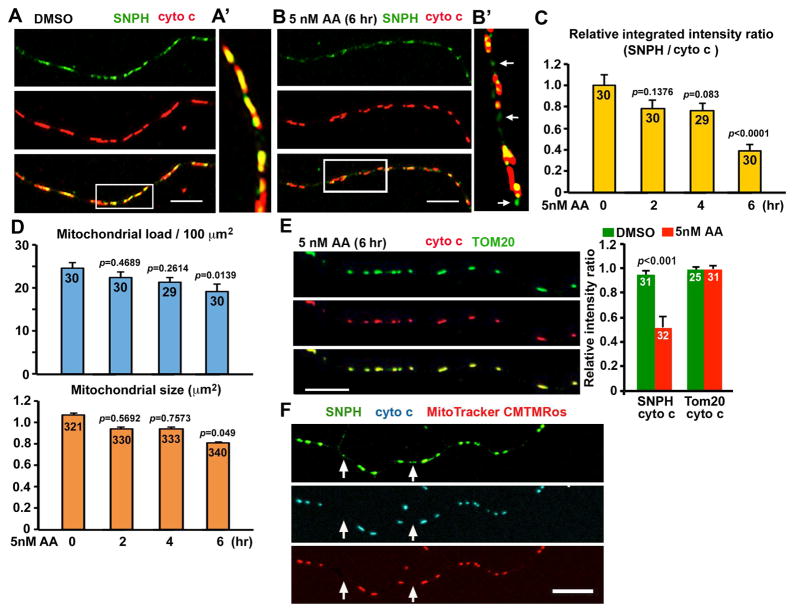
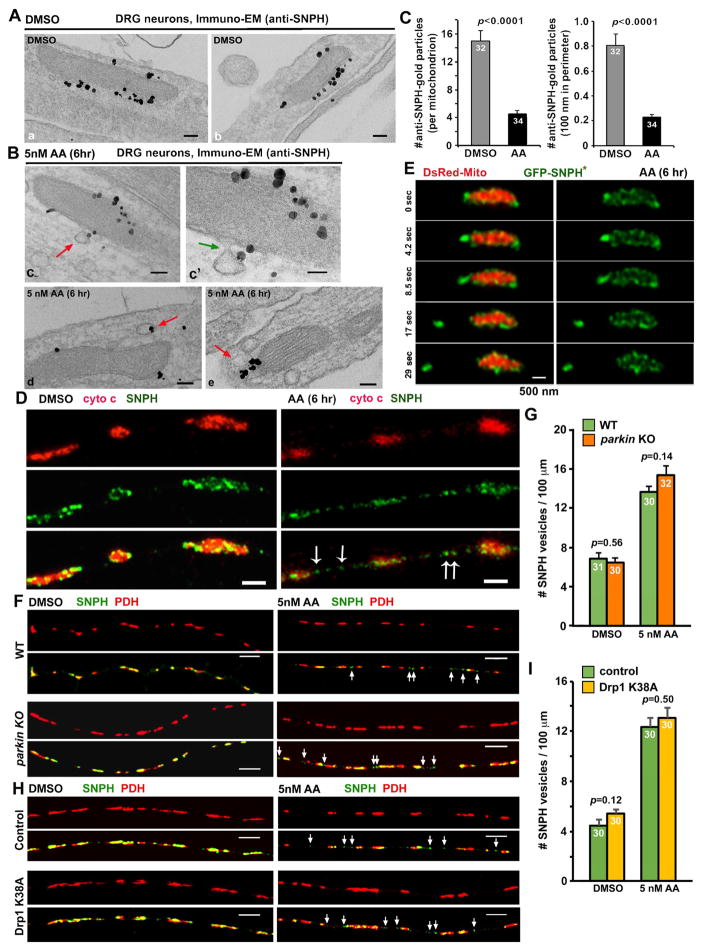
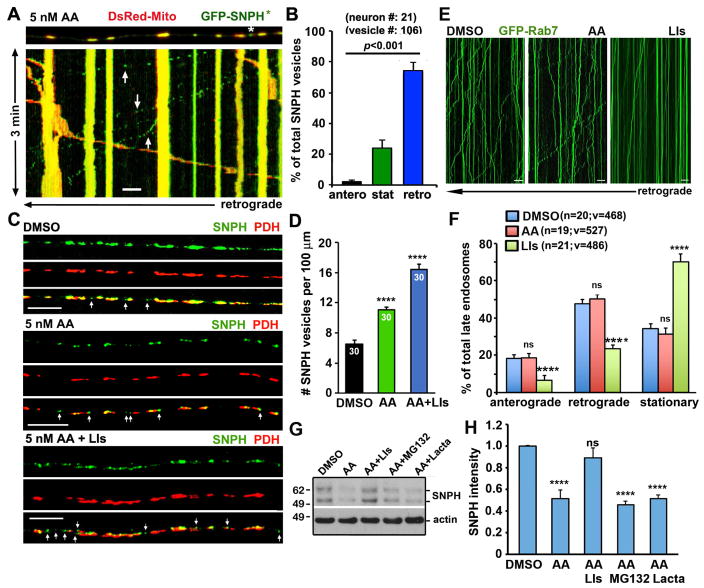
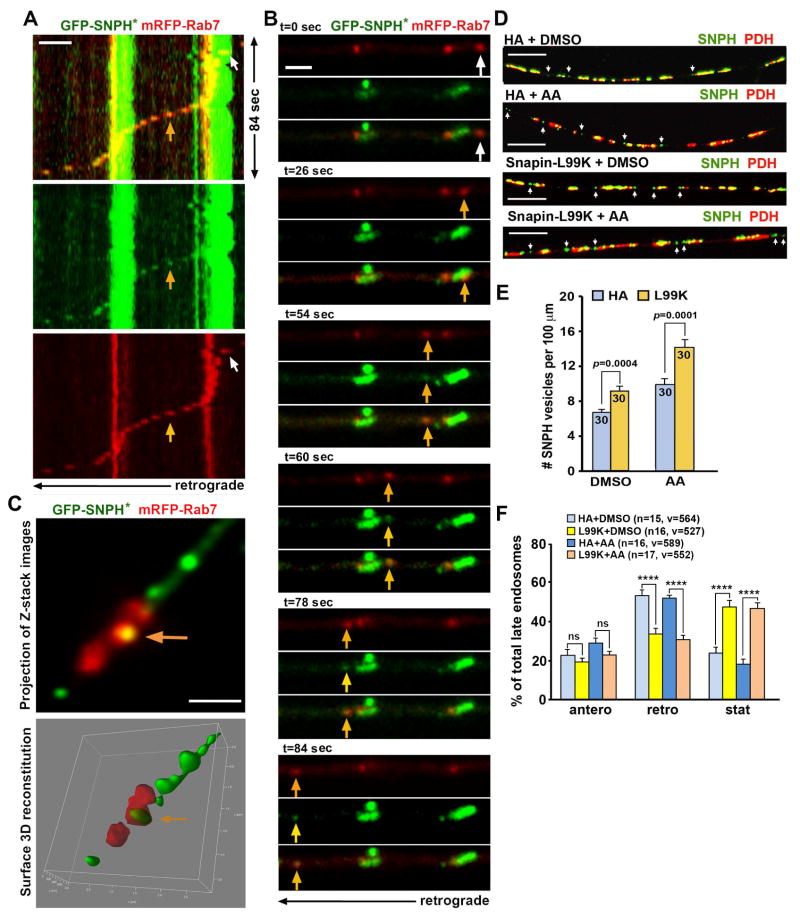
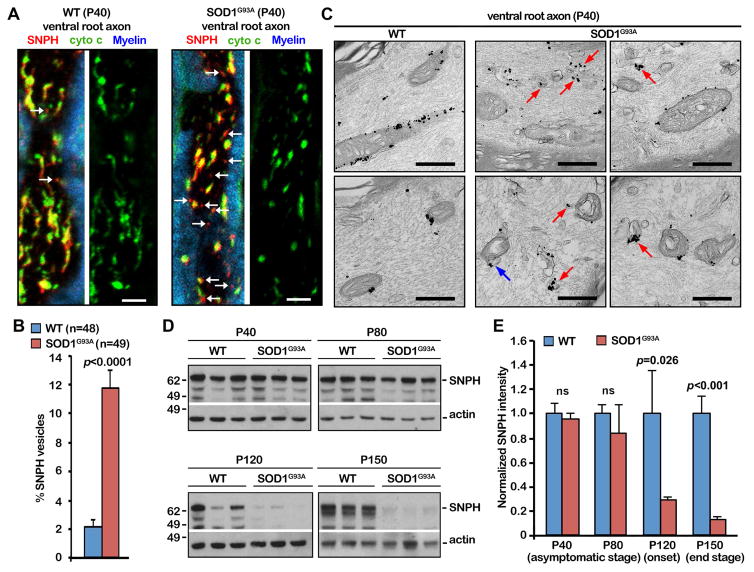
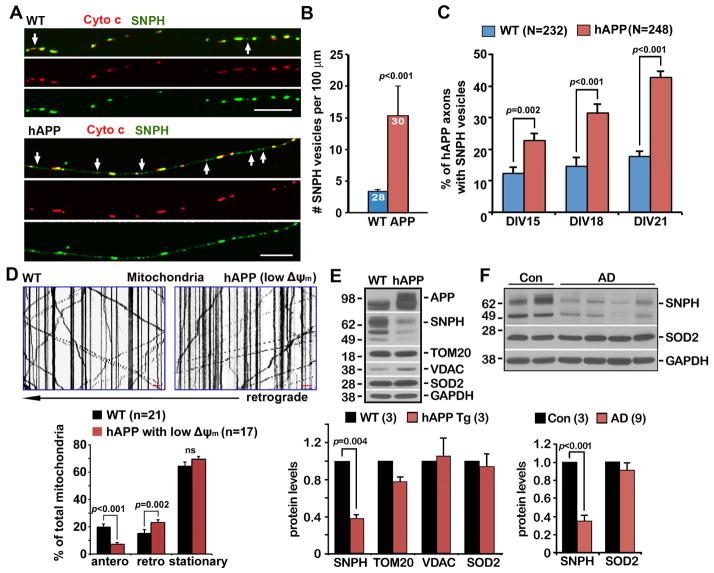
Chronic mitochondrial stress is a central problem associated with neurodegenerative diseases. Early removal of defective mitochondria from axons constitutes a critical step of mitochondrial quality control. Here we investigate axonal mitochondrial response to mild stress in wild-type neurons and chronic mitochondrial defects in Amytrophic Lateral Sclerosis (ALS)- and Alzheimer's disease (AD)-linked neurons. We show that stressed mitochondria are removed from axons triggered by the bulk release of mitochondrial anchoring protein syntaphilin via a new class of mitochondria-derived cargos independent of Parkin, Drp1, and autophagy. Immuno-electron microscopy and super-resolution imaging show the budding of syntaphilin cargos, which then share a ride on late endosomes for transport toward the soma. Releasing syntaphilin is also activated in the early pathological stages of ALS- and AD-linked mutant neurons. Our study provides new mechanistic insights into the maintenance of axonal mitochondrial quality through SNPH-mediated coordination of mitochondrial stress and motility before activation of Parkin-mediated mitophagy. VIDEO ABSTRACT.

Keywords: AD; ALS; Mitochondrial quality control; axonal mitochondria; late endosome; mitochondrial transport; physiological stress; syntaphilin.


Conflict of interest statement

COMPETING INTERESTS STATMENT

The authors declare no competing financial interests.

Figures

Figure 1
Figure 1. Arresting Mitochondrial Transport Impairs the Maintenance of Axonal Mitochondrial Integrity
(A) Seahorse XFe analysis of mitochondrial OCR following AA treatment with various dosages and durations. Cortical neurons at DIV10 were treated with DMSO or three concentrations of AA (5 nM, 100 nM, and 10 μM) for various time periods as indicated plus a 1-hour recovery following the 6-hour AA treatment. The OCR values were normalized with the cellular protein content of neuronal lysates. Note that while acute AA treatment (0.5 hours) with a high-dose (100 nM or 10 μM) causes a dramatic reduction of OCR, a low-dose AA (5 nM) gradually and reversibly reduces OCR over 6 hours (Also see Figure S1). (B) Schematic diagram of a microfluidic chamber that allows physical and fluidic separation of axons from cell bodies and dendrites. Cortical neurons were seeded in the soma/dendritic chamber where cell bodies and dendrites are restricted, while axons grow into the axonal chamber through the microgroove channels (450 μm in length). The device permits restricted depolarization of axonal mitochondria by adding AA in the axonal chamber. (C, D) Kymographs in the microgrooves (left panels), mitochondrial images in the axonal chamber (middle and right panels), and quantitative analysis showing that impaired the maintenance of mitochondria Δψm in axons by arresting mitochondrial transport following 5 nM AA treatment. Cortical neurons were infected with lentivirus encoding GFP-Mito and HA, HA-SNPH, or HA-Miro1 at DIV0. At DIV8, 5 nM AA was applied to the axon chamber for 3 and 6 hours followed by a 1-hour recovery. 100 nM CMTMRos was loaded for 20 minutes before fixation and imaging of mitochondrial Δψm. In the kymographs, vertical lines represent stationary mitochondria; slanted lines or curves to the left represent retrograde; to the right indicate anterograde motile mitochondria. The time-lapse images were captured for 100 frames with 5-sec intervals for 10 minutes. C′: enlarged views of the boxed regions. The relative integrated intensity ratio of CMTMRos against GFP-Mito was measured within individual mitochondria and normalized by HA control (Also see Figure S2). (E) Arresting mitochondria motility by overexpressing SNPH impairs the maintenance of axonal mitochondrial integrity in DRG neurons isolated from adult (P40) hSOD1G93A mice at the early disease stages. DRG neurons were co-infected with lentivirus expressing GFP-Mito and HA or HA-SNPH. Axonal mitochondrial Δψm was analyzed at DIV7 by loading 20 nM TMRE. The average mean TMRE intensity was assessed by relative TMRE fluorescence intensity within individual GFP-Mito masked areas in axons. (F) Kymographs and quantitative analysis showing the biased bi-directional transport of healthy versus dysfunctional mitochondria under mild stress conditions. DRG neurons were transfected with GFP-Mito at DIV0 and treated with 5 nM AA for 6 hours followed by a 1-hour recovery in fresh culture medium at DIV3. After neurons were loaded with 20 nM TMRE for 10 minutes, time-lapse images were taken in distal axons. Note that the majority of healthy mitochondria (orange), labeled with both TMRE and GFP-Mito, move in an anterograde direction toward the distal axon while depolarized ones (green) that lose TMRE staining mainly move toward the soma. The time-lapse two-channel images were captured for a total of 200 frames with 3-sec intervals. Data were quantified from n=9 samples (A), n=18 microgrooves (C), n=47–67 axonal chamber images per condition (D), n=37–42 neurons per condition (E), the total number of organelles (m) in 15–16 axons of DRG neurons isolated from three P8–P10 rats (sex: random) (K) in three independent experiments. Data were expressed as mean ± standard error and analyzed by one-way ANOVA with post hoc testing by Tukey’s multiple comparisons test (A, D, E) or the Mann-Whitney test (F). Scale bars: 20 μm (C) or 10 μm (C′, F).
Figure 2
Figure 2. SNPH Mediated the Regulation of Axonal Mitochondrial Transport in Response to Mild Stress
(A, B) Kymographs (A) and quantitative analysis (B) showing enhanced retrograde transport of axonal mitochondria in response to mild stress. Hippocampal neurons were transfected with DsRed-Mito at DIV6, followed by treatment of 5 nM AA at DIV10 for various time periods as indicated. Note that axonal mitochondria remain highly motile; a 6-hour treatment with 5 nM AA selectively enhances retrograde transport (Also see Movies S1–S4). (C, D) Kymographs (C) and quantitative analysis (D) showing a critical role of SNPH in the stress-induced regulation of axonal mitochondrial transport. Axonal mitochondrial motility of WT and snph KO cortical neurons was assessed before and after 5 nM AA treatment for 6 hours. Note that the AA-enhanced retrograde transport was not observed in snph KO neurons. (E, F) The selective degradation of SNPH following 5 nM AA treatment. Cortical neurons at DIV10 were treated with DMSO or 5 nM AA for different time periods as indicated. Equal amounts (9 μg) of cell lysates were sequentially immunoblotted on the same membrane with various antibodies after stripping. The intensities of OMM proteins SNPH, Miro1, TOM20, and VDAC were calibrated with actin levels and normalized to the 0-hour time point. Data were from three independent experiments. The time-lapse images were captured for a total of 100 frames with 5-sec intervals (A, C). Data were analyzed from the total of 732–906 mitochondria in n=27–33 axons per condition (B), the number of n=28–41 axons and 673–1090 mitochondria per condition from four pairs of WT and snph KO littermates in four independent experiments (D). Data were expressed as mean ± standard error. Comparisons were performed by the one-way ANOVA test (B, D) or unpaired Student’s t-test (F) (**, p<0.01; ***, p<0.001; ****, p<0.0001). Scale bars: 20 μm.
Figure 3
Figure 3. Generation of SNPH Cargo Vesicles from Stressed Axonal Mitochondria
(A–C) Representative images (A, B) and quantitative analysis (C) showing the generation of SNPH cargo vesicles from axonal mitochondria in response to mild stress conditions. Hippocampal neurons at DIV10 were treated with DMSO or 5 nM AA for 0, 2, 4, and 6 hours, followed by co-immunostaining with antibodies against cytochrome c (cyto c) and SNPH. Enlarged views of the boxed regions were shown in A′ and B′, respectively. Arrows indicate SNPH cargo vesicles detached from mitochondria (B′). The mean integrated intensity ratio of SNPH/cyto c was quantified following AA treatment (C). Note that normalized SNPH content (integrated intensity ratio against cyto c) was significantly reduced after a 6-hour treatment with 5 nM AA. (D) Quantitative analysis of average mitochondrial load (summed mitochondrial area per 100 μm axon length) and mitochondrial size following the 5 nM-AA treatment. (E) Images and quantitative analysis showing no detectable removal of TOM20 from axonal mitochondria after a 6-hour treatment with 5 nM AA (Also see Figure S3). (F) Representative images showing the loss of cyto c and Δψm of SNPH cargo vesicles after detaching from axonal mitochondria. Hippocampal neurons were loaded with the Δψm dye CMTMRos (pseudocolored red), followed by co-staining with anti-SNPH (pseudocolored green) and anti-cyto c (pseudocolored cyan) antibodies. Arrows point to SNPH cargo vesicles (green) without cyto c and Δψm. Data were quantified from n=29–30 axons for each group (C, upper panel of D), n=321–340 mitochondria in 13–15 axons (lower panel of D), and n=25–32 axons for each group (E) in three independent experiments. Data were expressed as mean ± standard error. Comparisons were performed by one-way ANOVA (C, D) and Mann-Whitney test (E). Scale bars: 10 μm.
Figure 4
Figure 4. The Parkin- and Drp1-Independent Budding Process of SNPH Cargo Vesicles from Axonal Mitochondria
(A, B) Immuno-EM graphs showing the budding process of SNPH in the form of cargo vesicles. DRG neurons were treated with DMSO (A) or 5 nM AA for 6 hours (B) at DIV3 and labeled with an anti-SNPH antibody and nanogold conjugates. SNPH-gold particles outline the surface of mitochondria (a, b) under DMSO control conditions or are present at the limiting membrane of a budding vesicle that is continuous with the OMM (c, c′) or single-membrane vesicular structures (d, e) in close proximity to mitochondria following AA treatment. c′: an enlarged view of a budding SNPH cargo. Arrows point to SNPH vesicles. (C) Quantitative analysis showing reduced SNPH-gold particles associated with the OMM under the AA-induced stress condition compared to DMSO control. (D) STED images showing endogenous SNPH cargo vesicles (arrows) detached from axonal mitochondria in response to AA-induced stress. DRG neurons were treated with DMSO or 5 nM AA for 6 hours at DIV3, followed by co-immunostaining of SNPH and cyto c. (E) Time-lapse STED live images showing a SNPH cargo vesicle pinching out from an axonal mitochondrion. DRG neurons at DIV0 were transfected with DsRed-Mito and GFP-SNPH* and imaged at DIV3 after a 6-hour incubation with 5 nM AA. Note that GFP-SNPH* (green) first appears as puncta on the surface of the mitochondrion. Under mild stress conditions, a SNPH cargo vesicle leaves from stressed mitochondrion in a time scale of 4–8 seconds. (F, G) Images (F) and quantitative analysis (G) showing Parkin-independent generation of SNPH cargo vesicles. Mouse DRG neurons from wide type (WT) and parkin KO mice were treated with DMSO or 5 nM AA for 6 hours at DIV3, followed by co-immunostaining of SNPH and PDH, a mitochondria matrix marker. White arrows indicate SNPH vesicles. (H, I) Images (H) and quantitative analysis (I) showing Drp1-independent generation of SNPH cargo vesicles. DRG neurons were transfected with a control vector or Drp1 K38A mutant at DIV0 and treated with DMSO or AA (5 nM for 6 hours) at DIV3, followed by co-immunostaining of SNPH and PDH. White arrows indicate SNPH vesicles. Data were analyzed from the total number of immuno-EM graphs (C) from four P8–10 rats (sex: random) or the total number of axons (G, I) indicated within the bars from three experiments (G: three pairs of P90 mice; I: from three P8–10 rats, sex: random). Error bars: SEM. Unpaired student’s t-test with Welch’s correction. Scale bars: 100 nm (A, Ba–e), 50 nm (Bc′), 1 μm (D), 500 nm (E), and 5 μm (F, H) (Also see Figure S4).
Figure 5
Figure 5. SNPH Cargo Vesicles Undergo Retrograde Transport for Lysosomal Degradation
(A, B) A representative image and kymograph (A) and quantitative analysis (B) showing retrograde transport of SNPH cargo vesicles. DRG neurons were transfected with GFP-SNPH* and DsRed-Mito at DIV0 and treated with AA (5 nM for 6 hours) at DIV3, followed by dual-channel time-lapse imaging at 2-second intervals for a total of 3 minutes. The upper panel shows the first frame of the time-lapse series. The asterisk points to a SNPH cargo vesicle (green) and the yellow organelles represent mitochondria (DsRed-Mito) containing GFP-SNPH*. Data were collected from 21 neurons with total of 106 vesicles from three P8–P10 rats; sex: random. (C, D) Images (C) and quantitative analysis (D) showing the reduced turnover of SNPH cargo vesicles after inhibition of the endo-lysosomal pathway. DRG neurons were treated with DMSO or AA (5 nM for 6 hours) in the presence or absence of lysosomal inhibitors (LIs) (10 μM: pepstatin A, leupeptin and E64D), followed by co-immunostaining of SNPH and PDH. Data were collected from 30 neurons examined for each group from three P8–P10 rats; sex: random. Arrows point to SNPH cargo vesicles. (E, F) Kymographs (E) and quantitative analysis (F) showing impaired retrograde transport of LEs in axons treated with LIs. DRG neurons were transfected with GFP-Rab7 at DIV0 and treated with AA or LIs. Note that LIs impair the LE motility in axons. The total number of LEs (v) in the total number of axons (n) examined is indicated in parentheses from at least three experiments. Data were collected from the total of vesicles (v) in the number of neurons (n), as indicated, from three P8–P10 rats; sex: random. (G, H) Immunoblots (G) and quantitative analysis (H) showing lysosome-dependent SNPH degradation. Cortical neurons at DIV10 were treated with DMSO, 5 nM AA, or 5 nM AA with LIs (10 μM E64D and 10 μM pepstatin A) or a proteasome inhibitor (10 μM MG132 or 10 μM lactacystin) for 6 hours. 10 μg of neuronal lysates were loaded and sequentially immunoblotted on the same membrane with antibodies against SNPH and actin. Note that LIs, but not a proteasome inhibitor, abolishes AA-induced degradation of SNPH. Data were collected from n=3 independent replications. Data were analyzed with Ordinary one-way ANOVA (ns, not significant, ****, p<0.0001). Error bars: SEM. Scale bars: 10 μm.
Figure 6
Figure 6. SNPH Vesicles Share the Ride with Late Endosomes
(A, B) Kymographs (A) and time-lapse images (B) demonstrate that a LE (red) carries a SNPH cargo vesicle (green) for retrograde transport along an axon. DRG neurons were transfected with GFP-SNPH* and mRFP-Rab7 at DIV0 and treated with AA (5 nM for 6 hours) at DIV3. White arrows indicate a LE just passing a stationary mitochondrion, whereas yellow arrows point to a newly generated SNPH cargo vesicle that rides on the LE moving in the retrograde direction toward the soma, a process that occurs within ~84 seconds (Also see Figure S5). (C) STED image showing co-localized LE and SNPH cargo vesicle. Z-stack images were taken at step size of 110 nm. The yellow arrow indicates a SNPH vesicle (green) being wrapped by a LE (red). The images were processed with de-convolution before max-projection and 3D surface reconstitution, respectively (Also see Movie S5). (D–F) Representative images (D) and quantitative analysis (E, F) showing retained SNPH cargo vesicles in axons when LE transport is impaired by expressing Snapin-L99K. DRG neurons were transfected with Snapin-L99K or HA vector at DIV0 and treated with AA (5 nM for 6 hours) or DMSO at DIV3, followed by co-immunostaining of SNPH and PDH (D, E) or co-transfected with mRFP-Rab7 followed by time-lapse imaging (F). Arrows point to SNPH cargo vesicles. Data were analyzed from a total number of axons indicated in the bars (E) or a total number of LEs (v) from the number of neurons (n) indicated in parentheses (F) in at least three experiments. Three (F) or four rats (D, E) at age of P8–P10 were used (sex: random). Unpaired t test (E) or one-way Anova test (F) (****: p<0.0001). Error bars: SEM. Scale bars: 2 μm (A, B); 1 μm (C), and 10 μm (D).
Figure 7
Figure 7. SNPH Pathway is Activated in Early Disease Stages of fALS-Linked Mice
(A, B) Images (A) and quantitative analysis (B) showing the bulk release of SNPH in the form of cargo vesicles from damaged mitochondria in early asymptomatic hSOD1G93A mice. Ventral root axon bundles of spinal motor neurons from P40 WT and hSOD1G93A littermates were co-immunostained with cytochrome c (green), SNPH (red), and Myelin dye (blue). Arrows point to SNPH cargo vesicles. SNPH vesicles were quantified as the percentage of SNPH vesicles from a total number of mitochondria labeled with both cytochrome c and SNPH. Data were analyzed from the total number of axon sections (n) from three pairs of WT and hSOD1G93A littermates. Fifteen to seventeen sections were taken from each animal. (C) SNPH immuno-EM graphs showing SNPH cargo vesicles in the ventral root axons of early asymptomatic hSOD1G93A mice (P40). Red arrows point to vesicular structures labeled with SNPH-nanogold particles. The blue arrow indicates a SNPH vesicle that is pinching out of a mitochondrion. (D, E) Western blots (D) and quantitative analysis (E) showing SNPH depletion in the sciatic nerve of hSOD1G93A mice after disease onset at age P120. SNPH intensities were normalized by actin and compared with an age-matched control group. For each time point, data were collected from at least three animals (n=3) for each genotype. Data were expressed as mean ± SEM with the unpaired Student’s t-test. Scale bars: 10 μm (A) and 500 nm (B) (Also see Figure S6).
Figure 8
Figure 8. SNPH Pathway is Activated in AD-linked Mutant hAPP Tg Neurons
(A, B) Representative images (A) and quantitative analysis (B) showing increased generation of SNPH cargo vesicles in cortical neurons at DIV14–15 from mutant hAPP Tg (J20) mice. The average number of SNPH cargo vesicles (white arrows) per 100 μm axons was quantified from the total number of WT and hAPP neurons indicated in the bars (B) from three pairs of littermates in three independent experiments. (C) The percentage of mutant hAPP axons with detectable SNPH vesicles. Data were analyzed from the total number of axons indicated in parentheses in three independent experiments. (D) Representative kymographs and quantitative analysis showing reduced anterograde and enhanced retrograde transport of axonal mitochondria with reduced Δψm. Data were analyzed from the total number of axons indicated in parentheses in three independent experiments. (E) Representative western blots showing SNPH depletion in the brains of mutant hAPP Tg (J20) mice. A total of 20 μg of brain homogenates from WT and hAPP Tg mice was sequentially detected on the same membrane. Relative protein levels were normalized by GAPDH and to that of WT littermates. Data were analyzed from three pairs of WT and hAPP Tg littermates. (F) Western blots showing reduced SNPH in postmortem brain specimens from AD patients. A total of 20 μg of brain homogenates from the cortices of age-matched controls and AD patients was sequentially detected on the same membrane. Relative protein levels were normalized by GAPDH and to those of control subjects. Data were analyzed from the number of human brain samples indicated in parentheses in three independent experiments. Data were expressed as mean ± SEM with the Mann-Whitney test (A, D), the unpaired Student’s t-test (B), or the two-tailed Student’s t-test (E, F). Scale bars (A, D): 10 μm.

References

    1. Ashrafi G, Schlehe JS, LaVoie MJ, Schwarz TL. Mitophagy of damaged mitochondria occurs locally in distal neuronal axons and requires PINK1 and Parkin. J Cell Biol. 2014;206:655–670. - PMC - PubMed
    1. Banker GA, Cowan WM. Further Observations on Hippocampal-Neurons in Dispersed Cell-Culture. J Comp Neurol. 1979;187:469–493. - PubMed
    1. Braak H, Braak E. Neuropathological stageing of Alzheimer-related changes. Acta Neuropathol. 1991;82:239–259. - PubMed
    1. Birsa N, Norkett R, Higgs N, Lopez-Domenech G, Kittler JT. Mitochondrial trafficking in neurons and the role of the Miro family of GTPase proteins. Biochem Soc Trans. 2013;41:1525–1531. - PubMed
    1. Cai Q, Lu L, Tian JH, Zhu YB, Qiao H, Sheng ZH. Snapin-regulated late endosomal transport is critical for efficient autophagy-lysosomal function in neurons. Neuron. 2010;68:73–86. - PMC - PubMed

Publication types

MeSH terms