. 2017 Jul 1;313(1):L41-L51.
doi: 10.1152/ajplung.00564.2016. Epub 2017 May 4.

CD44high alveolar type II cells show stem cell properties during steady-state alveolar homeostasis

Affiliations

CD44high alveolar type II cells show stem cell properties during steady-state alveolar homeostasis

Qian Chen et al. Am J Physiol Lung Cell Mol Physiol. .

Abstract

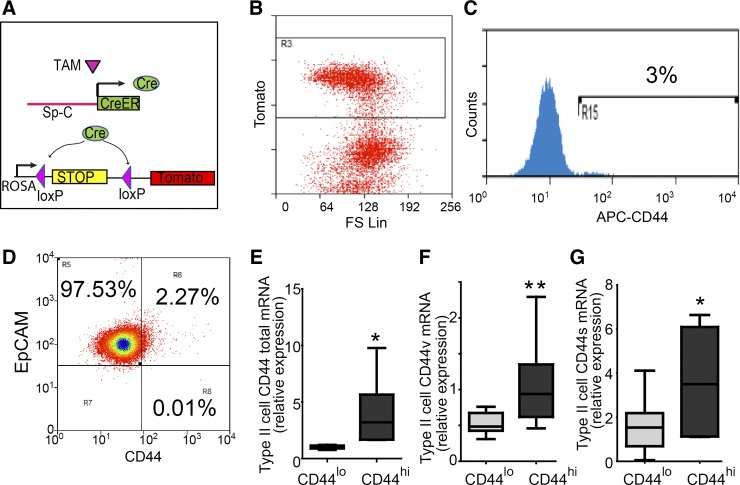
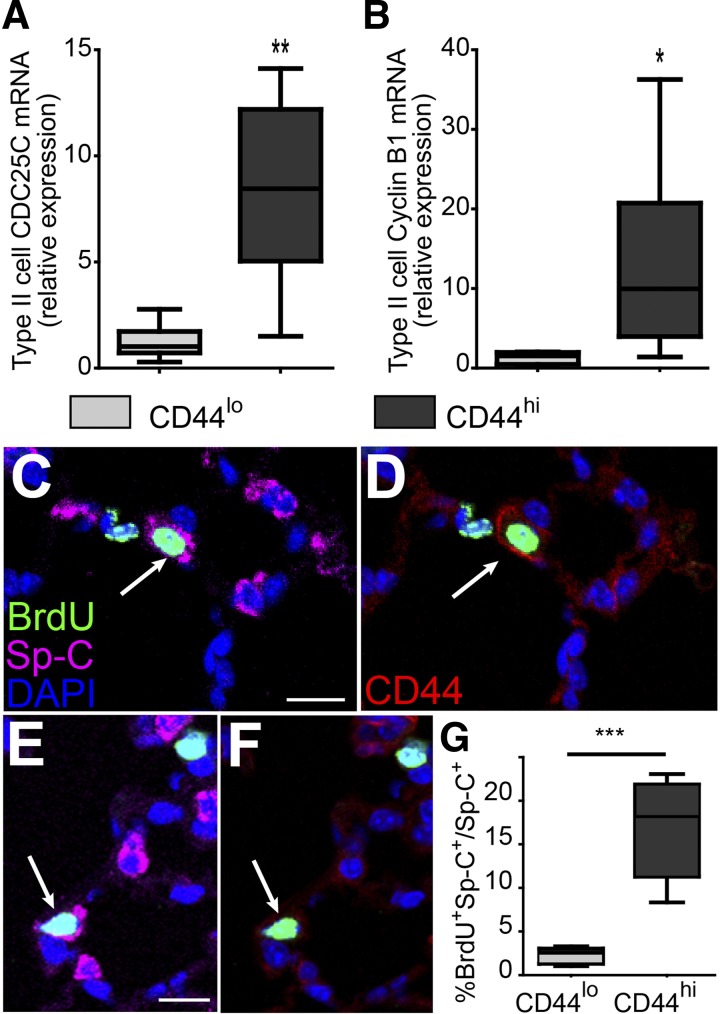
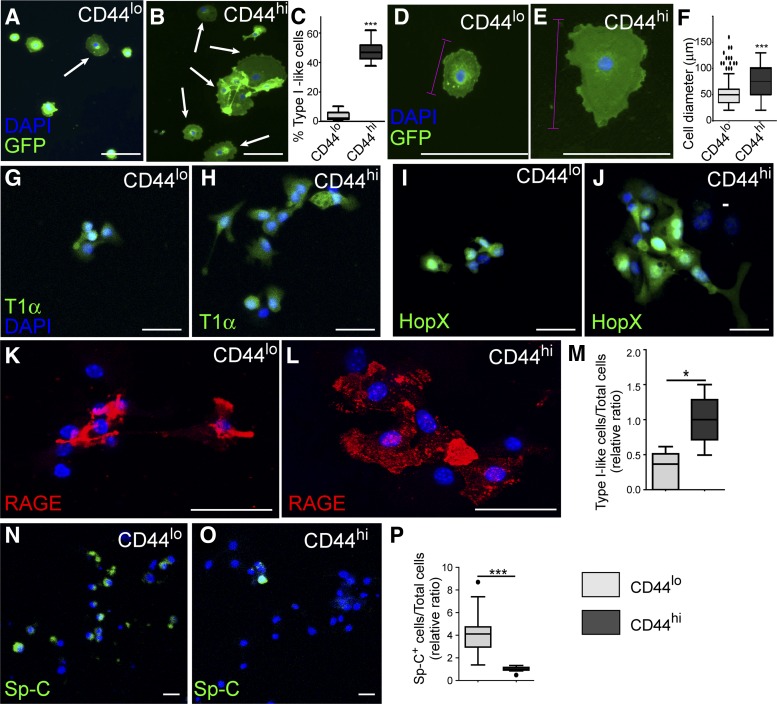
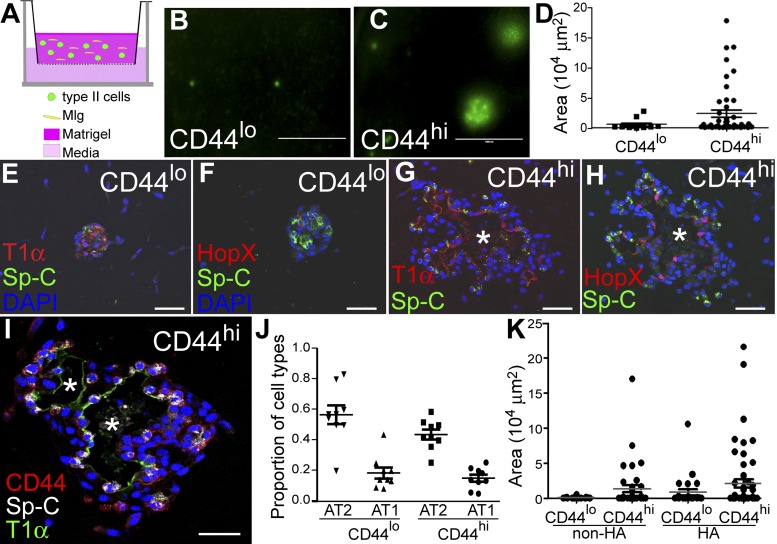
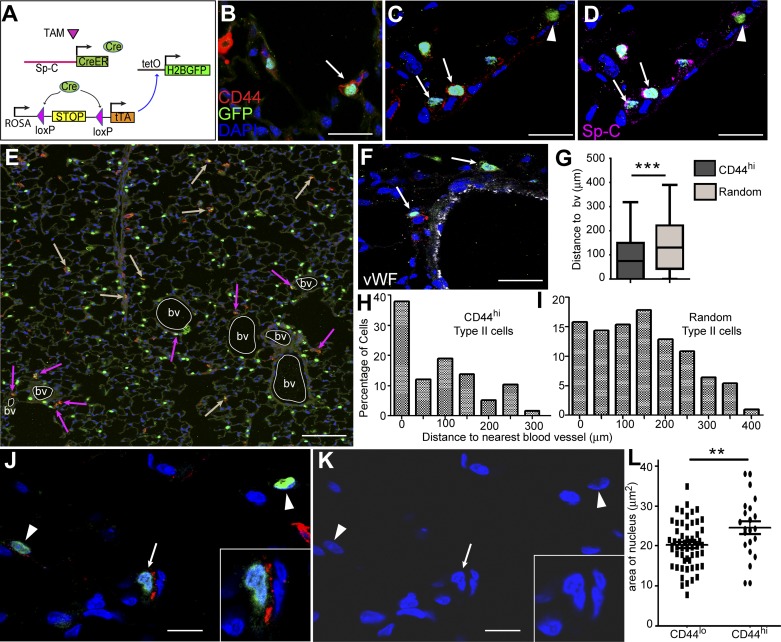
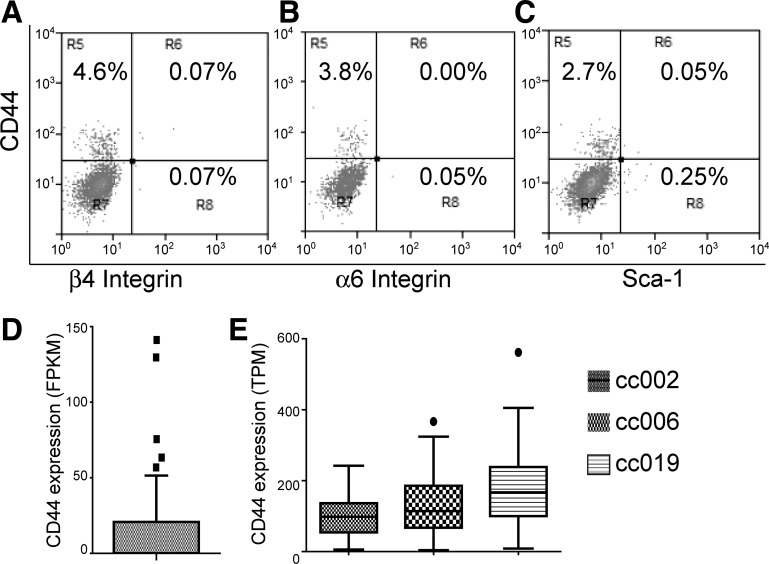
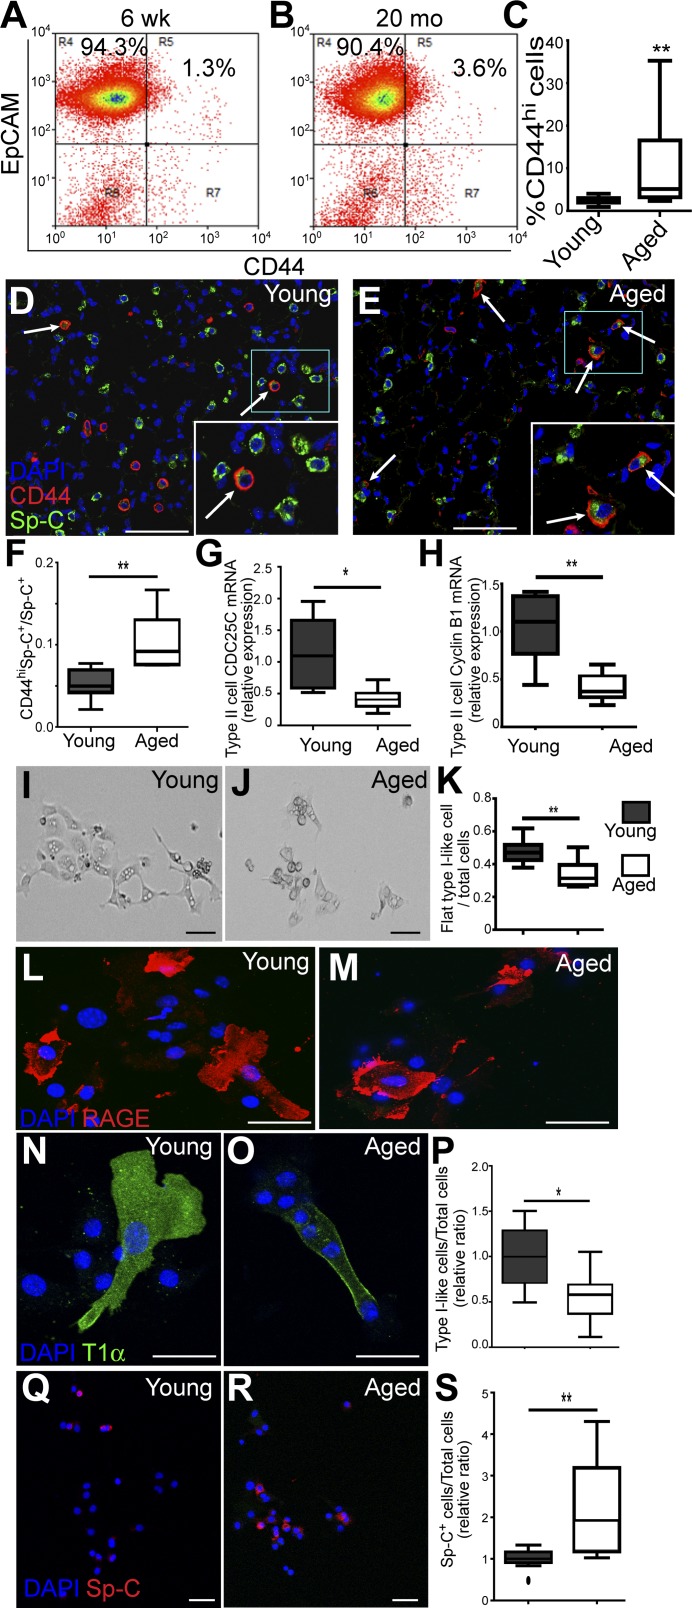
The alveolar epithelium is composed of type I cells covering most of the gas-blood exchange surface and type II cells secreting surfactant that lowers surface tension of alveoli to prevent alveolar collapse. Here, we have identified a subgroup of type II cells expressing a higher level of cell surface molecule CD44 (CD44high type II cells) that composed ~3% of total type II cells in 5-10-wk-old mice. These cells were preferentially apposed to lung capillaries. They displayed a higher proliferation rate and augmented differentiation capacity into type I cells and the ability to form alveolar organoids compared with CD44low type II cells. Moreover, in aged mice, 18-24 mo old, the percentage of CD44high type II cells among all type II cells was increased, but these cells showed decreased progenitor properties. Thus CD44high type II cells likely represent a type II cell subpopulation important for constitutive regulation of alveolar homeostasis.

Keywords: CD44; alveoli; homeostasis; lung; type II cells.


Figures

Fig. 1.
Fig. 1.
Isolation of CD44high type II cells from Sp-C lineage-tracing mouse lines. A: to identify type II cells from adult mice, four doses of tamoxifen (TAM; 0.25 mg/g) were given to SpC-CreER/Rosa-Tomato mice, in which TAM-induced Cre activation causes excision of the stop codon upstream of Tomato, resulting in lineage labeling of Sp-C+ cells. B and C: alveolar epithelial cells were isolated using a type II cell-enriched protocol and subjected to FACS analysis. Type II cells were selected by gating for the Tomato+ population (B) and were further separated into CD44low and CD44high populations (C). Approximately 3% of the type II cells were positive for CD44. FS Lin, forward scatter linear; R3, region 3. D: Tomato+ cells were gated and analyzed for the expression of EpCAM and CD44. Of the Tomato+ cells, 99.8% were EpCAM+, and of the Tomato+ CD44high cells, 99.6% were EpCAM+. These data are representative of >5 independent experiments. E–G: expression levels of CD44 isoforms in sorted cells were analyzed using qRT-PCR using primers that specifically detect all isoform types (CD44 total; E), the variant isoforms containing variable exons (CD44v; F), or standard isoform (CD44s; G). Compared with CD44low type II cells, CD44high type II cells expressed significantly higher levels of total CD44 (E), CD44v (F), and CD44s (G). Data are presented as Tukey box plots. *P < 0.05, **P < 0.01; n = 7 mice.
Fig. 2.
Fig. 2.
CD44high type II cells show higher cell proliferation compared with CD44low type II cells. A and B: relative expression of CDC25C (A) and cyclin B1 (CCNB1; B) in sorted CD44high and CD44low type II cells was analyzed using qRT-PCR. Both genes showed significantly higher expression levels in CD44high type II cells compared with CD44low type II cells. Data are presented as Tukey box plots. *P < 0.05, **P < 0.01; n = 7 mice. C–G: BrdU-labeled type II cells in C57BL/6 mice. Lungs from BrdU-injected mice were subjected to immunohistological analysis, and cell proliferation rates of CD44low or CD44high type II cells were scored as BrdU+Sp-C+CD44low cells vs. Sp-C+CD44low cells or BrdU+Sp-C+CD44high cells vs. Sp-C+CD44high cells, respectively. C and D show the same section with a BrdU+Sp-C+CD44high cell, and E and F show the same section with a BrdU+Sp-C+CD44low cell. G: for each mouse, ~600 Sp-C+ cells were scored; n = 5 mice. Data are presented as Tukey box plot. ***P < 0.001.
Fig. 3.
Fig. 3.
CD44high type II cells differentiate into type I cells in vitro. CD44high and CD44low type II cells were grown on 0.2% gelatin-coated plates. A and B: after 48 h of culture, some cells adopted flattened type I cell-like morphology (arrows). C: percentages of the flattened type I-like cells were significantly higher in the CD44high cell cultures compared with those of CD4low cells. D and E: higher-magnification images of representative cells derived from CD44low (D) or CD44high (E) type II cells after growing 5 days in vitro. Cell diameters were measured on the basis of the longer axis of the cell (pink lines). F: quantification of cell diameters after 5 days of culture showed that average diameter of the flattened cells derived from CD44high type II cells were significantly larger than those from CD44low type II cells. G–L: cells were fixed at 72-h postculture and subjected to immunohistochemistry analysis of type I cell markers T1α (G and H), HopX (I and J), and RAGE (K and L). Some of the flattened-shaped cells from both CD44low (G, I, K) and CD44high (H, J, and L) cultures expressed these type I cell markers. M: cells expressing any of the above type I cell markers were counted, and the ratio of these type I-like cells to total cells was calculated. N and O: cells were stained for type II cell marker Sp-C at 72-h postculture. CD44low cells (N) had more Sp-C-expressing cells than CD44high cells did (O). P: Sp-C+ cells were counted, and the ratio of Sp-C+ cells to total cells was calculated. Scale bar = 30 µm for A, B, G–L, N, and O. Scale bar = 100 µm for D and E. The data in C, F, M, and P are presented as Tukey box plots. *P < 0.05, ***P < 0.001. Each sample group of the quantification data (C, F, M, and P) was from >5 mice; 50–200 cells randomly selected from each group from each mouse were scored. Because of the slight variation in culture condition of each independent experiment, M and P are plotted as the relative value compared with the average result of CD44high cells cultured at the same time.
Fig. 4.
Fig. 4.
CD44high type II cells form alveolar-like organoids in 3-D culture. A: schematic showing the culture conditions used for organoid formation. Five thousand CD44high or CD44low type II cells sorted from SpC-CreER/Rosa-mTmG mice were mixed with 100,000 Mlg fibroblast cells and cultured in a 50% Matrigel/collagen mixture inside a 24-well Transwell insert, and 600 μl of culture medium were added outside the Transwell insert. B and C: representative images of GFP+ colonies formed with CD44low (B) or CD44high (C) type II cells after 14 days of culture. Scale bar = 1,000 μm. D: scatterplot showing the sizes of individual GFP+ colonies formed from CD44low or CD44high type II cells. More large colonies were formed with CD44high type II cells. The sizes are presented as areas of the cysts, measured with the ImageJ program using images represented by B and C. Cells from two to four mice were pooled in each experiment, and data are representative of four independent experiments. E–H: immunohistochemistry of sections of GFP+ colonies showed that both CD44low (E and F) and CD44high (G and H) type II cells formed colonies expressing the type II cell marker Sp-C and the type I cell markers T1α (E and G) and HopX (F and H). CD44high type II cells formed colonies arranged into alveolar-like structures with a large lumen inside (*; G and H). In contrast, CD44low type II cells formed colonies that were smaller with no clear identifiable lumen (E and F). I: some cells in the CD44high type II cell-derived colonies maintained CD44 expression after 2 wk of culture. Scale bar = 50 μm for E–I. J: proportions of type II cells (AT2) or type I cells (AT1) relative to all cells in the colonies were scored on the basis of Sp-C and HopX staining and are plotted for CD44low or CD44high cultures. K: CD44low and CD44high cells were cultured in Matrigel mixed with or without HMW HA for 11 days. The sizes of individual colonies formed are plotted for these culture conditions.
Fig. 5.
Fig. 5.
CD44high type II cells are preferentially located in pericapillary niche. A: schematic showing the labeling strategy for type II cells in SpC-CreER/Rosa-tTA/tetO-H2B-GFP mice. Adult mice were given four doses of tamoxifen (TAM; 0.25 mg/g) 2 wk before lung isolation. Sp-C+ cell-specific Cre then excises the stop codon upstream of tTA, leaving it to activate the tetO promoter, which drives the expression of H2B-GFP in Sp-C+ cells. B: immunohistochemistry analysis of lung sections from these mice showed that only a small fraction of GFP+ cells expressed CD44 at the cell membrane (arrow). C and D: the same lung sections showed staining with GFP and CD44 (C) and GFP and Sp-C (D). The arrows show that GFP+CD44high cells were also positive for Sp-C. Arrowheads indicate cells that were GFP+Sp-C+ type II cells but had no CD44 expression. E: 6 × 6 tiled confocal image showing the distribution of CD44high cells in a larger area of the lung section. Blood vessels (bv) are outlined by white circles, pink arrows show GFP+CD44high cells that are adjacent to bv, and tan arrows indicate those cells that are farther away from bv. F: blood vessels in the lung were labeled with vWF. Arrows show GFP+CD44high cells located adjacent to bv. G–I: GFP+CD44high cells were more frequently detected at perivascular regions of the lung. Sixty-two GFP+CD44high type II cells from five 6 × 6 tiled pictures captured at random locations in lung sections (H) and 204 random GFP+ type II cells in those pictures (I) were analyzed for their distance to the nearest bv; the percentage of the cells vs. the distance to bv is plotted. The mean distance to nearest bv is significantly less for the GFP+CD44high type II cells compared with the random GFP+ type II cells (G); data are presented as Tukey box plot. J–L: areas of nuclei were measured using ImageJ for CD44high (arrows and insets) and CD44low (arrowheads) type II cells and are plotted (L). K is the same image as J but only shows DAPI. **P < 0.01, ***P < 0.001. Scale bar = 30 μm for B, C, D, and F. Scale bar = 150 μm for E. Scale bar = 10 μm for J and K.
Fig. 6.
Fig. 6.
CD44high type II cells are negative for integrin-α6, integrin-β4, and Sca-1 and can be identified from published single-cell RNAseq analysis data. A–C: type II cells were isolated from SpC-CreER/Rosa-Tomato mice that had been given four doses of tamoxifen (0.25 mg/g) and were subjected to FACS analysis. Tomato-positive cells were gated (not shown) and further analyzed for the expression of CD44, integrin-α6, integrin-β4, and Sca-1. Numbers indicate the percentage of cells in the indicated fraction out of the total gated cells. The data are representative of at least two independent experiments. D: FPKM values of CD44 of 46 lineage-labeled adult mouse type II cells (accession no. GSE52583) are plotted. E: TPM values of CD44 from 84, 47, and 77 type II cells from 3 healthy donors (accession no. GSE84147) are plotted. Data are presented as Tukey box plots.
Fig. 7.
Fig. 7.
Aged mice have more CD44high type II cells, but these cells exhibit decreased progenitor properties. A and B: type II cells isolated from 6–8-wk-old (young) or 18–24-mo-old (aged) C57BL/6 mice were analyzed for the presence of EpCAM+CD44high cells. C: percentages of EpCAM+CD44high cells among all the EpCAM+ type II cells are plotted for young and aged mice; n = 11 mice for each age group. D–F: young (D) or aged (E) C57BL/6 mice were subjected to paraffin sectioning and antibody staining, and the percentages of CD44highSp-C+ vs. all Sp-C+ cells were scored and are plotted. Five to eight mice were scored for each age group (F). Arrows in D and E show CD44highSp-C+ cells. Insets in white rectangles are enlarged pictures of blue rectangles. G and H: EpCAM+CD44high cells of the two age groups were isolated by FACS and subjected to qRT-PCR analysis for expression of CDC25C (G) and cyclin B1 (CCNB1; H); n = 7 mice. I–K: EpCAM+CD44high cells from young (I) and aged mice (J) were cultured on gelatin-coated slides for 3 days. Images are representative of similar observations for six to eight mice for each group. The ratios of flat type I-like cells vs. total cells are plotted. For each mouse, 50–200 cells were scored (K). L–O: cultured EpCAM+CD44high cells from young (L and N) and aged (M and O) mice were stained for type I cell markers RAGE (L and M) or T1α (N and O). P: the ratios of cells that expressed either type I cell marker (type I-like cells) vs. total cells were scored; n = 5–7 mice for each group. Q and R: cultured cells from young (Q) and aged (R) mice were stained for type II cell marker Sp-C. S: the ratios of cells that maintained Sp-C expressions were scored; n = 10 mice for each group. Because of the slight variation in culture condition of each independent experiment, P and S are presented as the relative value compared with the average ratios of cells from young mice in the experiment conducted at same time. C, F–H, K, P, and S are Tukey box plots; *P < 0.05, **P < 0.01. Scale bar = 30 μm.

References

    1. Barkauskas CE, Michael J, Cronce MJ, Rackley CR, Bowie EJ, Keene DR, Stripp BR, Randell SH, Noble PW, Hogan BL. Type 2 alveolar cells are stem cells in adult lung. J Clin Invest 123: 3025–3036, 2013. doi: 10.1172/JCI68782. - DOI - PMC - PubMed
    1. Brown RL, Reinke LM, Damerow MS, Perez D, Chodosh LA, Yang J, Cheng C. CD44 splice isoform switching in human and mouse epithelium is essential for epithelial-mesenchymal transition and breast cancer progression. J Clin Invest 121: 1064–1074, 2011. doi: 10.1172/JCI44540. - DOI - PMC - PubMed
    1. Chapman HA, Li X, Alexander JP, Brumwell A, Lorizio W, Tan K, Sonnenberg A, Wei Y, Vu TH. Integrin α6β4 identifies an adult distal lung epithelial population with regenerative potential in mice. J Clin Invest 121: 2855–2862, 2011. doi: 10.1172/JCI57673. - DOI - PMC - PubMed
    1. Desai TJ, Brownfield DG, Krasnow MA. Alveolar progenitor and stem cells in lung development, renewal and cancer. Nature 507: 190–194, 2014. doi: 10.1038/nature12930. - DOI - PMC - PubMed
    1. Dobbs LG. Isolation and culture of alveolar type II cells. Am J Physiol Lung Cell Mol Physiol 258: L134–L147, 1990. - PubMed

Publication types

Substances

LinkOut - more resources