The clinical and cost effectiveness of a virtual fracture clinic service: An interrupted time series analysis and before-and-after comparison
- PMID: 28473333
- PMCID: PMC5457647
- DOI: 10.1302/2046-3758.65.BJR-2017-0330.R1
The clinical and cost effectiveness of a virtual fracture clinic service: An interrupted time series analysis and before-and-after comparison
Abstract
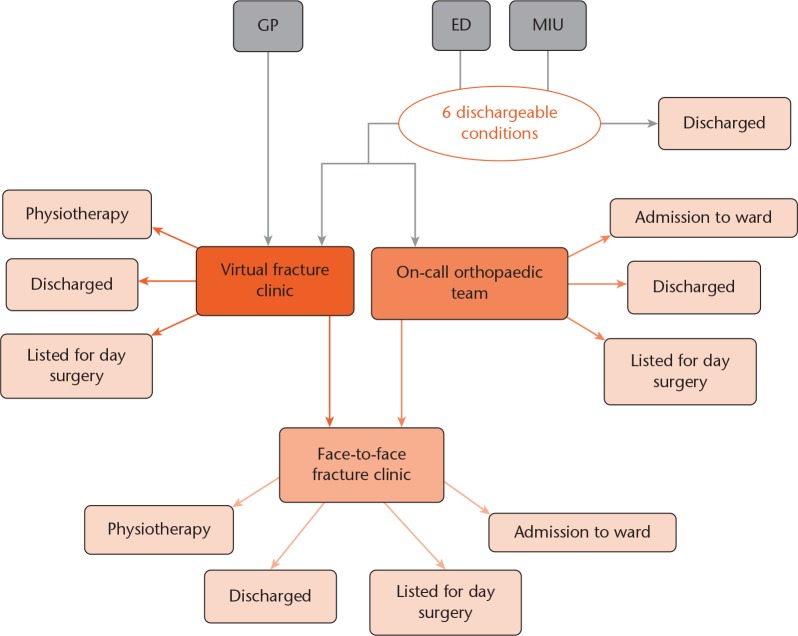
Objectives: To assess the clinical and cost-effectiveness of a virtual fracture clinic (VFC) model, and supplement the literature regarding this service as recommended by The National Institute for Health and Care Excellence (NICE) and the British Orthopaedic Association (BOA).
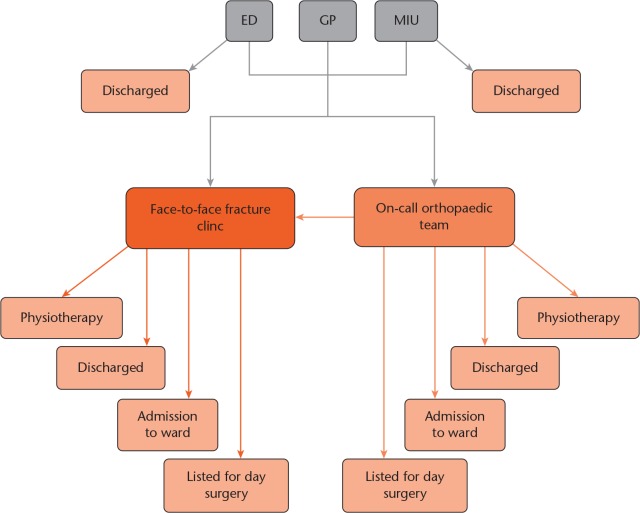
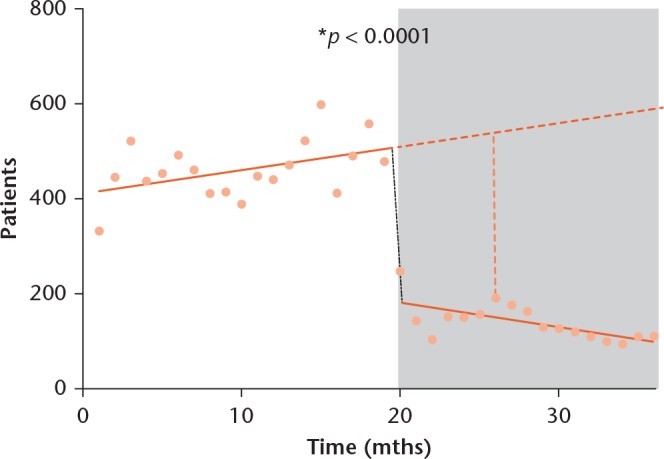
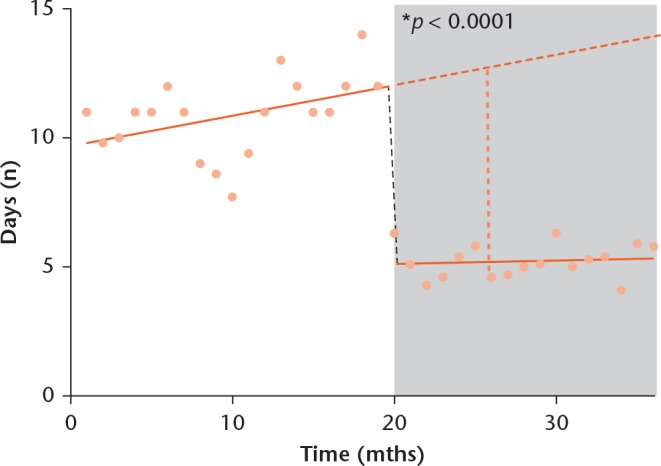
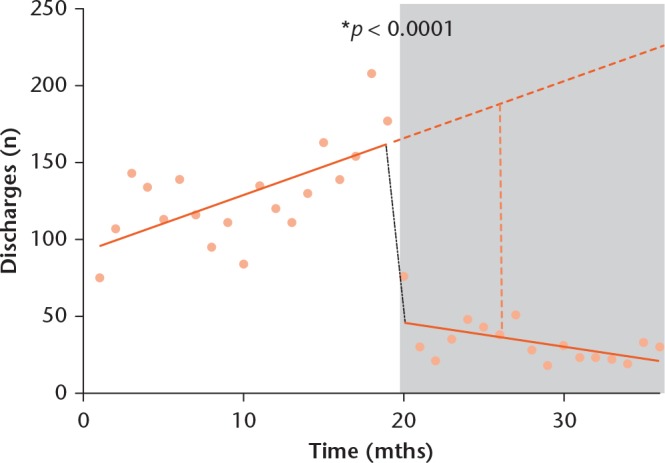
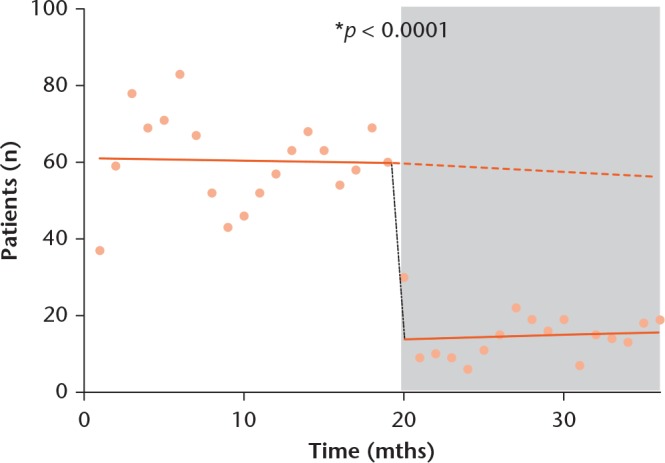
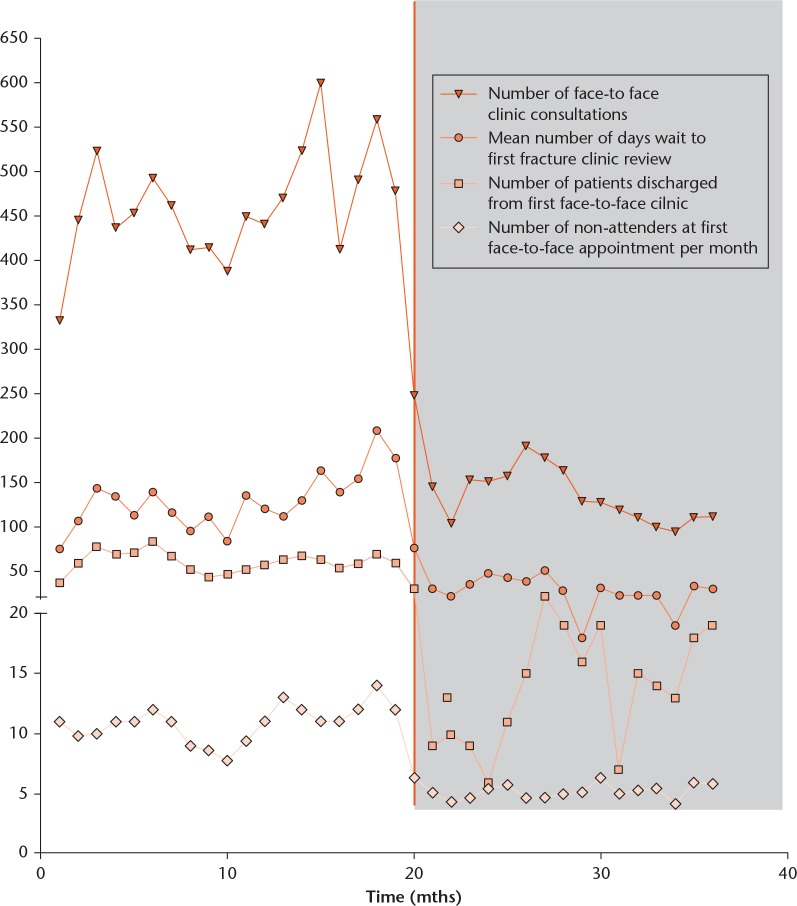
Methods: This was a retrospective study including all patients (17 116) referred to fracture clinics in a London District General Hospital from May 2013 to April 2016, using hospital-level data. We used interrupted time series analysis with segmented regression, and direct before-and-after comparison, to study the impact of VFCs introduced in December 2014 on six clinical parameters and on local Clinical Commissioning Group (CCG) spend. Student's t-tests were used for direct comparison, whilst segmented regression was employed for projection analysis.
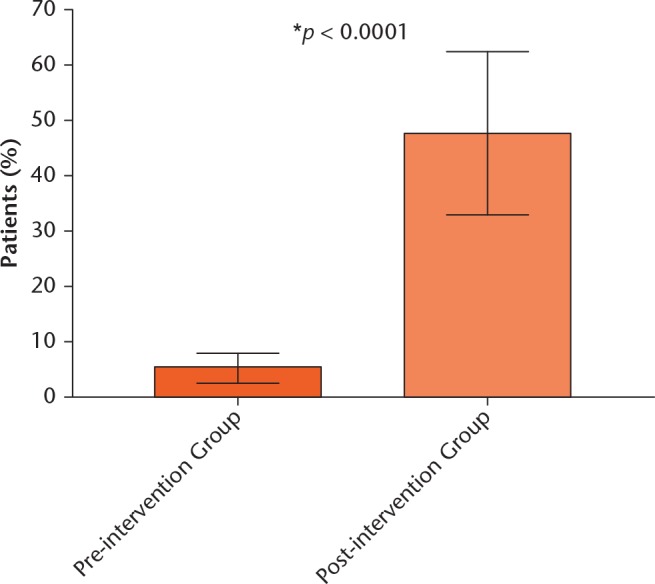
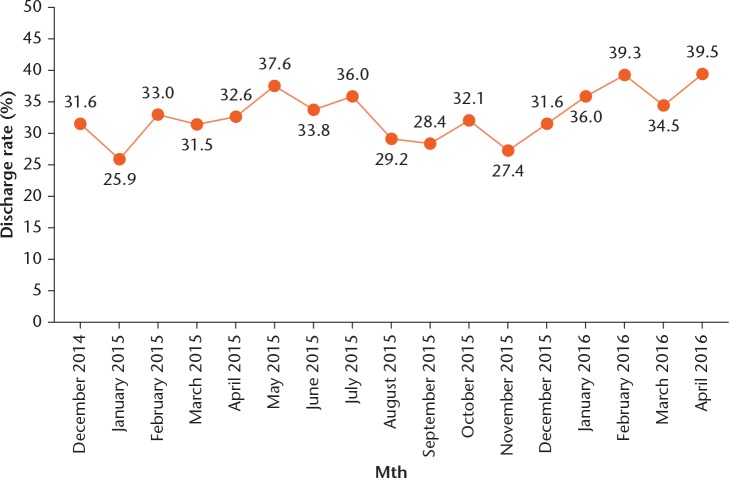
Results: There were statistically significant reductions in numbers of new patients seen face-to-face (140.4, sd 39.6 versus 461.6, sd 61.63, p < 0.0001), days to first orthopaedic review (5.2, sd 0.66 versus 10.9, sd 1.5, p < 0.0001), discharges (33.5, sd 3.66 versus 129.2, sd 7.36, p < 0.0001) and non-attendees (14.82, sd 1.48 versus 60.47, sd 2.68, p < 0.0001), in addition to a statistically significant increase in number of patients seen within 72-hours (46.4% 3873 of 8345 versus 5.1% 447 of 8771, p < 0.0001). There was a non-significant increase in consultation time of 1 minute 9 seconds (14 minutes 53 seconds sd 106 seconds versus 13 minutes 44 seconds sd 128 seconds, p = 0.0878). VFC saved the local CCG £67 385.67 in the first year and is set to save £129 885.67 annually thereafter.
Conclusions: We have shown VFCs are clinically and cost-effective, with improvement across several clinical performance parameters and substantial financial savings for CCGs. To our knowledge this is the largest study addressing clinical practice implications of VFCs in England, using robust methodology to adjust for pre-existing trends. Further studies are required to appreciate whether our results are reproducible with local variations in the VFC model and payment tariffs.Cite this article: A. McKirdy, A. M. Imbuldeniya. The clinical and cost effectiveness of a virtual fracture clinic service: An interrupted time series analysis and before-and-after comparison. Bone Joint Res 2017;6:-269. DOI: 10.1302/2046-3758.65.BJR-2017-0330.R1.
Keywords: Interrupted time-series; Orthopaedics; Virtual fracture clinic.
© 2017 McKirdy and Imbuldeniya.
Conflict of interest statement
ICMJE Conflicts of Interest: None declared.
Figures

References
-
- No authors listed. National Institute for Health and Clinical Excellence. Fractures (non-complex): assessment and management. https://www.nice.org.uk (date last accessed 23 February 2017).
-
- Baker C. Accident and Emergency Statistics. House of Commons briefing paper. July 2015. www.parliament.uk/briefing-papers/sn06964.pdf (date last accessed 23 February 2017).
-
- No authors listed. NHS England. A&E Attendances and Emergency Admissions. https://www.england.nhs.uk/statistics/statistical-work-areas/ae-waiting-... (date last accessed February 2017).
-
- No authors listed. The Kings Fund. What’s going on in A&E? http://www.kingsfund.org.uk/projects/urgent-emergency-care/urgent-and-em... (date last accessed February 2017).
-
- No authors listed. British Orthopaedic Association. BOAST 7 fracture clinic guidelines. https://www.boa.ac.uk/wp-content/uploads/2014/12/BOAST-7.pdf (date last accessed February 2017).
LinkOut - more resources
Full Text Sources
Other Literature Sources
Miscellaneous