African genomes illuminate the early history and transition to selfing in Arabidopsis thaliana
- PMID: 28473417
- PMCID: PMC5441814
- DOI: 10.1073/pnas.1616736114
African genomes illuminate the early history and transition to selfing in Arabidopsis thaliana
Abstract
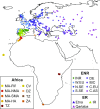
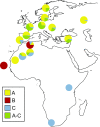
Over the past 20 y, many studies have examined the history of the plant ecological and molecular model, Arabidopsis thaliana, in Europe and North America. Although these studies informed us about the recent history of the species, the early history has remained elusive. In a large-scale genomic analysis of African A. thaliana, we sequenced the genomes of 78 modern and herbarium samples from Africa and analyzed these together with over 1,000 previously sequenced Eurasian samples. In striking contrast to expectations, we find that all African individuals sampled are native to this continent, including those from sub-Saharan Africa. Moreover, we show that Africa harbors the greatest variation and represents the deepest history in the A. thaliana lineage. Our results also reveal evidence that selfing, a major defining characteristic of the species, evolved in a single geographic region, best represented today within Africa. Demographic inference supports a model in which the ancestral A. thaliana population began to split by 120-90 kya, during the last interglacial and Abbassia pluvial, and Eurasian populations subsequently separated from one another at around 40 kya. This bears striking similarities to the patterns observed for diverse species, including humans, implying a key role for climatic events during interglacial and pluvial periods in shaping the histories and current distributions of a wide range of species.
Keywords: climate; evolution; migration; population history; self-compatibility.
Conflict of interest statement
The authors declare no conflict of interest.
Figures


Comment in
-
Arabidopsis evolution: Roots in Africa.Nat Plants. 2017 Jun 5;3:17091. doi: 10.1038/nplants.2017.91. Nat Plants. 2017. PMID: 28581506 No abstract available.
References
-
- Provart NJ, et al. 50 years of Arabidopsis research: Highlights and future directions. New Phytol. 2016;209:921–944. - PubMed
-
- Somerville C, Koornneef M. A fortunate choice: The history of Arabidopsis as a model plant. Nat Rev Genet. 2002;3:883–889. - PubMed
-
- Beck JB, Schmuths H, Schaal BA. Native range genetic variation in Arabidopsis thaliana is strongly geographically structured and reflects Pleistocene glacial dynamics. Mol Ecol. 2008;17:902–915. - PubMed
Publication types
MeSH terms
Grants and funding
LinkOut - more resources
Full Text Sources
Other Literature Sources
Miscellaneous

