

Zika virus induces massive cytoplasmic vacuolization and paraptosis-like death in infected cells
- PMID: 28473450
- PMCID: PMC5470047
- DOI: 10.15252/embj.201695597
Zika virus induces massive cytoplasmic vacuolization and paraptosis-like death in infected cells
Abstract
The cytopathic effects of Zika virus (ZIKV) are poorly characterized. Innate immunity controls ZIKV infection and disease in most infected patients through mechanisms that remain to be understood. Here, we studied the morphological cellular changes induced by ZIKV and addressed the role of interferon-induced transmembrane proteins (IFITM), a family of broad-spectrum antiviral factors, during viral replication. We report that ZIKV induces massive vacuolization followed by "implosive" cell death in human epithelial cells, primary skin fibroblasts and astrocytes, a phenomenon which is exacerbated when IFITM3 levels are low. It is reminiscent of paraptosis, a caspase-independent, non-apoptotic form of cell death associated with the formation of large cytoplasmic vacuoles. We further show that ZIKV-induced vacuoles are derived from the endoplasmic reticulum (ER) and dependent on the PI3K/Akt signaling axis. Inhibiting the Sec61 ER translocon in ZIKV-infected cells blocked vacuole formation and viral production. Our results provide mechanistic insight behind the ZIKV-induced cytopathic effect and indicate that IFITM3, by acting as a gatekeeper for incoming virus, restricts virus takeover of the ER and subsequent cell death.
Keywords: IFITM; ZIKA virus; cell death; cytopathic effect; paraptosis.
© 2017 Institut Pasteur.
Figures
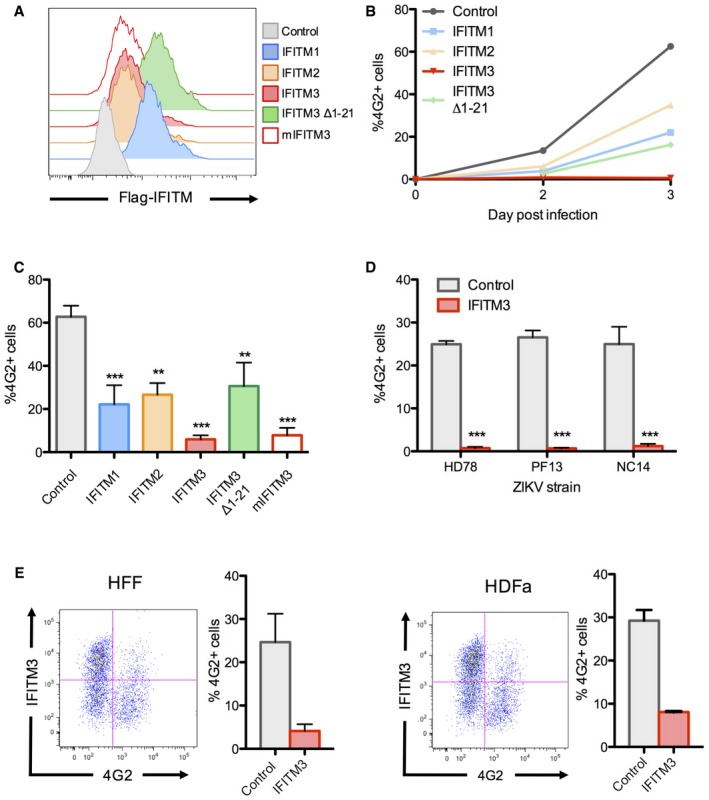
Stable IFITM‐positive cell lines were produced in 293T cells, and the expression of each protein was measured by flow cytometry.
293T cells were infected with ZIKV HD78 (MOI 1), and viral replication was measured at days 2 and 3 post‐infection (pi) by flow cytometry using the anti‐E protein antibody 4G2, as illustrated in one representative experiment.
Results from four independent experiments as in (B) were quantified at day 3 pi. Mean ± SEM.
293T cells expressing or not IFITM3 were infected with the indicated ZIKV strains. Viral replication was measured at day 2 or 3 post‐infection (pi) by flow cytometry using the anti‐E protein antibody 4G2. Results are mean ± SEM of three independent experiments.
Human foreskin fibroblasts (HFF) (left panels) or human adult dermal fibroblasts (HDFa) (right panels) overexpressing or not IFITM3 were infected with ZIKV, and the % of E‐positive cells was measured by flow cytometry at day 2 pi. For each cell type, one representative experiment is shown on the left and the mean ± SEM of three independent experiments on the right.
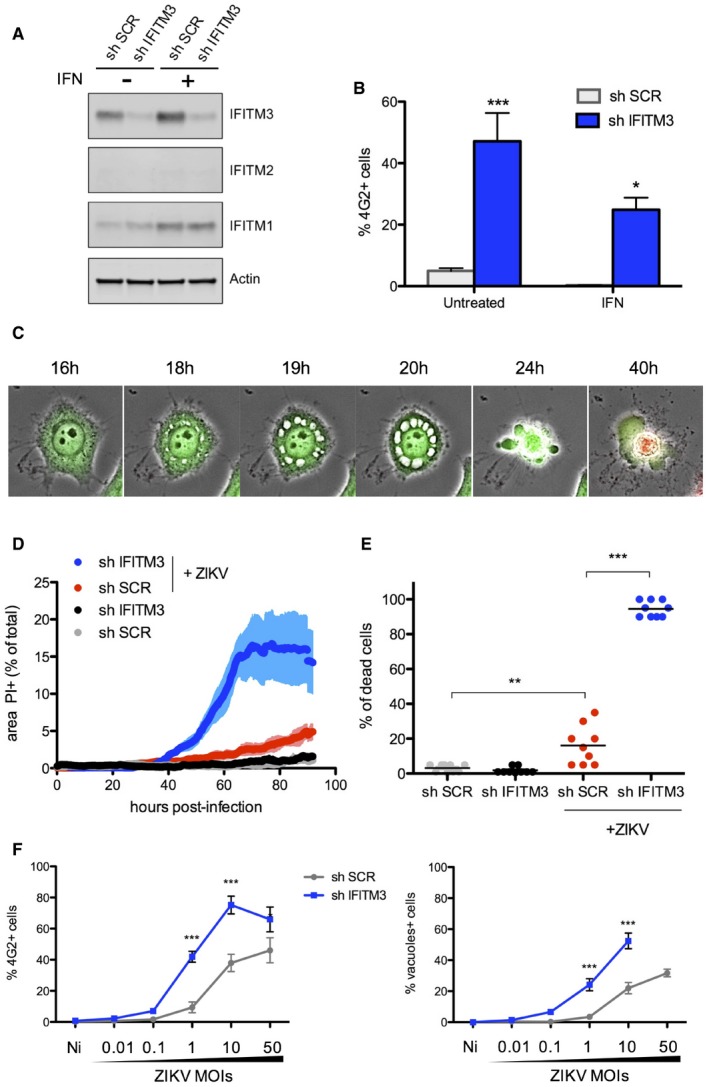
HeLa cells were transduced to stably express a control scrambled shRNA (sh‐SCR) or shRNA targeting IFITM3 (sh‐IFITM3). The level of endogenous IFITMs in the presence or absence of IFN‐α (1,000 IU/ml for 48 h) was assessed by Western blot.
HeLa sh‐SCR or sh‐IFITM3 treated or not with IFN‐α were infected with ZIKV HD78 (MOI 1), and the % of E‐positive cells was determined by flow cytometry at day 2 pi. Mean ± SEM of three independent experiments.
HeLa sh‐SCR or sh‐IFITM3 cells were infected with ZIKV (MOI 1) for 2–4 days in the presence of propidium iodide (PI) for time‐lapse microscopy. The cells also expressed GFP to facilitate visualization of the cytoplasm and the vacuoles. Still images were extracted from Movie EV1 (from HeLa sh‐IFITM3 infected cells) at the indicated time points.
The area of the PI+ signal was quantified for each condition. Nine fields from three independent experiments were analyzed and plotted as mean ± SEM. Movie EV3 is a representative example of data used for quantification.
The % of dead cells from 9 fields was visually scored at day 3 pi and plotted as mean.
ZIKV E expression determined by flow cytometry and the proportion of cells displaying vacuoles was scored by visual examination of at least 200 cells at 24 h pi in HeLa sh‐SCR or sh‐IFITM3 cells infected with the indicated MOIs. Mean ± SEM of three independent experiments is shown.
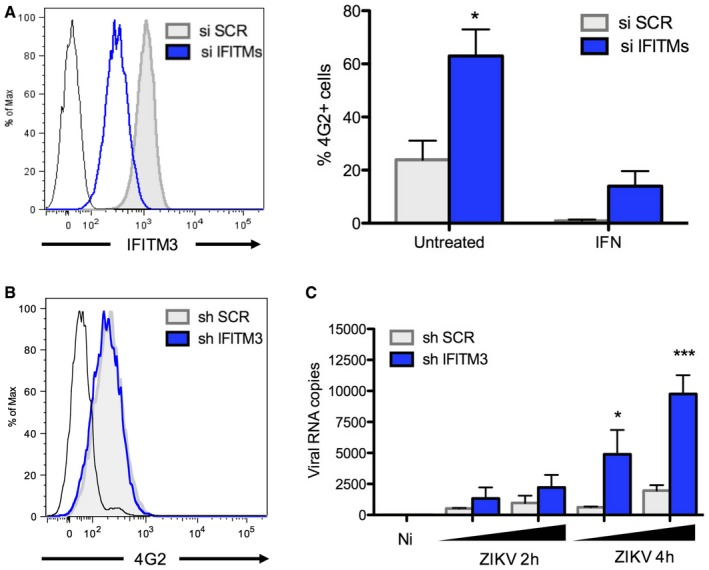
Effect of IFITM3 in HDFa cells. Left panel: The levels of endogenous IFITM3 were assessed by flow cytometry in HDFa transfected with a control siRNA or siRNA targeting IFITM3. Black curve: isotype control. Right panel: The cells were pretreated or not with IFN‐α (1,000 IU/ml for 48 h) and infected with ZIKV HD78 (MOI 1) for 24 h. Infected cells were scored by 4G2 staining and flow cytometry (right panel). Mean ± SEM from three independent experiments is shown.
IFITM3 does not affect virus attachment to target cells. HeLa sh‐SCR or sh‐IFITM3 were incubated with ZIKV for 1 h at 4°C. The mean fluorescence intensity (MFI) of 4G2 staining was determined by flow cytometry. Black curve: isotype control.
IFITM3 prevents intracellular accumulation of viral RNA. HeLa sh‐SCR or sh‐IFITM3 were infected with ZIKV for 2 or 4 h at 37°C. The black triangle indicates increasing amounts of virus (MOI 3 and 10). Virus remaining at the cell surface was removed by trypsin treatment. The cellular RNA was extracted, and RT‐qPCR was performed to quantify viral RNA. Mean ± SEM of three independent experiments.
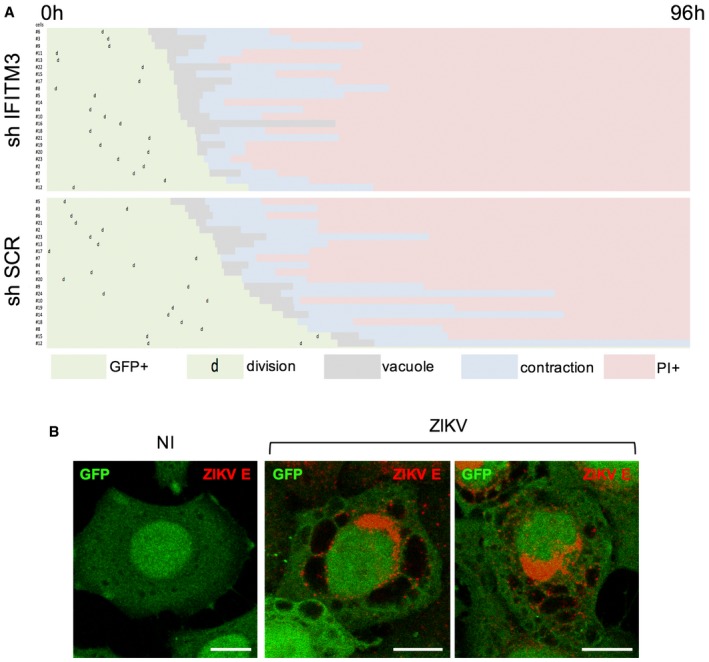
Time‐lapse analysis of the morphological changes observed in ZIKV‐infected cells. HeLa sh‐SCR and HeLa sh‐IFITM3 cells were infected with ZIKV HD78 (MOI 1) and recorded using time‐lapse microscopy. For each condition, about 20 individual cells that end up dying upon ZIKV infection were selected for further analysis. Morphological changes were visually scored for each cell. Results are representative of three independent experiments.
HeLa sh‐SCR cells were infected or not with ZIKV HD78 (MOI 1) for 24 h, fixed, and stained to detect ZIKV E protein (red). One single Z slice representative of three independent experiments is shown. Scale bars: 5 μm.
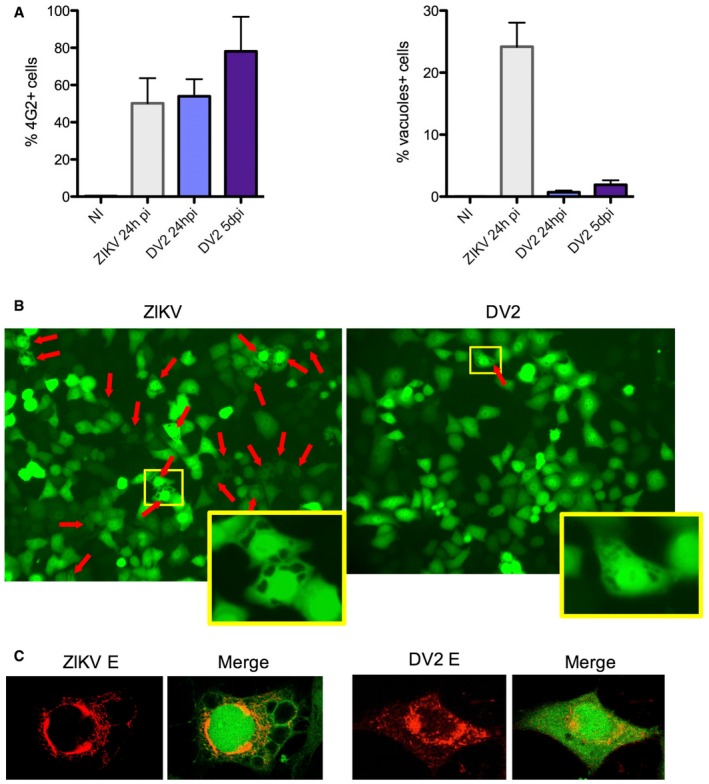
HeLa sh‐IFITM3 were infected with ZIKV HD78 or DV2 for 24 h or 5 days pi. Left panel: The levels of infection were determined by 4G2 staining and flow cytometry. Right panel: The proportion of cells displaying vacuoles was scored by visual examination of at least 200 cells at 24 h pi (right panel). Mean ± SEM of three independent experiments.
One example of a representative field from (A) is shown for ZIKV (left) and DENV2 (right) infected cells at 24 h pi. Red arrows point to vacuole+ cells. For each condition, an enlarged view of a vacuolated cell is shown.
Examples of ZIKV‐ and DENV‐infected cells, with 4G2 staining and confocal microscopy analysis.
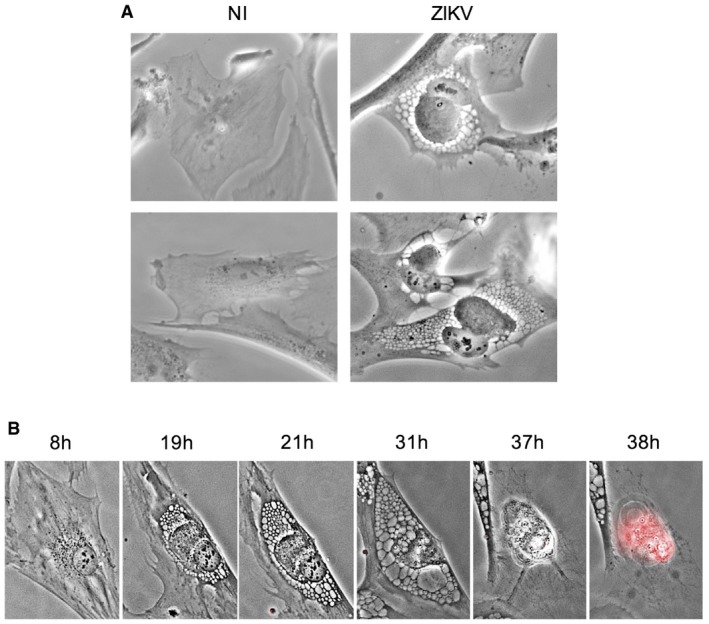
Primary human astrocytes were infected with ZIKV HD78 (MOI 1) and observed 24 h pi. Non‐infected (NI) astrocytes are shown as control. Images were taken with a bright‐field objective. Representative panels from three independent experiments are shown.
Primary adult human dermal fibroblasts (HDFa) were infected ZIKV HD78 (MOI 1) for 2–4 days in the presence of propidium iodide (PI) for time‐lapse microscopy. Still images were extracted from Movie EV4 at the indicated time points.
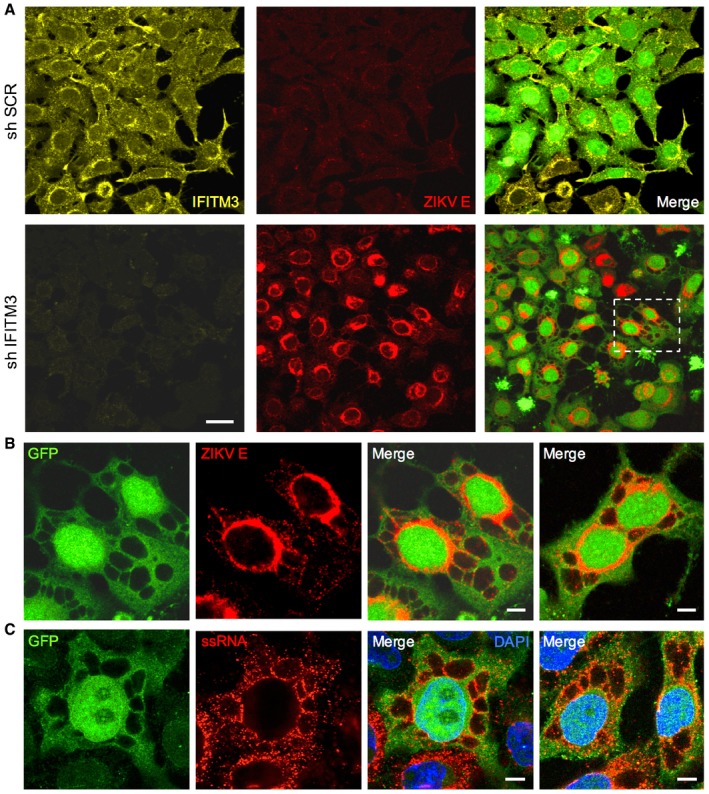
HeLa sh‐SCR or sh‐IFITM3 cells were infected with ZIKV HD78 (MOI 1) for 24 h, fixed, and stained to detect E (red) and IFITM3 (yellow) proteins. The cells also expressed GFP to facilitate visualization of the cytoplasm and the vacuoles. One field representative of three independent experiments is shown.
Detail of ZIKV‐infected cell in (A) showing large vacuoles and 4G2 staining (red). Images are average Z‐stacks of three consecutive slices. An additional example from a different field is also shown in the right panel.
HeLa sh‐IFITM3 cells were infected with ZIKV HD78 (MOI 10) for 24 h, fixed, and subjected to FISH for the detection of viral ssRNA. Two examples from two fields are shown. A single Z slice is shown.
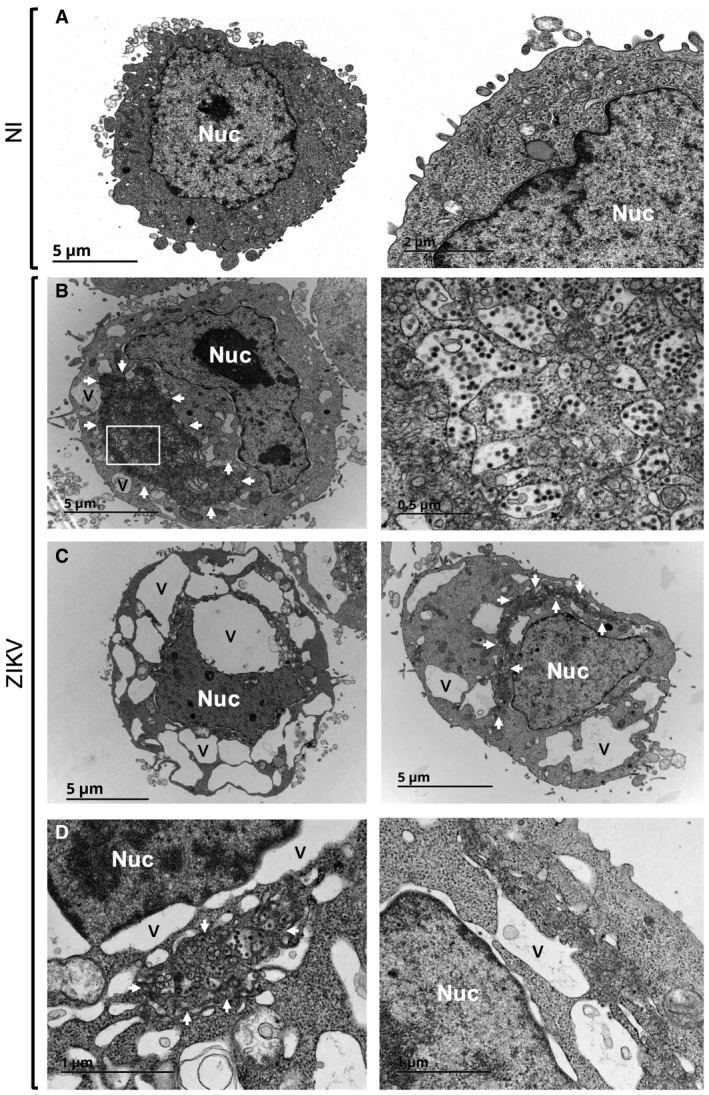
Transmission electron microscopy (TEM) of non‐infected HeLa sh‐IFITM3 cells.
TEM of ZIKV‐infected HeLa sh‐IFITM3 cells at 24 h pi displays cytoplasmic vacuolization (indicated with the letter V) and active virion production (enlarged on the right).
Examples of ZIKV‐infected cells exhibiting large vacuoles.
Enlarged views of dilated nuclear membranes in ZIKV‐infected cells.
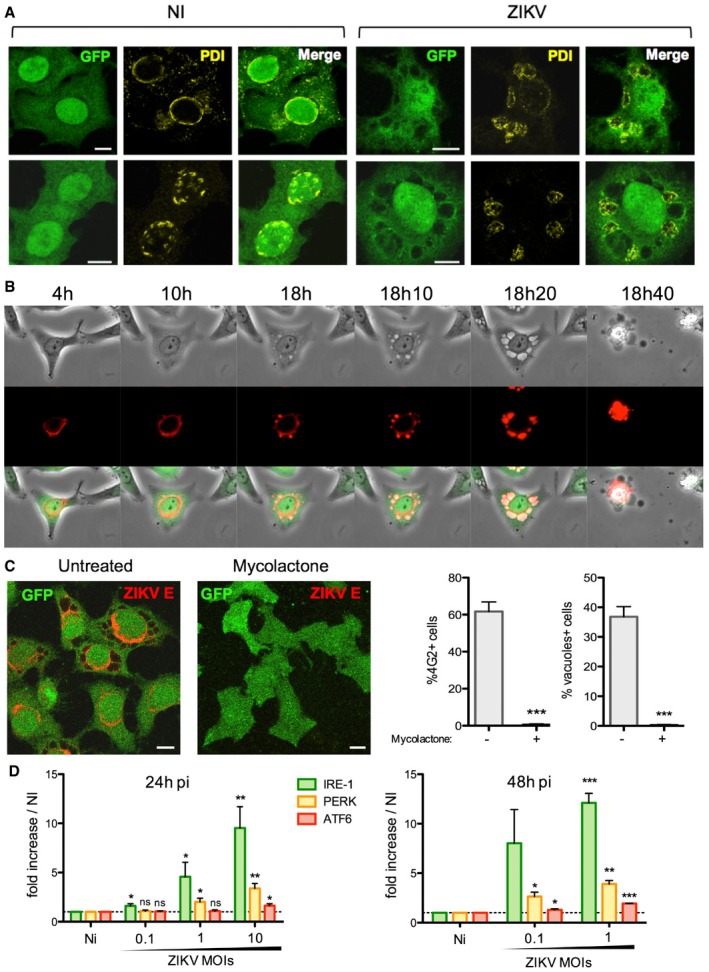
HeLa sh‐IFITM3 cells were infected with ZIKV HD78 (MOI 1) for 24 h, fixed, and stained for protein disulfide isomerase (PDI) (yellow). Two representative cells for each condition over three independent experiments are shown. Images are average Z‐stacks of three consecutive slices. Scale bars, 10 μm.
HeLa sh‐IFITM3 cells stably expressing a fluorescent ER‐tracker (DsRed2‐ER) shown in red were infected with ZIKV HD78 (MOI 1) for 2 days for time‐lapse microscopy. Still images were extracted from Movie EV5 at the indicated time points.
HeLa sh‐IFITM3 were infected with ZIKV HD78 (MOI 0.1 or 1) for 2 h and then treated with or without mycolactone (20 nM), an inhibitor of the Sec61 translocon. After 24 h, cells were stained for viral E protein and analyzed by confocal microscopy (left panels). ZIKV E expression was determined by flow cytometry, and the proportion of cells displaying vacuoles was scored by visual examination of at least 200 cells (right). Results are mean ± SEM of three independent experiments. Statistical significance was determined by unpaired t‐tests. ***P < 0.001. Scale bars, 10 μm.
ZIKV‐induced ER stress. Levels of IRE‐I, PERK, and ATF6 mRNA were determined by RT–PCR at 24 and 48 h pi. Results are mean ± SEM for three independent experiments. Statistical significance was determined by unpaired t‐tests. ***P < 0.001; **P < 0.01; *P < 0.05; ns, P > 0.05.
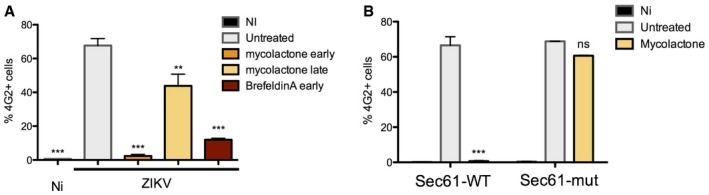
HeLa sh‐IFITM3 were infected with ZIKV HD 78 (MOI 1) for 24 h in the presence or absence of mycolactone (20 nM) added at 2 h (mycolactone early) or 15 h pi (mycolactone late). Brefeldin A (0.5 μg/ml) was added during the 24 h of infection. The levels of infection were determined by 4G2 staining and flow cytometry. Results are mean ± SEM of three independent infections.
293T cells expressing WT Sec61 or a mutated Sec61 resistant to mycolactone (Sec61‐mut) were infected with ZIKV HD 78 (MOI 1) for 3 days in the presence or absence of mycolactone (20 nM). The levels of infection were determined by 4G2 staining and flow cytometry. Results are mean ± SEM of three independent infections.
- A
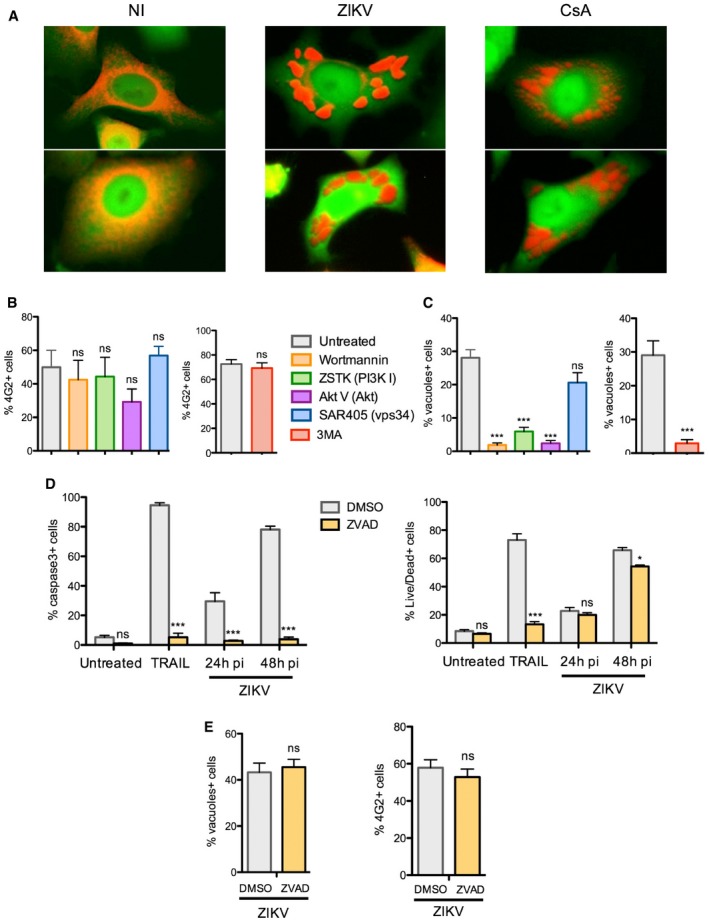
Comparison of large cytoplasmic vacuoles induced by ZIKV or cyclosporine A. HeLa sh‐IFITM3 expressing the fluorescent ER‐tracker were infected with ZIKV HD 78 (MOI 1) or treated with cyclosporin A (10 μM) for 2 days and analyzed by time‐lapse microscopy. Two representative still images for each condition are shown.
- B, C
HeLa sh‐IFITM3 were infected with ZIKV HD 78 (MOI 1) for 24 h in the presence or absence of the pan PI3K inhibitor Wortmannin, the class 1‐specific PI3K inhibitor ZSTK474 (1 μM), the Akt inhibitor Triciribine (Akt V) (20 μM), the class 3‐specific PI3K (vps34) inhibitor SAR405 (1 μM), or the pan‐PI3K inhibitor 3MA (5 mM). (B) The percentage of E+ cells was quantified with 4G2 staining and flow cytometry. (C) In parallel, the proportion of cells displaying vacuoles was scored by visual examination of at least 200 cells. Results are mean ± SEM for three independent experiments. Statistical significance was determined using unpaired t‐tests. ***P < 0.001; ns, P > 0.05.
- D, E
HeLa sh‐IFITM3 were infected with ZIKV HD 78 (MOI 1) for 24 or 48 h in the presence or absence of the pan‐caspase inhibitor ZVAD‐FMK. (D) The percentage of cells expressing activated caspase‐3 (left panel) and the percentage of dying cells quantified with live/dead staining (right panel) were measured by flow cytometry. The apoptosis inducer TRAIL was used as a control. (E) The percentage of E+ cells was quantified with 4G2 staining and flow cytometry (left panel). In parallel, the proportion of cells displaying vacuoles was scored by visual examination of at least 200 cells (right panel). Results are mean ± SEM for three independent experiments. Statistical significance was determined using ANOVA and Bonferroni post‐tests (D) or unpaired t‐tests (E).***P < 0.001; *P < 0.05; ns, P > 0.05.
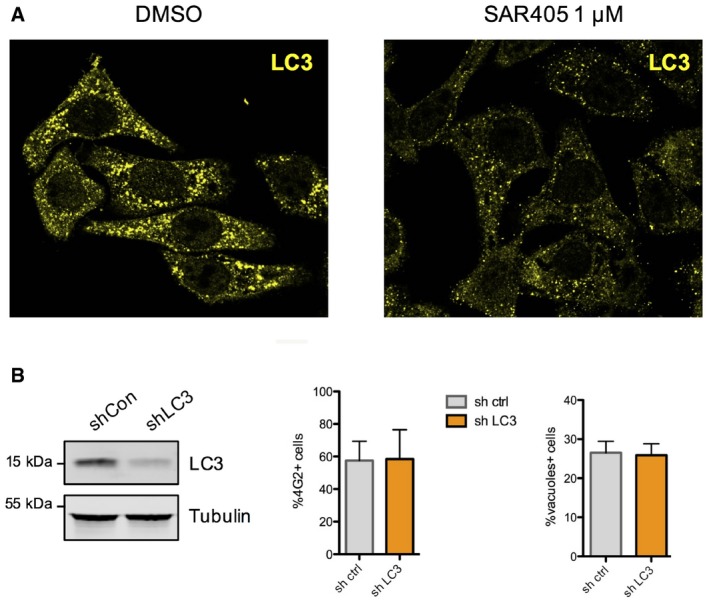
The class 1 PI3K inhibitor blocks autophagy assessed by LC3 clustering in HeLa sh‐IFITM3 treated with rapamycin (5 mM) and concanamycin A (1 μM), which prevents fusion of phagosomes with lysosomes.
HeLa cells expressing a shRNA control or a shRNA targeting LC3 were infected with ZIKV HD78 (moi 1) for 24 h, and the % of E+ cells as well as the % of vacuole‐containing cells were quantified by flow cytometry and microscopy, respectively. The efficiency of silencing was assessed by Western blot (left panel). Results are shown as mean ± SEM from three independent experiments.
Similar articles
-
Atlastin Endoplasmic Reticulum-Shaping Proteins Facilitate Zika Virus Replication.J Virol. 2019 Nov 13;93(23):e01047-19. doi: 10.1128/JVI.01047-19. Print 2019 Dec 1. J Virol. 2019. PMID: 31534046 Free PMC article.
-
Endoplasmic reticulum: a focal point of Zika virus infection.J Biomed Sci. 2020 Jan 20;27(1):27. doi: 10.1186/s12929-020-0618-6. J Biomed Sci. 2020. PMID: 31959174 Free PMC article. Review.
-
Differentiation-dependent susceptibility of human muscle cells to Zika virus infection.PLoS Negl Trop Dis. 2020 Aug 20;14(8):e0008282. doi: 10.1371/journal.pntd.0008282. eCollection 2020 Aug. PLoS Negl Trop Dis. 2020. PMID: 32817655 Free PMC article.
-
Toll-like receptor 3 regulates Zika virus infection and associated host inflammatory response in primary human astrocytes.PLoS One. 2019 Feb 8;14(2):e0208543. doi: 10.1371/journal.pone.0208543. eCollection 2019. PLoS One. 2019. PMID: 30735502 Free PMC article.
-
Apoptosis during ZIKA Virus Infection: Too Soon or Too Late?Int J Mol Sci. 2022 Jan 24;23(3):1287. doi: 10.3390/ijms23031287. Int J Mol Sci. 2022. PMID: 35163212 Free PMC article. Review.
Cited by
-
Ablation of the endoplasmic reticulum stress kinase PERK induces paraptosis and type I interferon to promote anti-tumor T cell responses.Cancer Cell. 2022 Oct 10;40(10):1145-1160.e9. doi: 10.1016/j.ccell.2022.08.016. Epub 2022 Sep 22. Cancer Cell. 2022. PMID: 36150390 Free PMC article.
-
Novel Therapeutic Nutrients Molecules That Protect against Zika Virus Infection with a Special Note on Palmitoleate.Nutrients. 2022 Dec 27;15(1):124. doi: 10.3390/nu15010124. Nutrients. 2022. PMID: 36615782 Free PMC article. Review.
-
Global Interactomics Uncovers Extensive Organellar Targeting by Zika Virus.Mol Cell Proteomics. 2018 Nov;17(11):2242-2255. doi: 10.1074/mcp.TIR118.000800. Epub 2018 Jul 23. Mol Cell Proteomics. 2018. PMID: 30037810 Free PMC article.
-
Zika virus induces strong inflammatory responses and impairs homeostasis and function of the human retinal pigment epithelium.EBioMedicine. 2019 Jan;39:315-331. doi: 10.1016/j.ebiom.2018.12.010. Epub 2018 Dec 20. EBioMedicine. 2019. PMID: 30579862 Free PMC article.
-
Viral-mediated activation and inhibition of programmed cell death.PLoS Pathog. 2022 Aug 11;18(8):e1010718. doi: 10.1371/journal.ppat.1010718. eCollection 2022 Aug. PLoS Pathog. 2022. PMID: 35951530 Free PMC article. Review.
References
-
- Barba‐Spaeth G, Dejnirattisai W, Rouvinski A, Vaney MC, Medits I, Sharma A, Simon‐Loriere E, Sakuntabhai A, Cao‐Lormeau VM, Haouz A, England P, Stiasny K, Mongkolsapaya J, Heinz FX, Screaton GR, Rey FA (2016) Structural basis of potent Zika‐dengue virus antibody cross‐neutralization. Nature 536: 48–53 - PubMed
Publication types
MeSH terms
Substances
LinkOut - more resources
Full Text Sources
Other Literature Sources
Medical
