

An unexpected role for the transcriptional coactivator isoform NT-PGC-1α in the regulation of mitochondrial respiration in brown adipocytes
- PMID: 28473468
- PMCID: PMC5473247
- DOI: 10.1074/jbc.M117.778373
An unexpected role for the transcriptional coactivator isoform NT-PGC-1α in the regulation of mitochondrial respiration in brown adipocytes
Abstract
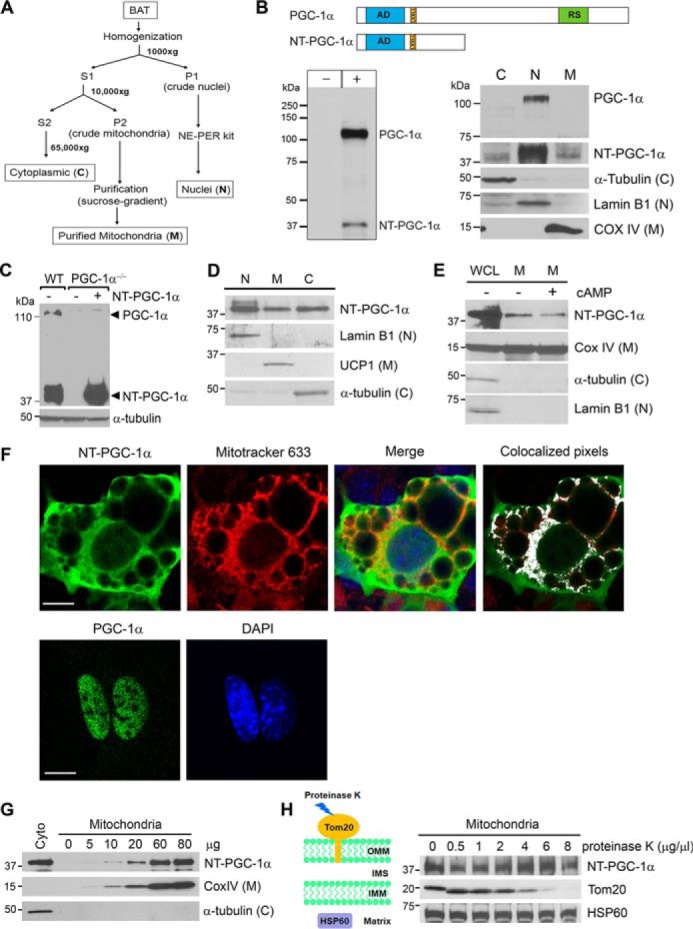
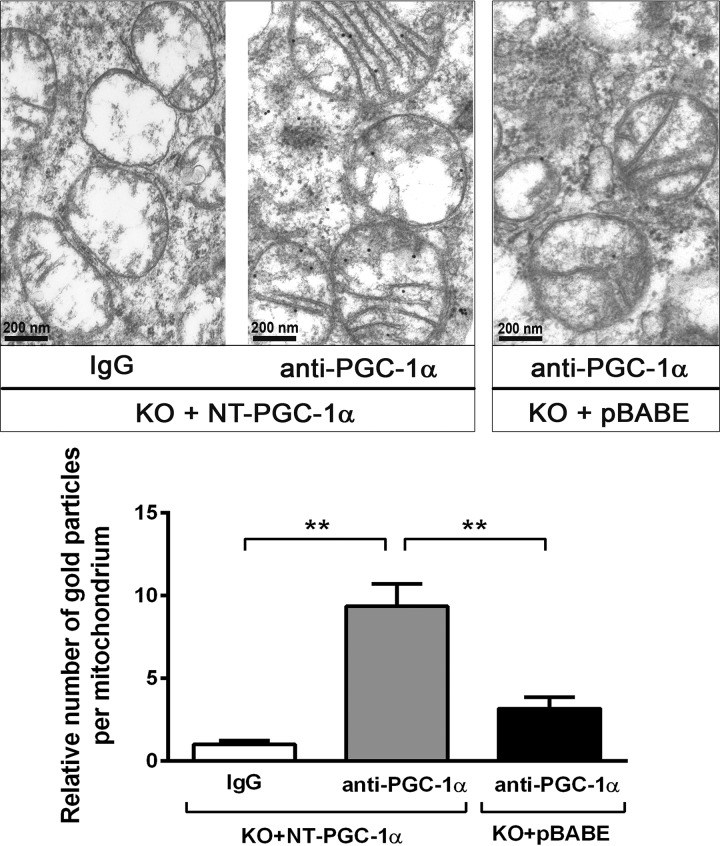
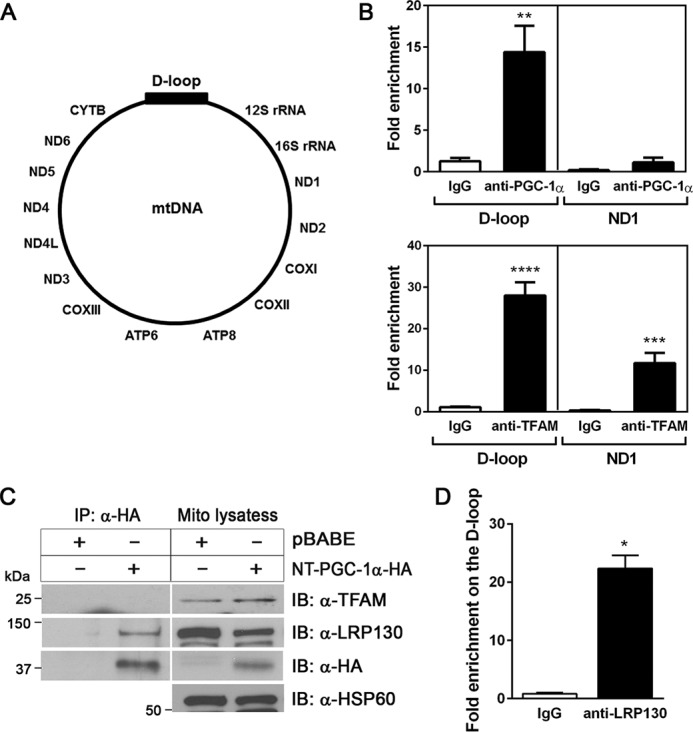
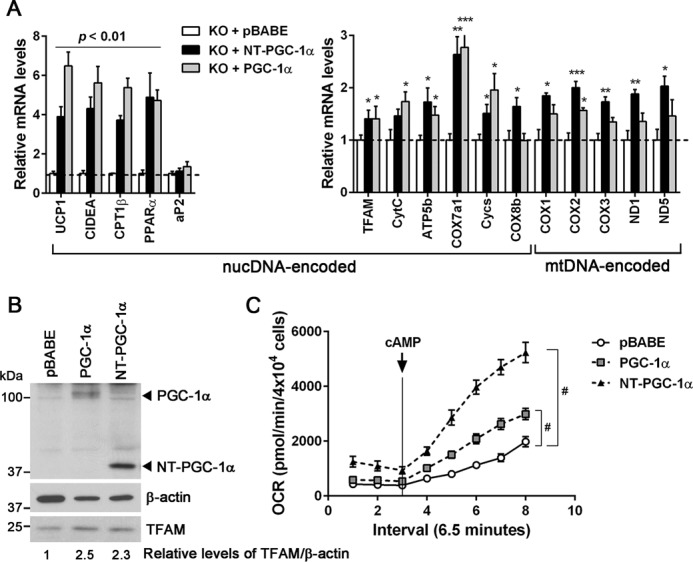
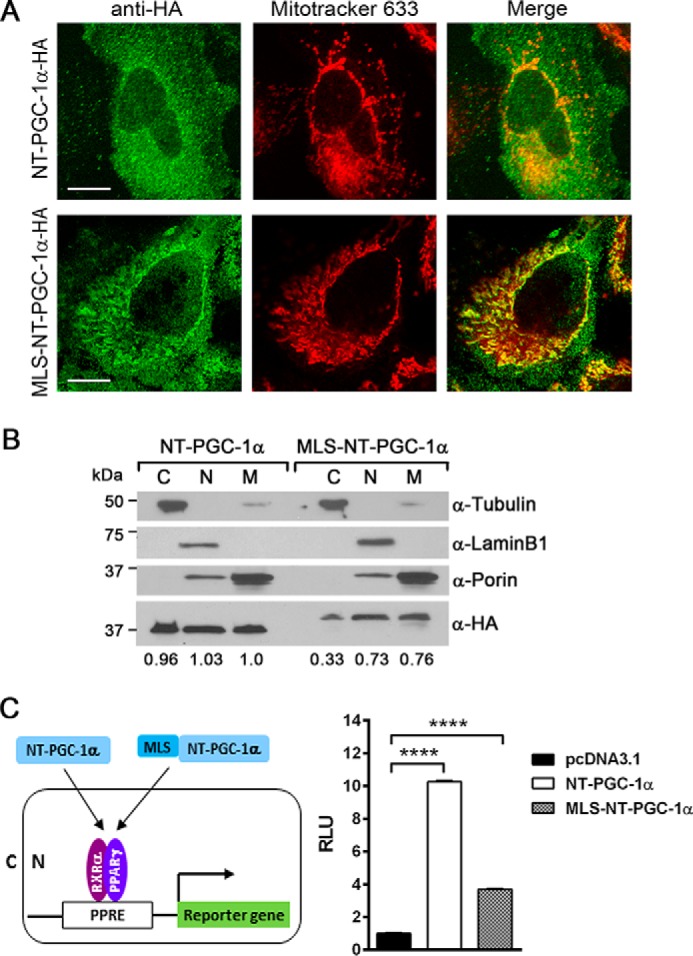
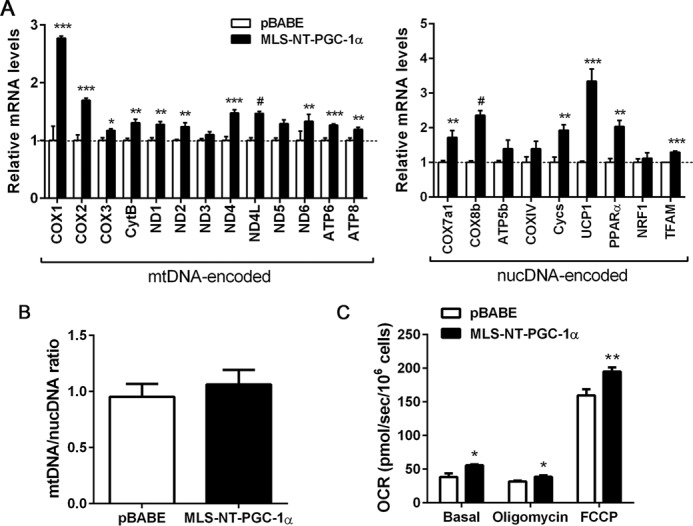
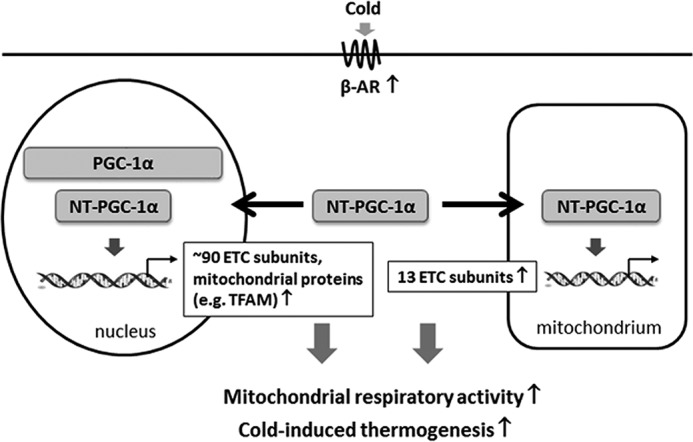
Brown adipose tissue dissipates energy as heat, a process that relies on a high abundance of mitochondria and high levels of electron transport chain (ETC) complexes within these mitochondria. Two regulators of mitochondrial respiration and heat production in brown adipocytes are the transcriptional coactivator PGC-1α and its splicing isoform NT-PGC-1α, which control mitochondrial gene expression in the nucleus. Surprisingly, we found that, in brown adipocytes, some NT-PGC-1α localizes to mitochondria, whereas PGC-1α resides in the nucleus. Here we sought to investigate the role of NT-PGC-1α in brown adipocyte mitochondria. Immunocytochemistry, immunotransmission electron microscopy, and biochemical analyses indicated that NT-PGC-1α was located in the mitochondrial matrix in brown adipocytes. NT-PGC-1α was specifically enriched at the D-loop region of the mtDNA, which contains the promoters for several essential ETC complex genes, and was associated with LRP130, an activator of mitochondrial transcription. Selective expression of NT-PGC-1α and PGC-1α in PGC-1α-/- brown adipocytes similarly induced expression of nuclear DNA-encoded mitochondrial ETC genes, including the key mitochondrial transcription factor A (TFAM). Despite having comparable levels of TFAM expression, PGC-1α-/- brown adipocytes expressing NT-PGC-1α had higher expression of mtDNA-encoded ETC genes than PGC-1α-/- brown adipocytes expressing PGC-1α, suggesting a direct effect of NT-PGC-1α on mtDNA transcription. Moreover, this increase in mtDNA-encoded ETC gene expression was associated with enhanced respiration in NT-PGC-1α-expressing PGC-1α-/- brown adipocytes. Our findings reveal a previously unappreciated and isoform-specific role for NT-PGC-1α in the regulation of mitochondrial transcription in brown adipocytes and provide new insight into the transcriptional control of mitochondrial respiration.
Keywords: adipocyte; adipose tissue metabolism; gene expression; mitochondrial respiratory chain complex; mtDNA; peroxisome proliferator-activated receptor γ coactivator 1α (PGC-1α).
© 2017 by The American Society for Biochemistry and Molecular Biology, Inc.
Conflict of interest statement
The authors declare that they have no conflicts of interest with the contents of this article
Figures
Similar articles
-
Regulation of Brown and White Adipocyte Transcriptome by the Transcriptional Coactivator NT-PGC-1α.PLoS One. 2016 Jul 25;11(7):e0159990. doi: 10.1371/journal.pone.0159990. eCollection 2016. PLoS One. 2016. PMID: 27454177 Free PMC article.
-
A truncated PPAR gamma 2 localizes to mitochondria and regulates mitochondrial respiration in brown adipocytes.PLoS One. 2018 Mar 22;13(3):e0195007. doi: 10.1371/journal.pone.0195007. eCollection 2018. PLoS One. 2018. PMID: 29566074 Free PMC article.
-
The diabetes medication canagliflozin promotes mitochondrial remodelling of adipocyte via the AMPK-Sirt1-Pgc-1α signalling pathway.Adipocyte. 2020 Dec;9(1):484-494. doi: 10.1080/21623945.2020.1807850. Adipocyte. 2020. PMID: 32835596 Free PMC article.
-
Contribution of PGC-1α to Obesity- and Caloric Restriction-Related Physiological Changes in White Adipose Tissue.Int J Mol Sci. 2021 Jun 2;22(11):6025. doi: 10.3390/ijms22116025. Int J Mol Sci. 2021. PMID: 34199596 Free PMC article. Review.
-
Role of mitochondria in diabetic peripheral neuropathy: Influencing the NAD+-dependent SIRT1-PGC-1α-TFAM pathway.Int Rev Neurobiol. 2019;145:177-209. doi: 10.1016/bs.irn.2019.04.002. Epub 2019 Jun 8. Int Rev Neurobiol. 2019. PMID: 31208524 Free PMC article. Review.
Cited by
-
N‑terminal truncated peroxisome proliferator‑activated receptor‑γ coactivator‑1α alleviates phenylephrine‑induced mitochondrial dysfunction and decreases lipid droplet accumulation in neonatal rat cardiomyocytes.Mol Med Rep. 2018 Aug;18(2):2142-2152. doi: 10.3892/mmr.2018.9158. Epub 2018 Jun 14. Mol Med Rep. 2018. PMID: 29901150 Free PMC article.
-
Peroxisome proliferator-activated receptor gamma coactivator-1 (PGC-1) family in physiological and pathophysiological process and diseases.Signal Transduct Target Ther. 2024 Mar 1;9(1):50. doi: 10.1038/s41392-024-01756-w. Signal Transduct Target Ther. 2024. PMID: 38424050 Free PMC article. Review.
-
A CRM1 Inhibitor Alleviates Cardiac Hypertrophy and Increases the Nuclear Distribution of NT-PGC-1α in NRVMs.Front Pharmacol. 2019 May 7;10:465. doi: 10.3389/fphar.2019.00465. eCollection 2019. Front Pharmacol. 2019. PMID: 31133853 Free PMC article.
-
Alternative splicing isoforms in health and disease.Pflugers Arch. 2018 Jul;470(7):995-1016. doi: 10.1007/s00424-018-2136-x. Epub 2018 Mar 13. Pflugers Arch. 2018. PMID: 29536164 Review.
-
NT-PGC-1α deficiency attenuates high-fat diet-induced obesity by modulating food intake, fecal fat excretion and intestinal fat absorption.Sci Rep. 2021 Jan 14;11(1):1323. doi: 10.1038/s41598-020-79823-9. Sci Rep. 2021. PMID: 33446719 Free PMC article.
References
-
- Wu Z., Puigserver P., Andersson U., Zhang C., Adelmant G., Mootha V., Troy A., Cinti S., Lowell B., Scarpulla R. C., and Spiegelman B. M. (1999) Mechanisms controlling mitochondrial biogenesis and respiration through the thermogenic coactivator PGC-1. Cell 98, 115–124 - PubMed
-
- Lowell B. B., and Spiegelman B. M. (2000) Towards a molecular understanding of adaptive thermogenesis. Nature 404, 652–660 - PubMed
-
- Puigserver P., Wu Z., Park C. W., Graves R., Wright M., and Spiegelman B. M. (1998) A cold-inducible coactivator of nuclear receptors linked to adaptive thermogenesis. Cell 92, 829–839 - PubMed
-
- Anderson S., Bankier A. T., Barrell B. G., de Bruijn M. H., Coulson A. R., Drouin J., Eperon I. C., Nierlich D. P., Roe B. A., Sanger F., Schreier P. H., Smith A. J., Staden R., and Young I. G. (1981) Sequence and organization of the human mitochondrial genome. Nature 290, 457–465 - PubMed
-
- Chomyn A., Mariottini P., Cleeter M. W., Ragan C. I., Matsuno-Yagi A., Hatefi Y., Doolittle R. F., and Attardi G. (1985) Six unidentified reading frames of human mitochondrial DNA encode components of the respiratory-chain NADH dehydrogenase. Nature 314, 592–597 - PubMed
MeSH terms
Substances
Grants and funding
LinkOut - more resources
Full Text Sources
Other Literature Sources
Molecular Biology Databases
Research Materials
