. 2017 Aug;7(8):900-917.
doi: 10.1158/2159-8290.CD-17-0292. Epub 2017 May 4.

Modeling Renal Cell Carcinoma in Mice: Bap1 and Pbrm1 Inactivation Drive Tumor Grade

Affiliations

Modeling Renal Cell Carcinoma in Mice: Bap1 and Pbrm1 Inactivation Drive Tumor Grade

Yi-Feng Gu et al. Cancer Discov. 2017 Aug.

Abstract

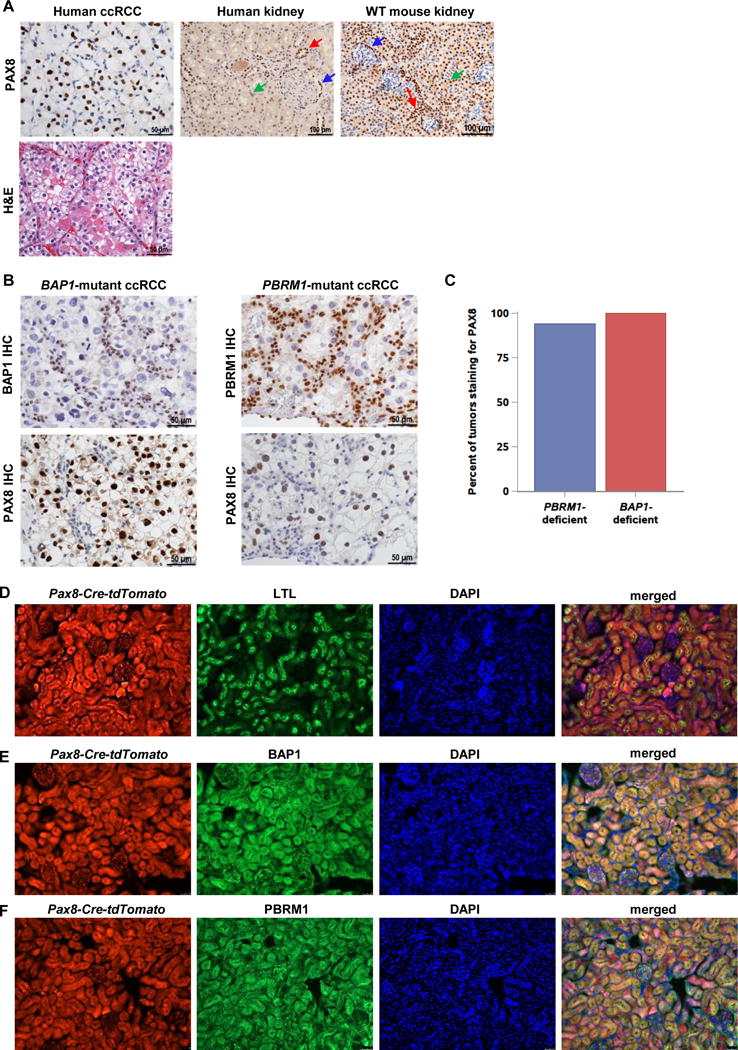
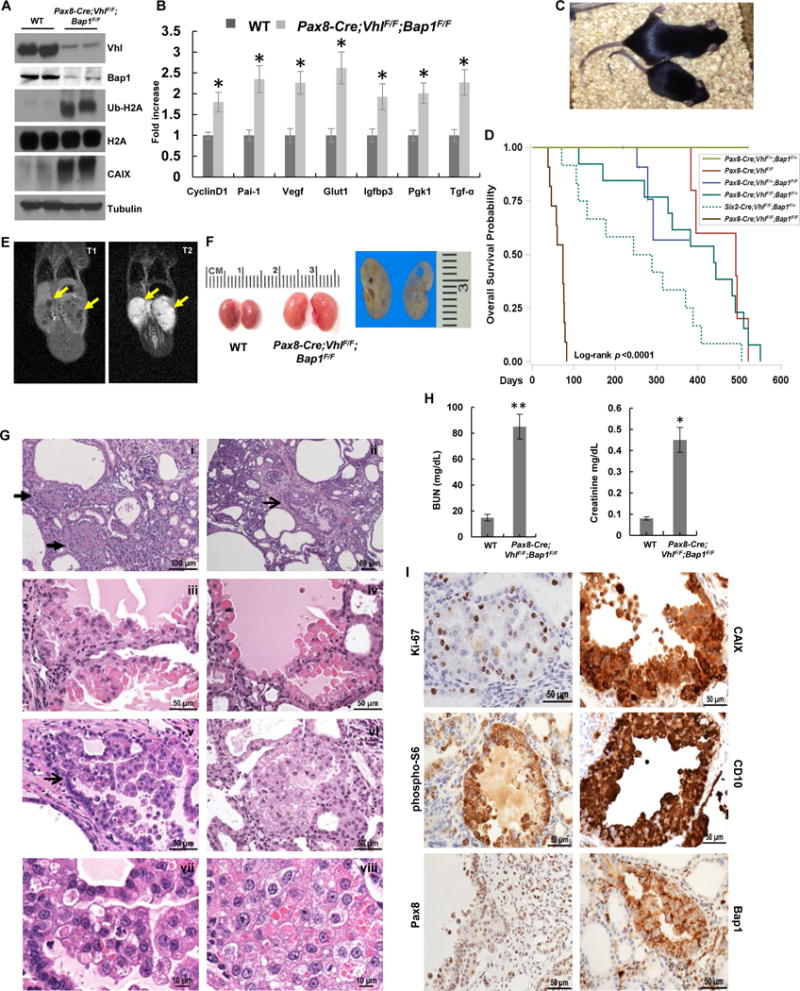
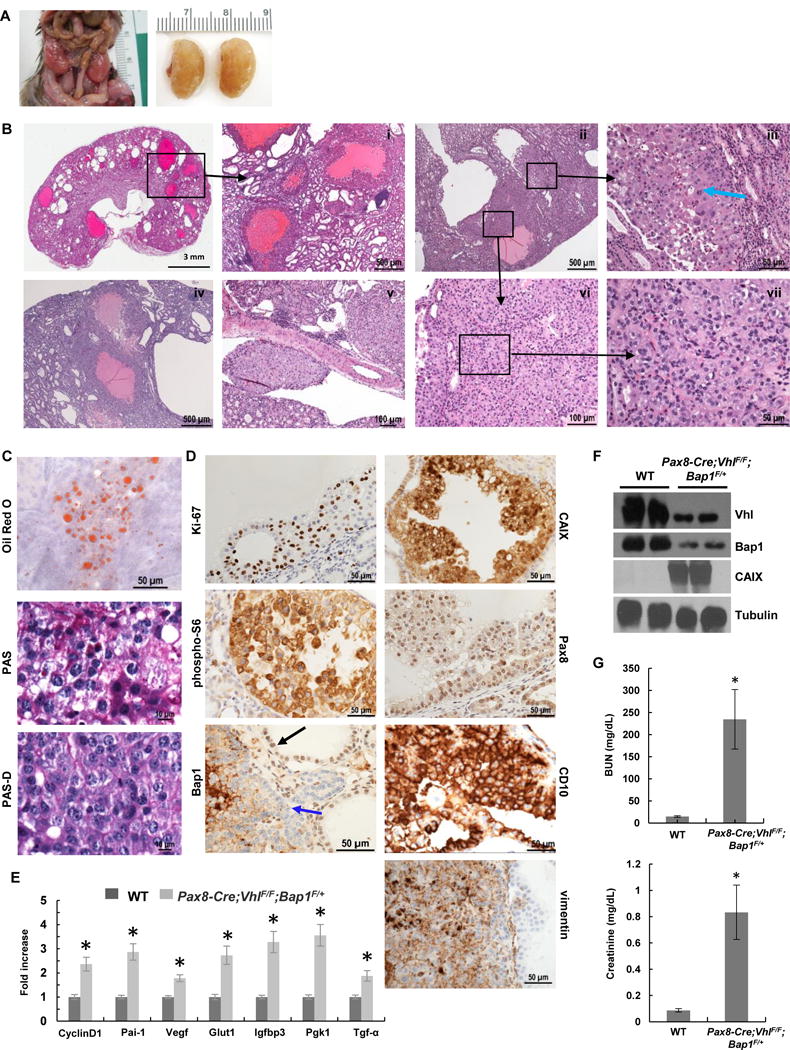
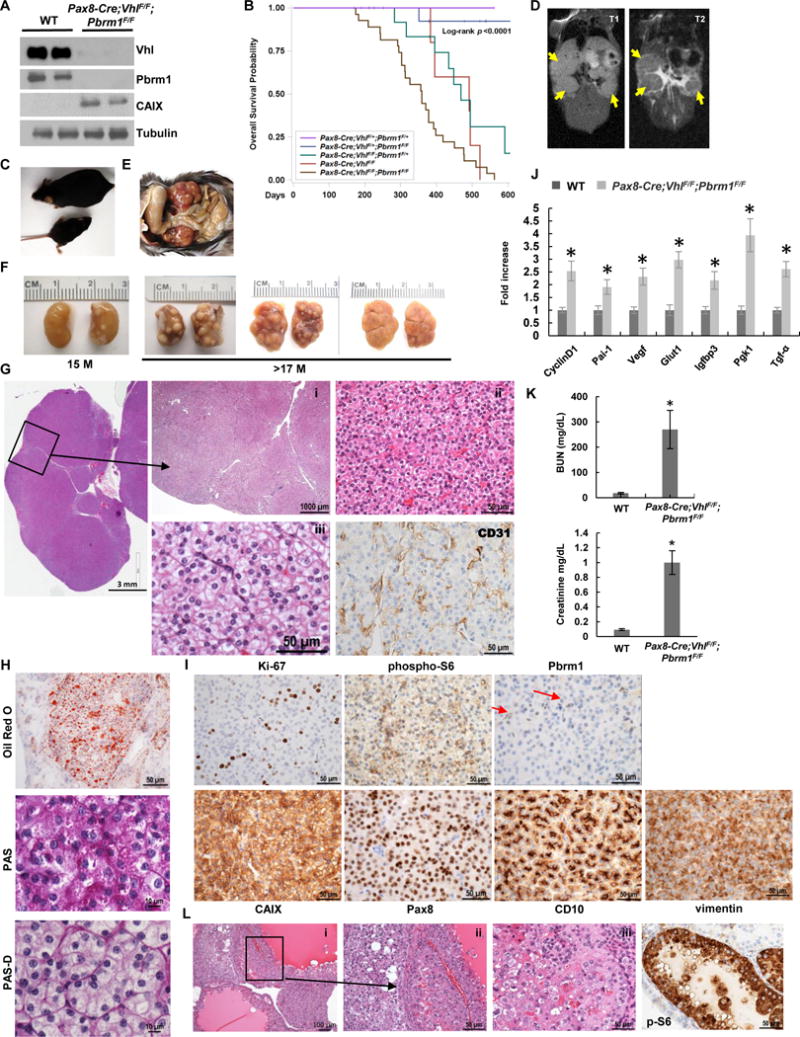
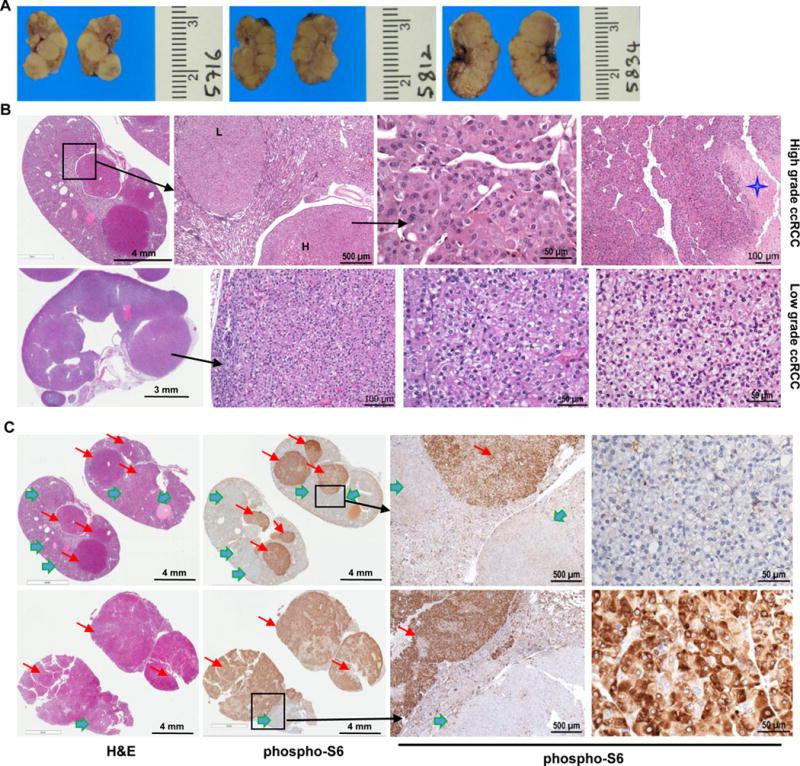
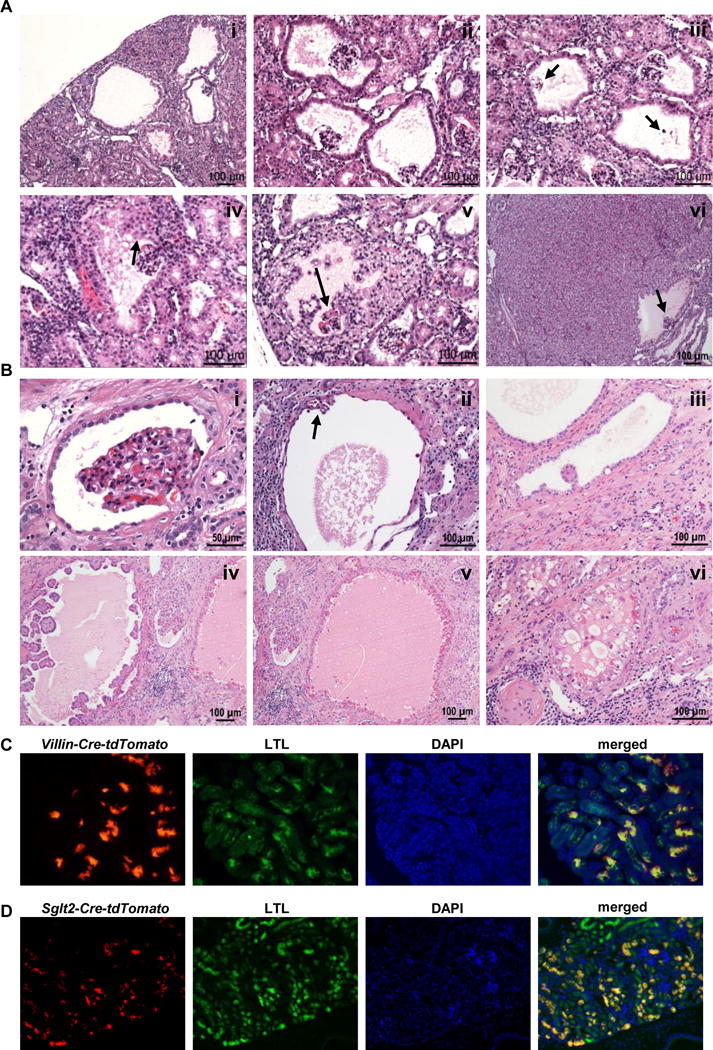
Clear cell renal cell carcinoma (ccRCC) is characterized by BAP1 and PBRM1 mutations, which are associated with tumors of different grade and prognosis. However, whether BAP1 and PBRM1 loss causes ccRCC and determines tumor grade is unclear. We conditionally targeted Bap1 and Pbrm1 (with Vhl) in the mouse using several Cre drivers. Sglt2 and Villin proximal convoluted tubule drivers failed to cause tumorigenesis, challenging the conventional notion of ccRCC origins. In contrast, targeting with PAX8, a transcription factor frequently overexpressed in ccRCC, led to ccRCC of different grades. Bap1-deficient tumors were of high grade and showed greater mTORC1 activation than Pbrm1-deficient tumors, which exhibited longer latency. Disrupting one allele of the mTORC1 negative regulator, Tsc1, in Pbrm1-deficient kidneys triggered higher grade ccRCC. This study establishes Bap1 and Pbrm1 as lineage-specific drivers of ccRCC and histologic grade, implicates mTORC1 as a tumor grade rheostat, and suggests that ccRCCs arise from Bowman capsule cells.Significance: Determinants of tumor grade and aggressiveness across cancer types are poorly understood. Using ccRCC as a model, we show that Bap1 and Pbrm1 loss drives tumor grade. Furthermore, we show that the conversion from low grade to high grade can be promoted by activation of mTORC1. Cancer Discov; 7(8); 900-17. ©2017 AACR.See related commentary by Leung and Kim, p. 802This article is highlighted in the In This Issue feature, p. 783.


Conflict of interest statement

Disclosure of Potential Conflicts of Interest: J. Brugarolas is on the Scientific Advisory Board of Bethyl Laboratories.

Figures

Figure 1
Figure 1
PAX8 is a marker of ccRCC and drives effective recombination of Bap1 and Pbrm1 in the mouse kidney. A, Representative PAX8 immunohistochemistry (IHC) of human ccRCC (along with hematoxylin and eosin (H&E) micrograph), normal human kidney, and wild-type (WT) mouse kidney. (Blue arrow, Bowman capsule; green arrow, proximal tubules; red arrow, distal tubules and collecting ducts) B, Representative images of PAX8 IHC in BAP1-mutant and PBRM1-mutant human RCC tissue microarray samples. Note that nuclei of tumor cells, which are larger and pleomorphic (but not those of stromal cells, which serve as internal positive controls) are BAP1 (or PBRM1) deficient. Conversely, tumor nuclei (larger), but not nuclei of stromal cells (smaller) are PAX8 positive. C, Quantification of PAX8 staining in PBRM1- and BAP1-mutant ccRCC samples from patient TMA (63/67 PBRM1-deficient and 19/19 BAP1-deficient ccRCCs expressed PAX8). D, Lineage tracing experiments of kidney sections from 3-month-old mice showing Pax8-lineage cells (Pax8-Cre-tdTomato; red), Lotus tetragonolobus lectin (LTL, a proximal tubule marker; green), DAPI (nuclei; blue), and a merged image. Co-staining shows that Pax8-lineage cells contribute to proximal tubules. (Magnification = 200×) E, Representative immunofluorescence images of kidney sections from 3-month-old Pax8-Cre-tdTomato;Bap1lacZ/+ gene trap mice showing lineage tracing (Pax8-Cre-tdTomato; red), Bap1 expression (β-gal; green), DAPI (nuclei; blue), and a merged image. (Magnification = 200×) F, Representative immunofluorescence images of kidney sections from 3-month-old Pax8-Cre-tdTomato;Pbrm1lacZ/+ gene trap mice showing lineage tracing of Pax8-expressing cells (Pax8-Cre-tdTomato; red), Pbrm1 expression (β-gal; green), DAPI (nuclei; blue), and merged image. (Magnification = 200×).
Figure 2
Figure 2
RCC development and premature death of Pax8-Cre;VhlF/F;Bap1F/F mice. A, Western blot analysis of the indicated proteins in Pax8-Cre;VhlF/F;Bap1F/F kidneys and controls. B, qRT–PCR for the indicated Hif target genes in kidneys of Pax8-Cre;VhlF/F;Bap1F/F mice and controls (n=3 independent mice; PCR done in triplicate). C, Pax8-Cre;VhlF/F;Bap1F/F mice are smaller and runted compared to littermate controls. D, Survival curve of Pax8-Cre;VhlF/F;Bap1F/F mice (n=12) compared to other genotype configurations (Pax8-Cre;VhlF/+;Bap1F/+, n=20; Pax8-Cre;VhlF/F, n=5; Pax8-Cre;VhlF/+;Bap1F/F, n=5; Pax8-Cre;VhlF/F;Bap1F/+, n=13). Six2-Cre;VhlF/F;Bap1F/+ (n=12) are shown as a reference (24). E, Coronal T1-weighted (left panel) and T2-weighted (right panel) images of a moribund Pax8-Cre;VhlF/F;Bap1F/F mouse (77 days old) with clearly visible focal renal lesions with marked hyperintensity on T2-weighted images (yellow arrows). F, Representative macroscopic images of kidneys from Pax8-Cre;VhlF/F;Bap1F/F mutant and control mice showing multiple cystic lesions. G, Representative kidney sections from Pax8-Cre;VhlF/F;Bap1F/F mice showing (i-ii) cysts and RCCs: (iii-v) cystic lesions with atypical proliferative lining; (vi) solid lesion with focal cytoplasmic clearing; (vii-viii) neoplastic cells with pleomorphism, anaplasia, and mitosis. Arrows: (i) solid lesions; (ii, v) cystic lesions. H, Plasma BUN and Creatinine measurements in Pax8-Cre;VhlF/F;Bap1F/F mice and controls (n=3 independent mice for each group). I, IHC showing increased expression of Ki-67, CAIX, phospho-S6, and CD10 in RCC in the tumors of Pax8-Cre;VhlF/F;Bap1F/F mice. Retained Pax8 expression, and loss of nuclear Bap1 also shown. *, P < 0.05; **, P < 0.01. (WT, age-matched VhlF/F;Bap1F/F mice without Cre; for survival curve, D, n=12, while n=16 for mice analyzed for histology.)
Figure 3
Figure 3
Pax8-Cre;VhlF/F;Bap1F/+ mice develop high grade ccRCC. A, Representative images from Pax8-Cre;VhlF/F;Bap1F/+ mutant mice showing enlarged nodular kidneys. B, H&E staining of kidney sections from Pax8-Cre;VhlF/F;Bap1F/+ mice (n=14) showing (i) cystic and solid ccRCCs, (i,iv) multiple large cystic tumors with marked proliferative lining, (iii,vi,vii) solid tumor with thin arborizing vascular network, (iii,vii) neoplastic cells with marked pleomorphism, anaplasia, prominent nucleoli, and mitosis (blue arrow indicates atypical mitosis), and (v) lymphovascular spread. C. Oil Red O staining for triglycerides and neutral lipids, and Periodic acid-Schiff staining without (PAS) and with (PAS-D) diastase highlight the abundant lipid and glycogen in neoplastic cells. D, IHC for Ki-67, CAIX, phospho-S6, Pax8, Bap1 (blue arrow, tumor cells; black arrow, retained Bap1 staining), CD10, and vimentin in RCCs. Complete loss of nuclear Bap1 expression in Pax8-Cre;VhlF/F;Bap1F/+ mice was seen in 30% (21/69 lesions (n=8)), however, no appreciable differences in morphology, size, or grade across lesions were seen. E, qRT–PCR for the indicated Hif target genes in kidneys of Pax8-Cre;VhlF/F;Bap1F/+ mice and controls (n=3 independent mice; PCR done in triplicate). F, Western blot analysis of the indicated proteins in Pax8-Cre;VhlF/F;Bap1F/+ mice and controls. G, Plasma BUN and Creatinine measurements in Pax8-Cre;VhlF/F;Bap1F/+ mice and controls (n=3 independent mice for each group). *, P < 0.05. (WT, age-matched VhlF/F;Bap1F/+ mice without Cre.)
Figure 4
Figure 4
Pax8-Cre;VhlF/F;Pbrm1F/F mice develop ccRCC of lower grade. A, Western blot analysis of the indicated proteins in Pax8-Cre;VhlF/F;Pbrm1F/F kidneys and controls. B, Survival curve of Pax8-Cre;VhlF/F;Pbrm1F/F mice (n=27) compared to Pax8-Cre;VhlF/+;Pbrm1F/+ controls (n=20), and other genotype configurations (Pax8-Cre;VhlF/F;Pbrm1F/+, n=15; Pax8-Cre;Pbrm1F/F, n=5; Pax8-Cre;VhlF/+;Pbrm1F/F, n=17). C, Pax8-Cre;VhlF/F;Pbrm1F/F mice are smaller and runted compared to littermate controls. D, Coronal T1-weighted (left) and T2-weighted (right) images of a Pax8-Cre;VhlF/F;Pbrm1F/F mouse with clearly visible homogeneous tumors with intermediate-to-low signal intensity on T2-weighted images (yellow arrows). E, Kidneys in situ in Pax8-Cre;VhlF/F;Pbrm1F/F mutant mouse. F, Representative macroscopic images of kidneys from Pax8-Cre;VhlF/F;Pbrm1F/F mutant mice at 15 and >17 months of age showing large solid tumors studding the entire cortex. G, Representative H&E microphotographs of kidney sections from Pax8-Cre;VhlF/F;Pbrm1F/F mice showing large ccRCCs completely replacing the kidney. (i) Multiple large solid tumors with pushing borders; (ii) solid tumor with thin arborizing vascular network, monomorphic neoplastic cells with minimal atypia, inconspicuous nucleoli, and mitosis; (iii) prominent cytoplasmic clearing with morphology indistinguishable from low grade human ccRCC. CD31 IHC highlights vasculature. H. Oil Red O staining for triglycerides and neutral lipids, and Periodic acid-Schiff staining without (PAS) and with (PAS-D) diastase highlighting the abundant lipid and moderate glycogen in the neoplastic cells. I, IHC of Ki-67, phospho-S6 (weak and focal), Pbrm1 (lost in tumor nuclei, but retained in normal endothelial cells (red arrows)), CAIX, Pax8, CD10, and vimentin in RCCs of Pax8-Cre;VhlF/F;Pbrm1F/F mice. J, qRT–PCR for the indicated Hif target genes in the kidneys of Pax8-Cre;VhlF/F;Pbrm1F/F mice and controls (n=3 independent mice; PCR done in triplicate). K, Plasma BUN and Creatinine measurements in Pax8-Cre;VhlF/F;Pbrm1F/F mice and controls (n=3 independent mice for each group). L, H&E (i-iii) and phospho-S6 (p-S6) IHC of rare higher grade cystic tumors with pleomorphism and atypia (seen in 4.3% (11/253) of the lesions in 20% of the mice (n=5/26) as well as prominent phospho-S6 resembling those observed in Bap1-targeted kidneys.*, P < 0.05. (WT, age-matched VhlF/F;Pbrm1F/F mice without Cre.)
Figure 5
Figure 5
Targeting one allele of Tsc1 increases high grade tumors and accelerates tumorigenesis in Pax8-Cre;VhlF/F;Pbrm1F/F mice. A, Representative macroscopic images of bisected kidneys from Pax8-Cre;VhlF/F;Pbrm1F/F;Tsc1F/+ mutant mice at 13 months of age. B, Representative H&E microphotographs of kidney sections from Pax8-Cre;VhlF/F;Pbrm1F/F;Tsc1F/+ mice (n=10) showing numerous large solid RCCs of both high grade (upper panel; star highlights necrosis; L=low grade; H=high grade) and low grade (lower panel) almost completely replacing the normal kidney. C, Representative kidney sections with H&E and corresponding phospho-S6 IHC showing weak to negative phospho-S6 expression in low grade tumors (green arrows) and high expression in high grade tumors (red arrows).
Figure 6
Figure 6
Proximal-tubule-specific deletion of Vhl;Bap1 or Vhl;Pbrm1 is not sufficient to drive tumor development. A, (i-vi) Representative H&E microphotographs from Pax8-Cre;VhlF/F;Pbrm1F/F lesions supporting the notion that RCC originates in Bowman capsule. (i-ii) multiple dilated Bowman spaces; (iii) dilated Bowman spaces with vanishing glomerular tufts (arrows) seemingly giving rise to cysts; (iv) dilated Bowman space with varying degree of parietal epithelial cell proliferation (arrow); (v) dilated Bowman space with extensive parietal epithelial cell proliferation and entrapped glomerular tuft (arrow); (vi) large solid low grade RCC with preserved dilated Bowman space and entrapped glomerular tuft (arrow). B, Representative H&E microphotographs from human kidneys adjacent to ccRCC showing similar features to those observed in our GEMMs, and further supporting the notion that RCC originates in Bowman capsule. C, Immunofluorescence images of kidney sections showing staining for Villin-lineage cells (Villin-Cre-tdTomato; red) or D, Sglt2-lineage cells (Sglt2-Cre-tdTomato; red), together with LTL (green; a proximal tubule marker), DAPI (nuclei; blue), and merged showing that the Villin and Sglt2 lineages contribute to proximal tubules.

Comment in

References

    1. Siegel R, Naishadham D, Jemal A. Cancer statistics, 2013. CA: a cancer journal for clinicians. 2013;63(1):11–30. - PubMed
    1. Baldewijns MM, van Vlodrop IJ, Schouten LJ, Soetekouw PM, de Bruine AP, van Engeland M. Genetics and epigenetics of renal cell cancer. Biochimica et Biophysica Acta. 2008;1785(2):133–55. - PubMed
    1. Gnarra JR, Tory K, Weng Y, Schmidt L, Wei MH, Li H, Latif F, Liu S, Chen F, Duh FM, et al. Mutations of the VHL tumour suppressor gene in renal carcinoma. Nature Genetics. 1994;7(1):85–90. - PubMed
    1. Brugarolas J. Molecular genetics of clear-cell renal cell carcinoma. Journal of clinical oncology : official journal of the American Society of Clinical Oncology. 2014;32(18):1968–76. - PMC - PubMed
    1. Herman JG, Latif F, Weng Y, Lerman MI, Zbar B, Liu S, Samid D, Duan DS, Gnarra JR, Linehan WM, et al. Silencing of the VHL tumor-suppressor gene by DNA methylation in renal carcinoma. Proceedings of the National Academy of Sciences of the United States of America. 1994;91(21):9700–4. - PMC - PubMed

MeSH terms