. 2017 May 5;356(6337):eaaj2239.
doi: 10.1126/science.aaj2239.

Impact of cytosine methylation on DNA binding specificities of human transcription factors

Affiliations

Impact of cytosine methylation on DNA binding specificities of human transcription factors

Yimeng Yin et al. Science. .

Abstract

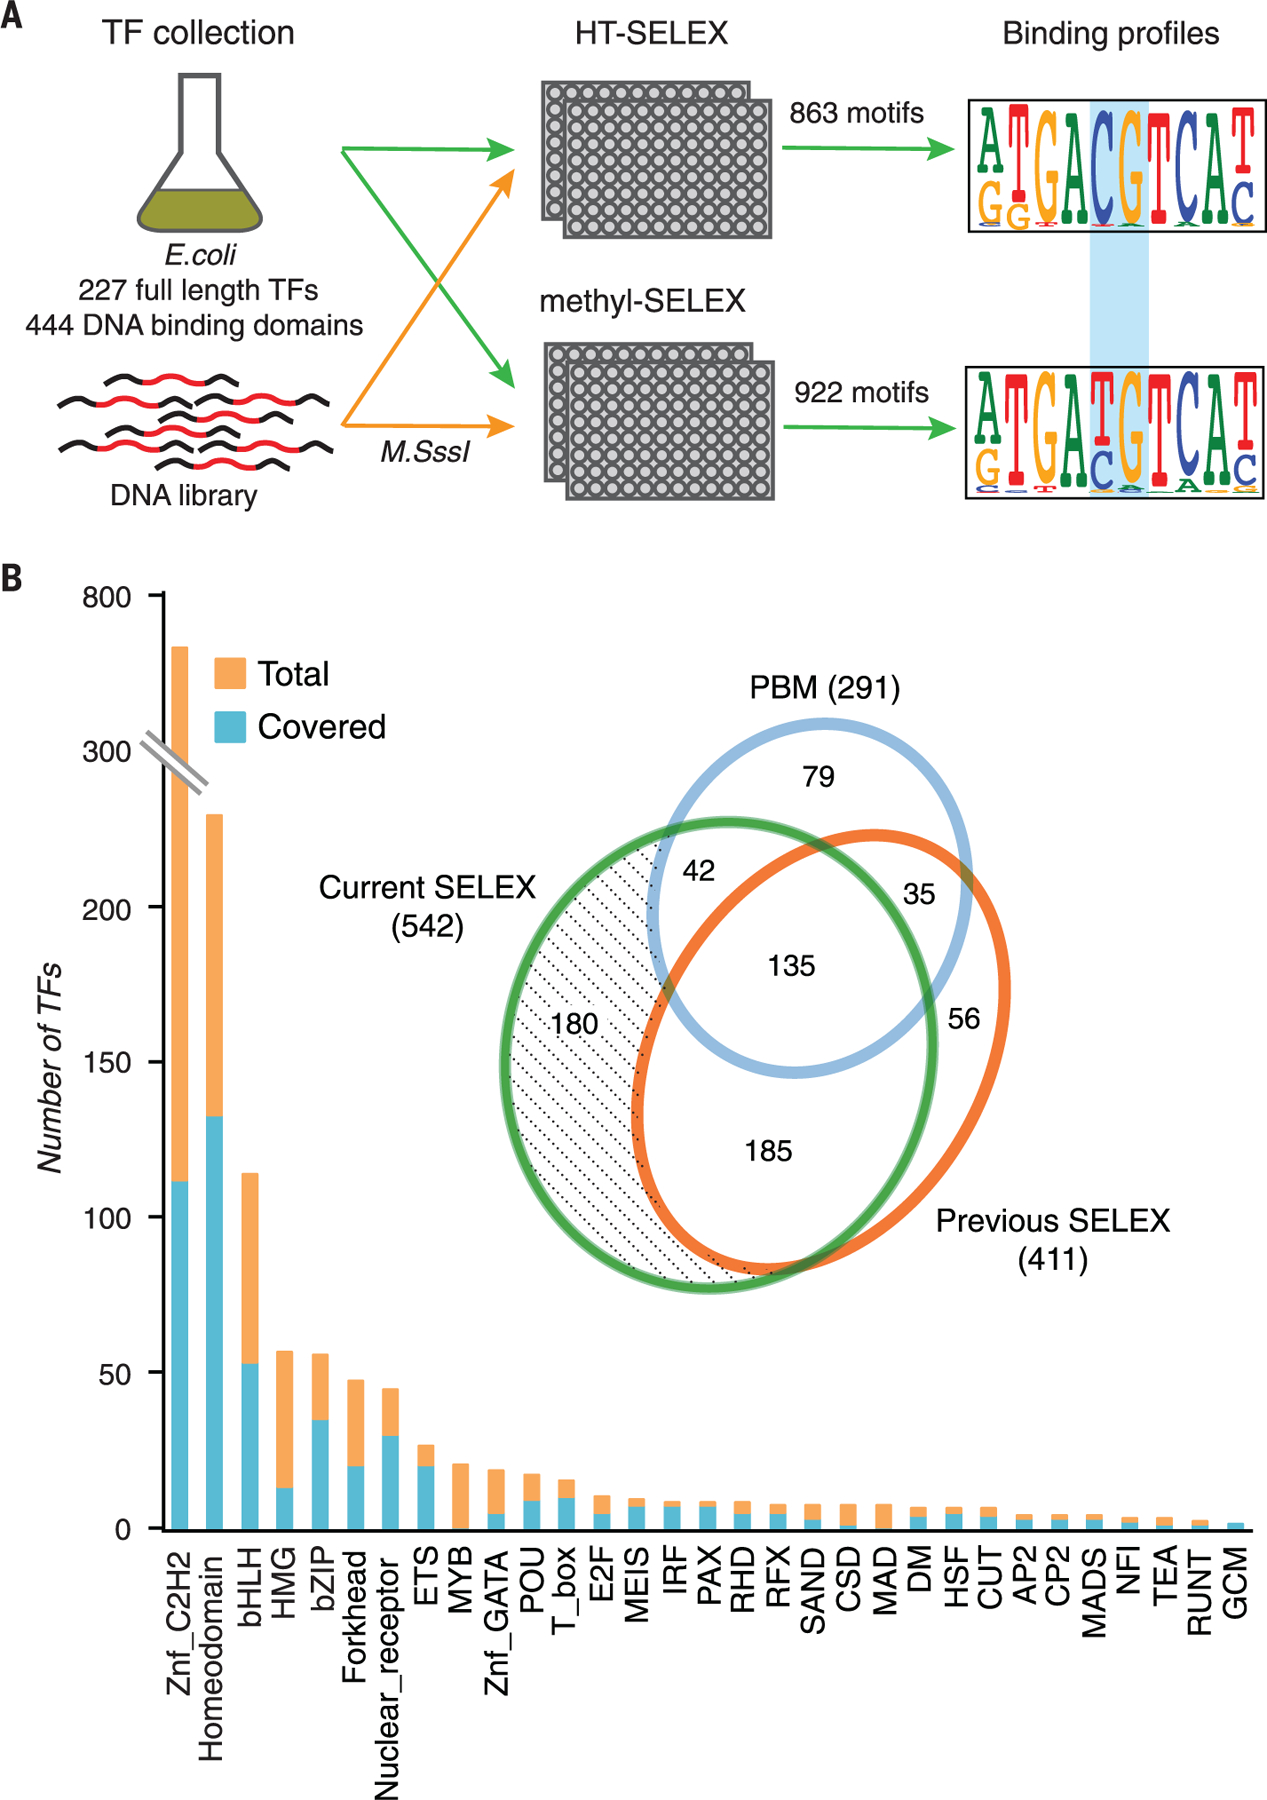
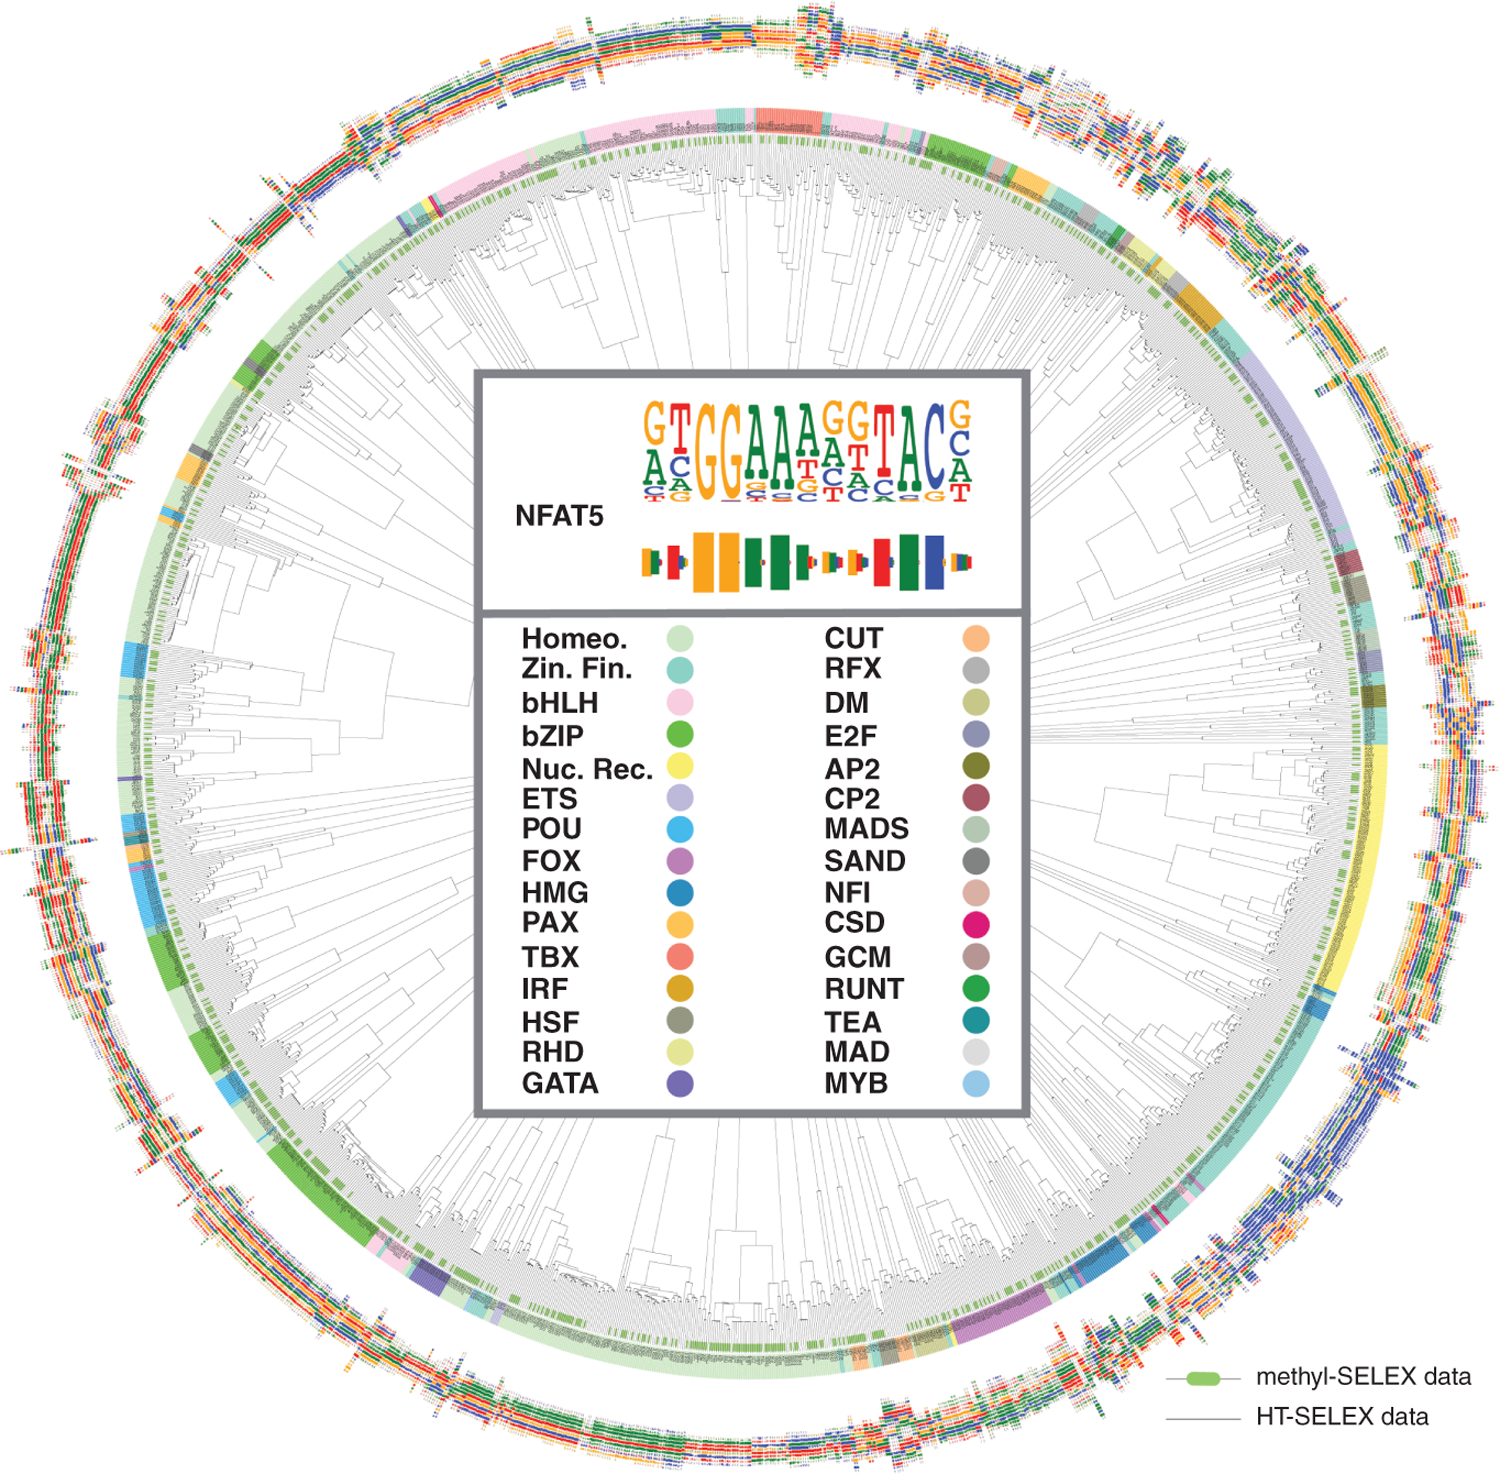
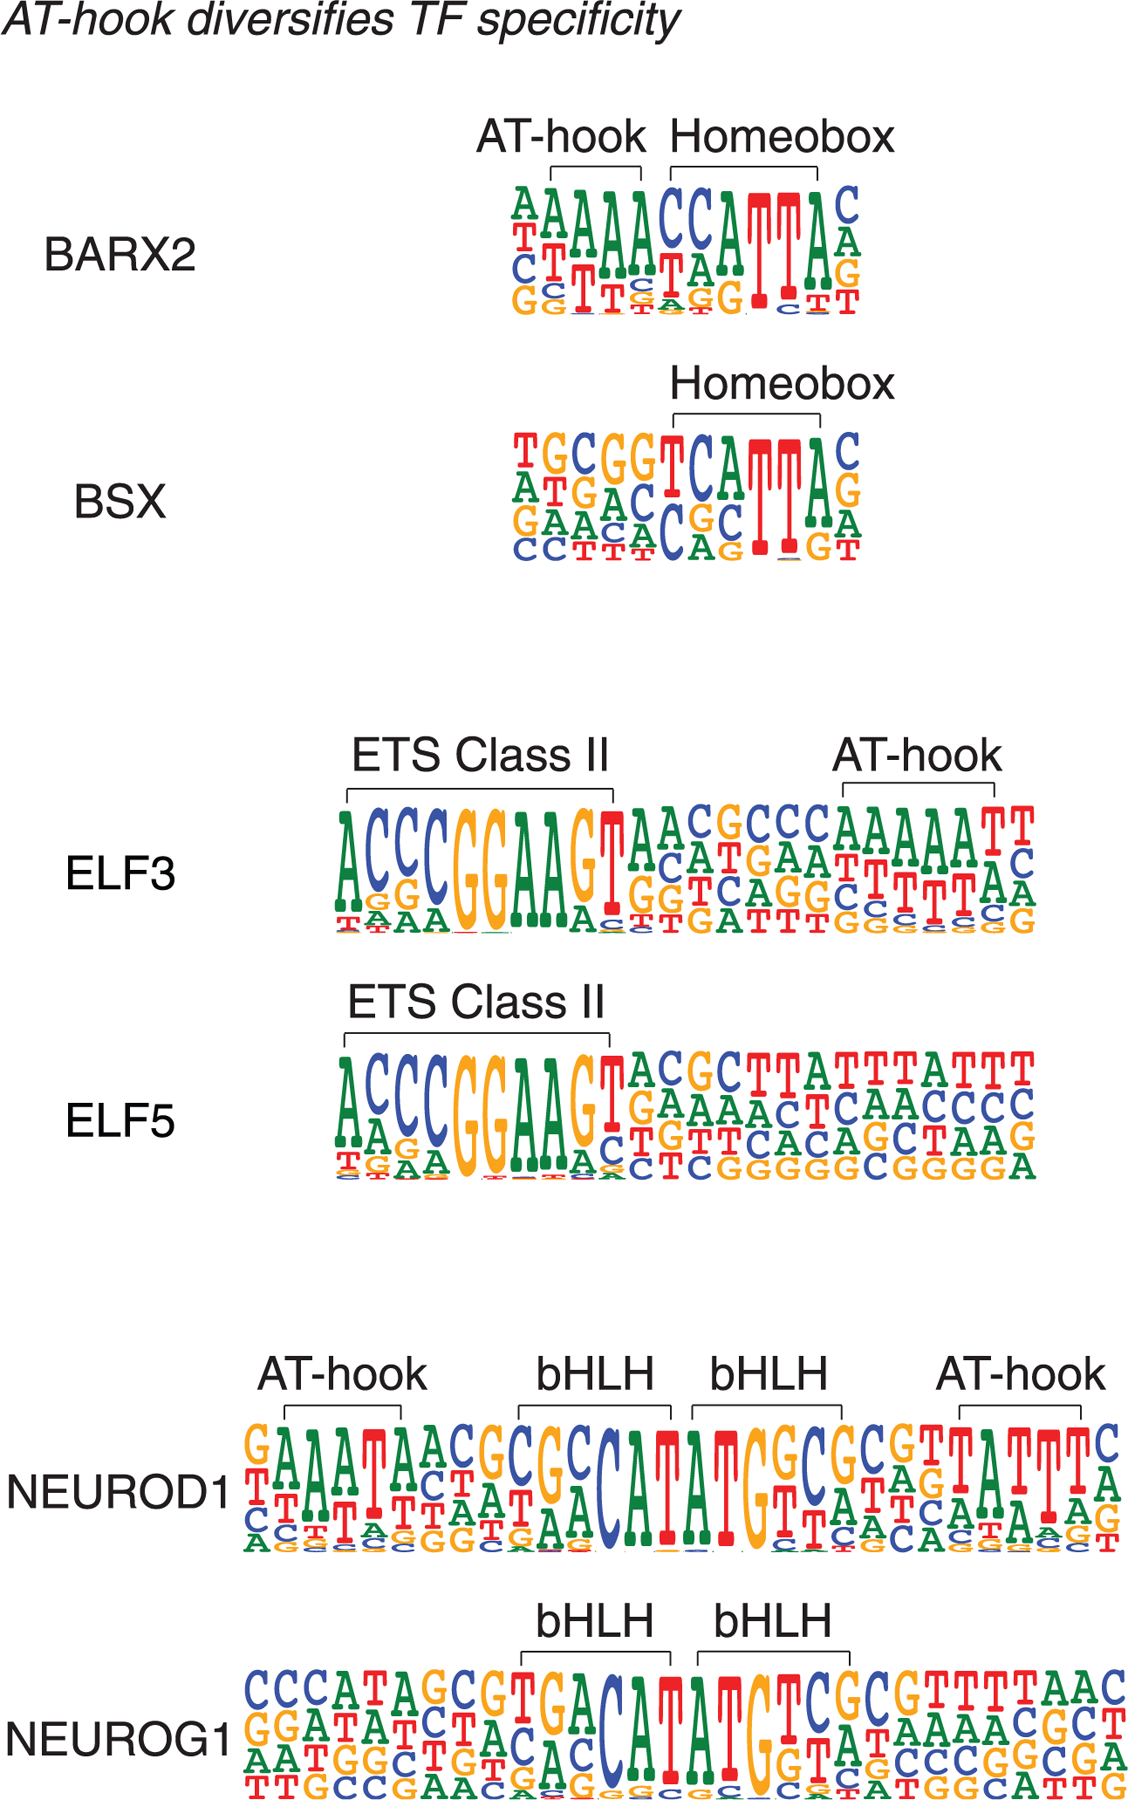
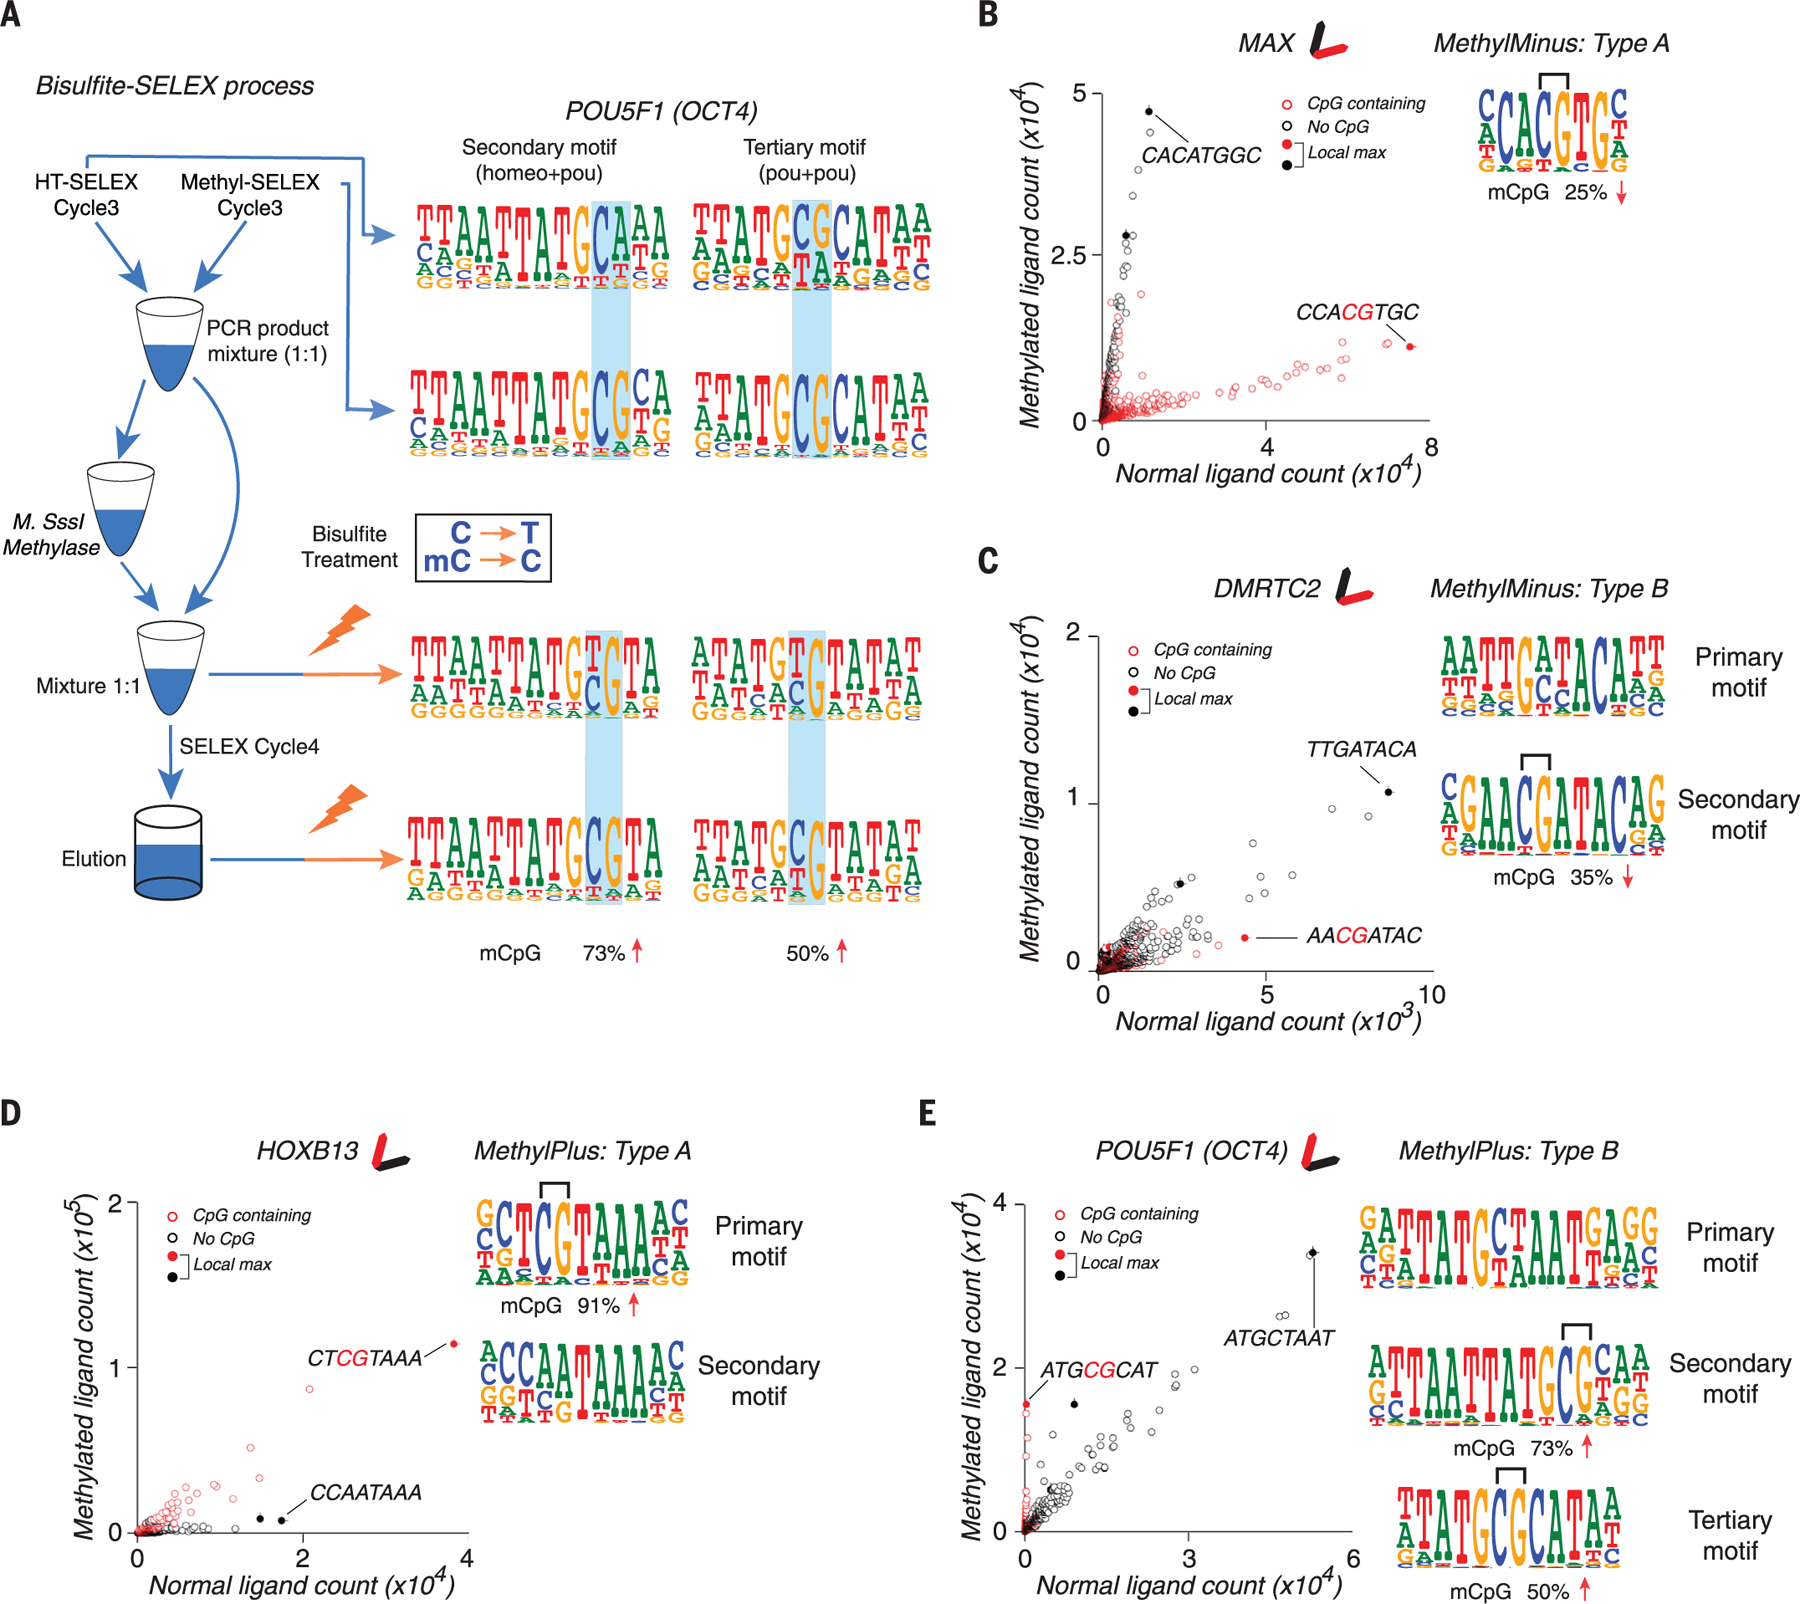
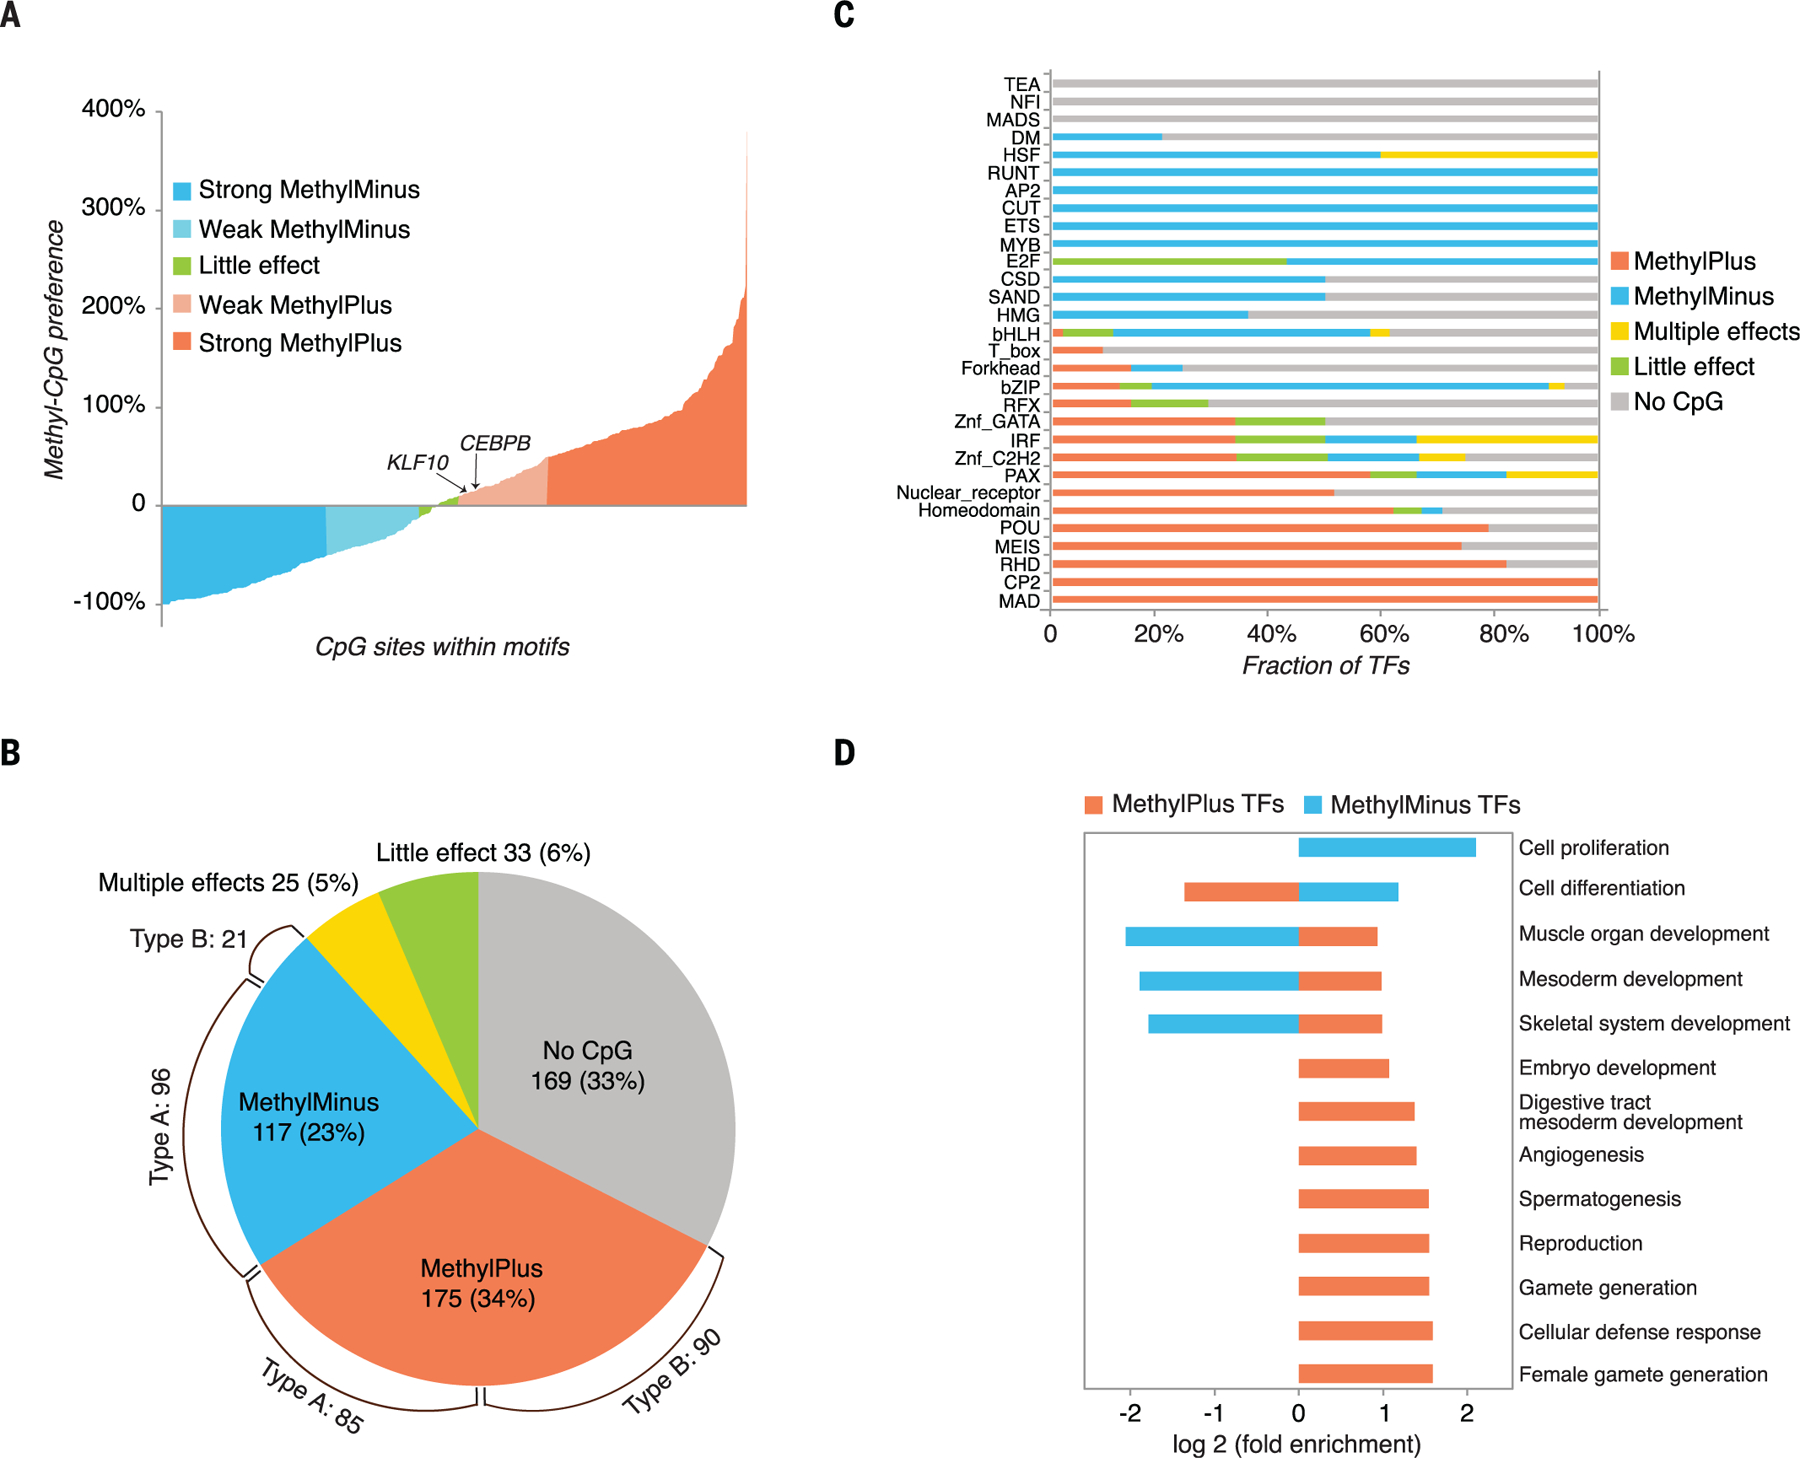
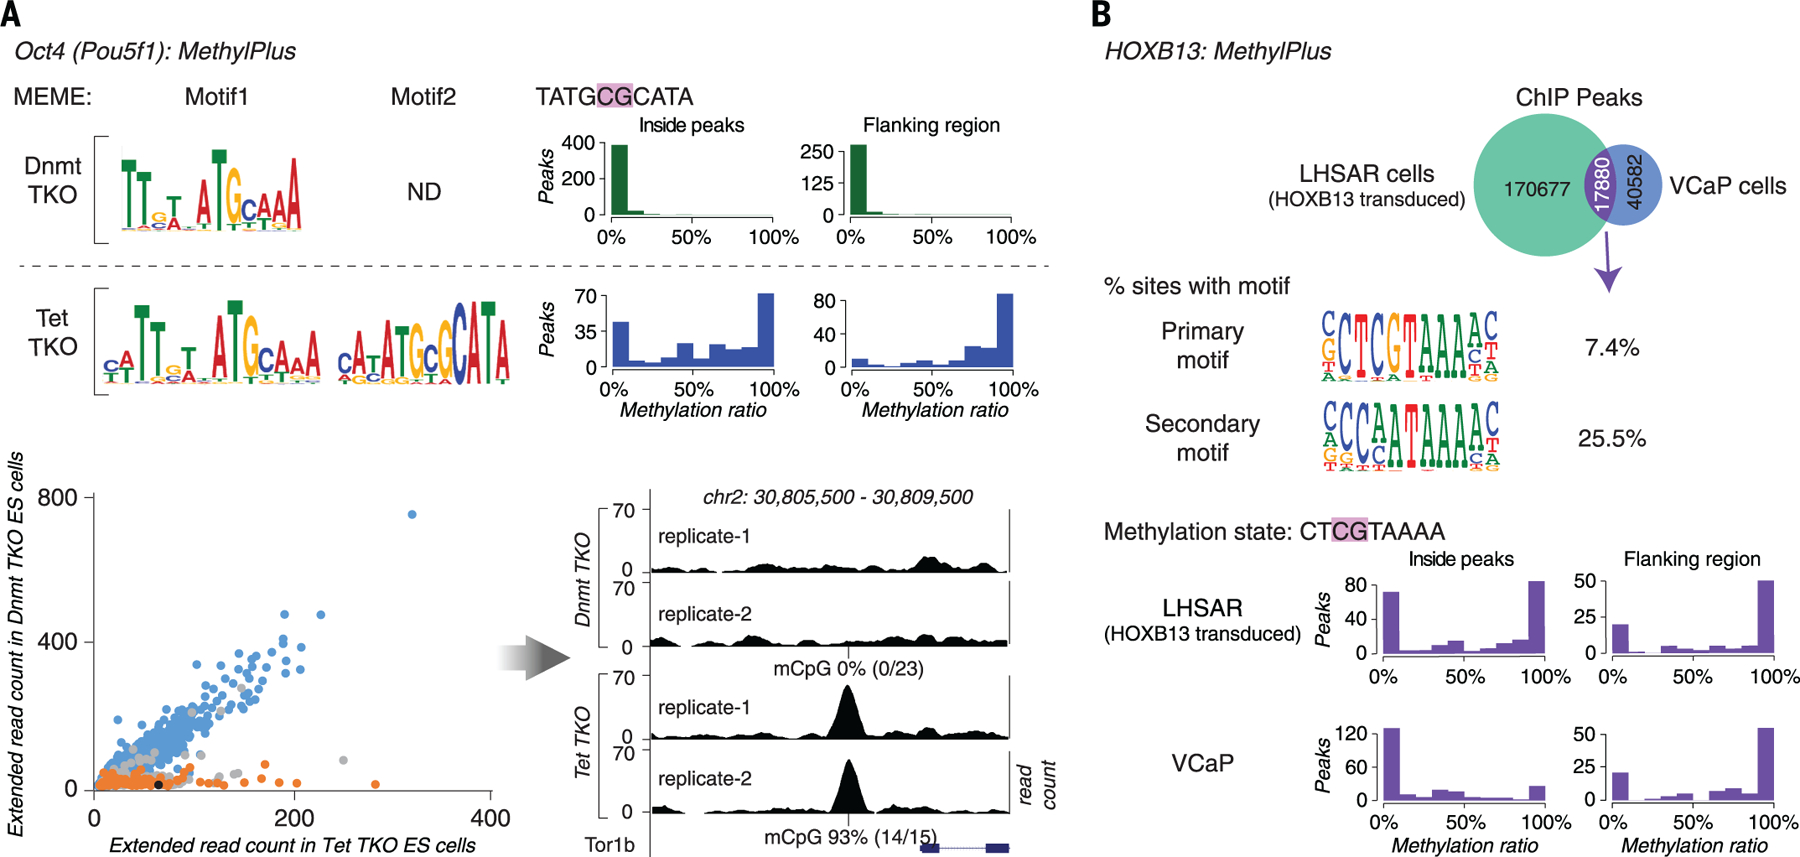
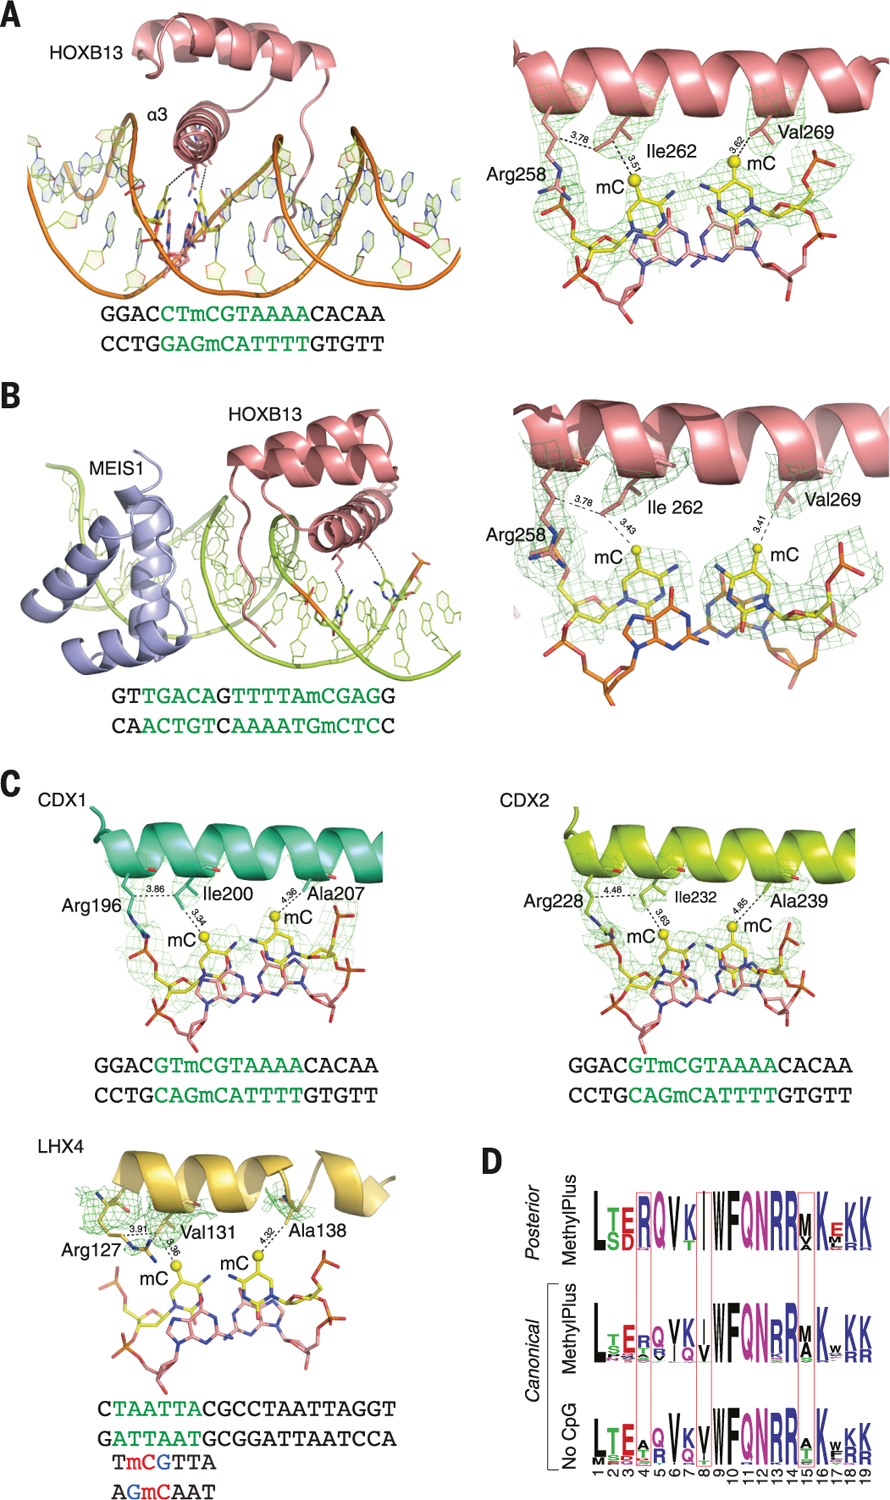
The majority of CpG dinucleotides in the human genome are methylated at cytosine bases. However, active gene regulatory elements are generally hypomethylated relative to their flanking regions, and the binding of some transcription factors (TFs) is diminished by methylation of their target sequences. By analysis of 542 human TFs with methylation-sensitive SELEX (systematic evolution of ligands by exponential enrichment), we found that there are also many TFs that prefer CpG-methylated sequences. Most of these are in the extended homeodomain family. Structural analysis showed that homeodomain specificity for methylcytosine depends on direct hydrophobic interactions with the methylcytosine 5-methyl group. This study provides a systematic examination of the effect of an epigenetic DNA modification on human TF binding specificity and reveals that many developmentally important proteins display preference for mCpG-containing sequences.


Figures

Fig. 1.
Fig. 1.. Methyl-SELEX.
(A) Schematic representation of the SELEX process that allows identification of the binding specificity of TFs for all DNA sequences, including sequences containing methylated and unmethylated CpG dinucleotides. The process uses two parallel reactions with either unmethylated DNA (top, HT-SELEX) or DNA that is methylated at each selection cycle (bottom, methyl-SELEX). Numbers of full-length TFs and extended DBDs for which motifs were obtained are indicated. The blue rectangle indicates the position of a CpG dinucleotide that is affected by methylation. (B) Coverage of TFs by family. The inset is a Venn diagram comparing coverage of mammalian TFs in this work versus in previous large studies using protein-binding microarrays (PBMs) (35, 36) and HT-SELEX (21, 25, 26). Znf, zinc finger.
Fig. 2.
Fig. 2.. Similarity of motifs.
The dendrogram indicates similarities between the motifs from HT-SELEX (thin dendrogram lines) and methyl-SELEX (thick green bars at the end of dendrogram lines). Barcode logos (25) for each factor are also shown. The center of the dendrogram shows an example of the conversion of a sequence logo into a barcode logo (top) and the color key for the TF families (bottom). Motifs for TFs in the same structural families are generally similar to each other, and motifs from methyl-SELEX and HT-SELEX are also closely related in most cases (green and black ends are found in the same branches). This is because many TFs do not have CpGs in their motifs, and the changes induced by methylation generally only affect one dinucleotide in a motif. Homeo., homeodomain; zin. fin., zinc finger; nuc. rec., nuclear receptor.
Fig. 3.
Fig. 3.. Diversification of specificity of paralogs by AT-hook addition.
The evolution of TF binding specificity by addition of an AT-hook peptide motif is illustrated. The specificities of the homeodomain TF BARX2, the ETS factor ELF3, and the bHLH protein NEUROD1 have diverged from the related TFs because of the addition of AT-hook–like amino acid sequences, which recognize a short AT-rich sequence.
Fig. 4.
Fig. 4.. Examples of effects of mCpG on TF binding.
(A) Bisulfite-SELEX. Two models for POU5F1 (OCT4) are recovered from different stages of the bisulfite-SELEX process. OCT4 can bind to both unmethylated and methylated sequences corresponding to the indicated motifs, but it prefers to bind the sequences when the indicated CpG is methylated (remains CpG after bisulfite treatment, indicated in the box). Lightning bolts represent bisulfite treatment, and blue shading highlights dinucleotides affected by methylation. Numbers at the bottom show the increased percentage of mCpG from cycle 3 to cycle 4. (B) Example of a type A methyl-minus TF, MAX (Myc-associated factor X). The scatterplot (left) shows the counts of all 8-mer subsequences from methyl-SELEX (y axis) and HT-SELEX (x axis) at cycle 4. Filled circles indicate subsequences that are more enriched than any other subsequence within a Huddinge distance (25) of 1.The most enriched sequence (CCACGTGC) is also indicated. Because methylation of CpG inhibits MAX binding, the population of the red circles (sequences with CpG) forms an elongated pattern that is located below the population of the black circles (sequences without CpG); this is also shown by the simplified glyph (top). When binding to the optimal site is blocked, other sequences (CACATGGC) that bind more weakly enrich more strongly. The logo of the MAX motif is also shown (right), with the effect of methylation of the CpG in bisulfite-SELEX shown below it. MAX is classified as type A because the consensus of its motif contains a CpG (bracket). (C) A type B methyl-minus TF, DMRTC2, for which the primary motif (right, top) is not affected by methylation, but a CpG in the secondary motif (right, bottom) is. Sequences matching the consensus of its two motifs are indicated on the scatterplot. (D and E) As in (B) and (C), but for the type A methyl-plus TF HOXB13 (D) and the type B methyl-plus TF POU5F1 (OCT4) (E). The subsequence ATGCGCAT is much more enriched by POU5F1 (OCT4) in the presence of CpG methylation. OCT4 also enriches the subsequence ATGCTAAT, which does not contain a CpG and is not affected by methylation.
Fig. 5.
Fig. 5.. Classification of TFs based on methyl-SELEX and bisulfite-SELEX.
(A) Effect of methylation of individual CpG dinucleotides on binding of human TFs. Percent increases of all mCpG dinucleotides in TF binding motifs during one round of bisulfite-SELEX are shown. Methylation of most CpGs has either a negative (blue) or positive (orange) impact on TF binding. (B) Classification of TFs based on combined analysis of methyl-SELEX and bisulfite-SELEX data (see table S3 for details for each factor). The pie chart shows the fraction of TFs that are not affected by cytosine methylation (no CpG or little effect), that prefer unmethylated CpG (methyl-minus), or that prefer methylated CpG (methyl-plus). In addition, 25 TFs exhibit differential preferences to mCpG dinucleotides at the different positions of their binding sequences or at the different motifs (multiple effects). TFs that can bind to multiple motifs were classified on the basis of the motif that contained CpG dinucleotide(s), if such motif existed. Brackets indicate the numbers of type A and type B TFs of the methyl-minus and methyl-plus groups. (C) Fraction of TFs in each group for each structural TF family. (D) Gene ontology enrichment analysis of methyl-plus and methyl-minus TFs. Biological process classes that are significantly (corrected P < 0.005) enriched or depleted (more than twofold relative to random expectation, based on all the TFs for which motifs were obtained) are included.
Fig. 6.
Fig. 6.. ChIP-seq analysis.
(A) OCT4 prefers a methylated motif in vivo. ChIP-seq analysis of OCT4 was performed in ES cells lacking methylcytosine (Dnmt-TKO) or displaying increased methylation of gene regulatory regions (Tet-TKO). Motif enrichment analysis with MEME (top left) recovered the methyl-plus motif (motif 2) of OCT4 only from peaks from the Tet-TKO cells. Most of the OCT4 occupied sites containing motif 2 were fully methylated in Tet-TKO cells (blue histograms) but not in Dnmt-TKO cells (green histograms) (top right). The scatterplot (bottom left) shows ChIP extended read coverage at motif match positions from peaks in the Tet- (x axis) and Dnmt-TKO (y axis) cells. The ChIP-seq peak heights at the motif 1 match positions (blue) are similar among the cell types, whereas peaks at motif 2 match positions whose methylation state changes (orange) are taller in Tet-TKO cells. Only sites that overlapped with two or more bisulfite-sequencing reads were analyzed. Peaks containing motif 2 matches whose methylation does not change or changes less than the cut-off (from ≤ 20% in Dnmt-TKO to ≥80% in Tet-TKO) are in gray. The black dot indicates the example peak site shown in the bottom right panel. (B) Exogenously introduced HOXB13 binds to methylated sites in the primary prostate epithelial cell line LHSAR. ChIP-seq analysis for HOXB13 was performed in VCaP prostate cancer cells and LHSAR cells transduced with HOXB13-expressing lentivirus. Analysis of peaks that were common to both cell lines (top) showed that HOXB13 can bind to two different motifs, one of which (SELEX primary motif) commonly contains a CpG dinucleotide. The positions of most of the common peaks containing CpG were methylated in LHSAR cells, indicating that HOXB13 can bind to methylated sites. The methylation level of the occupied sites is generally either very low or very high, consistent with the fact that methylation is either present or absent at a given allele. Methylation is lower in the VCaP prostate cancer cells, potentially because of binding-induced demethylation (7).
Fig. 7.
Fig. 7.. Molecular basis of recognition of mCpG by homeodomain proteins.
(A) The structure of HOXB13 bound to methylated DNA reveals a mechanism by which posterior homeodomain proteins recognize methylated cytosine. Shown on the left is the overall structure of HOXB13 bound to methylated DNA. Residues that recognize the methylated CpG are shown as ball-and-stick models, and the DNA sequence used in crystallization is presented under the structure. Shown on the right is the composite omit electron density map for the residues of the HOXB13 DBD recognition helix that form hydrophobic interactions with both of the methylated cytosines. The contacts of the model are shown with dashed lines; numbers are distances in angstroms. Ile262 interacts with the mC of the TmCG sequence, whereas Val269 interacts with the mC from the complementary strand. The aliphatic chain of Arg258 also contributes to the local hydrophobic environment. Green letters highlight the bases specifically bound by the TFs. (B) Overview of the HOXB13:MEIS1 heterodimer bound to a methylated DNA. HOXB13 is colored pink, MEIS1 is colored blue, the methylated base pairs are shown as ball-and-stick models, the contacts are presented as dashed lines, and the residues and methylated bases are labeled. Similar to the HOXB13 monomer, the two methylated cytosines are respectively recognized by Ile262 and Val269. (C) Composite omit electron density maps indicate residues of CDX1, CDX2, and LHX4 that recognize mCpG. (D) Sequence logo showing similarity between the strongly methyl-plus posterior homeodomain proteins and canonical homeodomains that prefer or do not bind to mCpG. The identities of the residues at positions identified by the structural analysis (boxes) explain the different preferences of these proteins with respect to mCpG. Single-letter abbreviations for the amino acid residues are as follows: A, Ala; C,Cys; D, Asp; E,Glu; F, Phe; G,Gly; H, His; I, Ile; K, Lys; L, Leu; M, Met; N, Asn; P, Pro; Q, Gln; R, Arg; S, Ser; T, Thr; V, Val; W, Trp; and Y, Tyr.

Comment in

References

    1. Huff JT, Zilberman D, Dnmt1-independent CG methylation contributes to nucleosome positioning in diverse eukaryotes. Cell 156, 1286–1297 (2014). doi: 10.1016/j.cell.2014.01.029 - DOI - PMC - PubMed
    1. Kelly TK et al., Genome-wide mapping of nucleosome positioning and DNA methylation within individual DNA molecules. Genome Res 22, 2497–2506 (2012). doi: 10.1101/gr.143008.112 - DOI - PMC - PubMed
    1. Bird A, DNA methylation patterns and epigenetic memory. Genes Dev 16, 6–21 (2002). doi: 10.1101/gad.947102 - DOI - PubMed
    1. Ball MP et al., Targeted and genome-scale strategies reveal gene-body methylation signatures in human cells. Nat. Biotechnol 27, 361–368 (2009). doi: 10.1038/nbt.1533 - DOI - PMC - PubMed
    1. Lister R et al., Human DNA methylomes at base resolution show widespread epigenomic differences. Nature 462, 315–322 (2009). doi: 10.1038/nature08514 - DOI - PMC - PubMed

Publication types