. 2017 May 5;356(6337):513-519.
doi: 10.1126/science.aal3535.

Anti-inflammatory effect of IL-10 mediated by metabolic reprogramming of macrophages

Affiliations

Anti-inflammatory effect of IL-10 mediated by metabolic reprogramming of macrophages

W K Eddie Ip et al. Science. .

Abstract

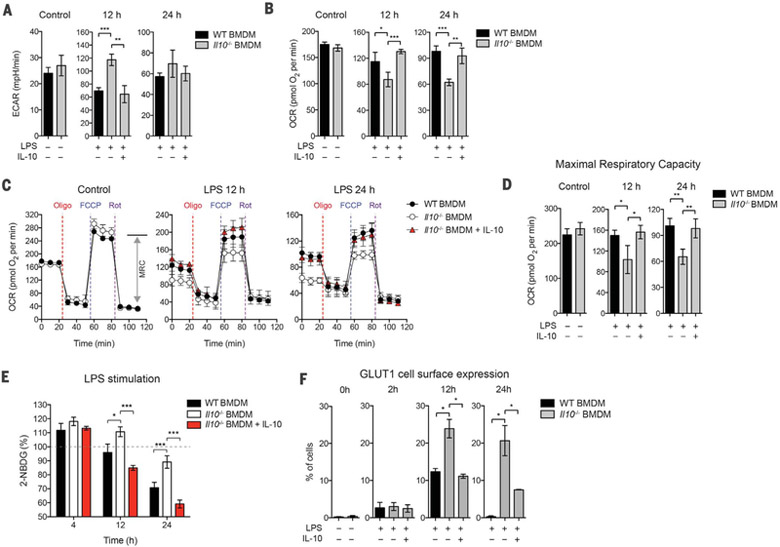
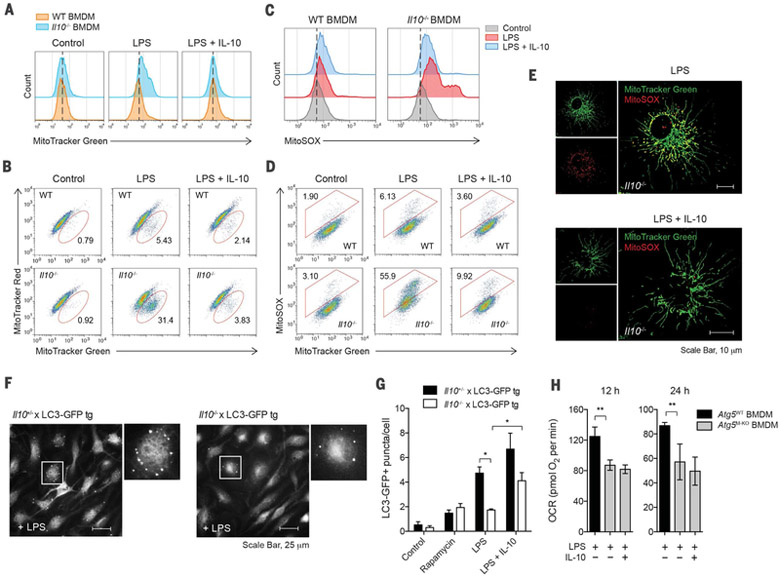
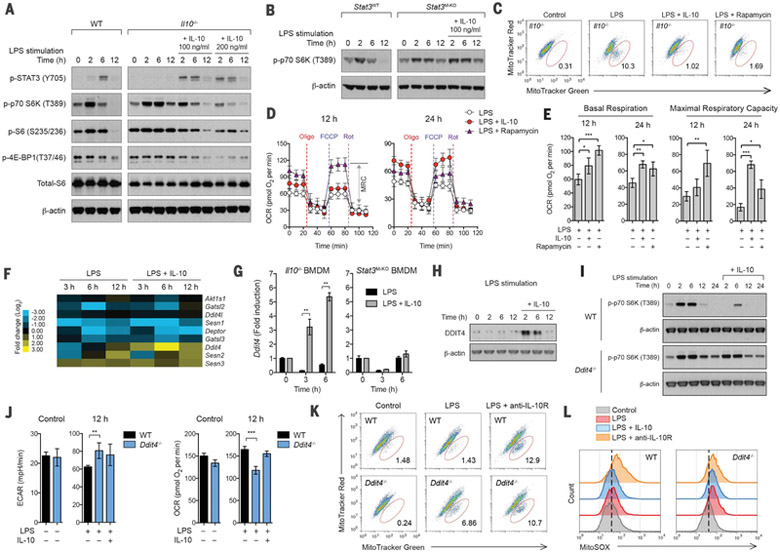
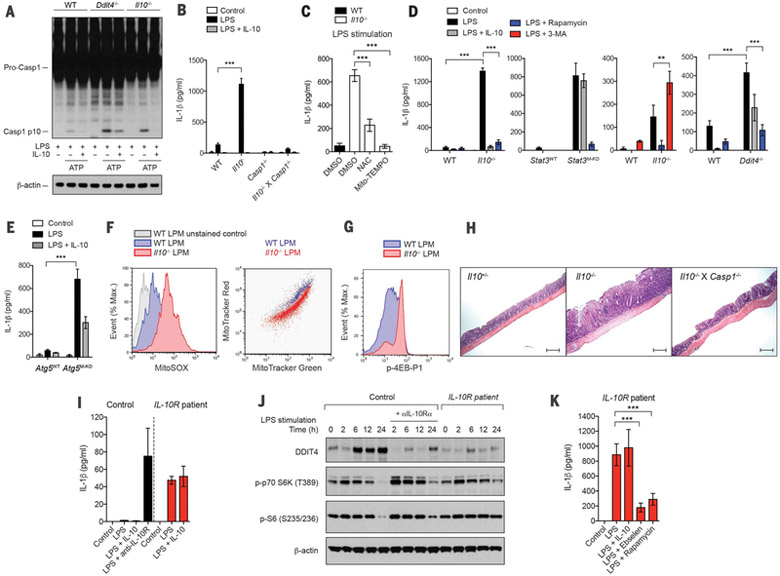
Interleukin 10 (IL-10) is an anti-inflammatory cytokine that plays a critical role in the control of immune responses. However, its mechanisms of action remain poorly understood. Here, we show that IL-10 opposes the switch to the metabolic program induced by inflammatory stimuli in macrophages. Specifically, we show that IL-10 inhibits lipopolysaccharide-induced glucose uptake and glycolysis and promotes oxidative phosphorylation. Furthermore, IL-10 suppresses mammalian target of rapamycin (mTOR) activity through the induction of an mTOR inhibitor, DDIT4. Consequently, IL-10 promotes mitophagy that eliminates dysfunctional mitochondria characterized by low membrane potential and a high level of reactive oxygen species. In the absence of IL-10 signaling, macrophages accumulate damaged mitochondria in a mouse model of colitis and inflammatory bowel disease patients, and this results in dysregulated activation of the NLRP3 inflammasome and production of IL-1β.


Figures

Fig. 1.
Fig. 1.. IL-10 regulates glycolysis and mitochondrial function in BMDMs on LPS stimulation.
WT or Il10−/− BMDMs were stimulated without (control) or with LPS in the presence or absence of IL-10 for indicated times. (A and B) ECAR and OCR in BMDMs as assessed by Seahorse assay. (C) Real-time changes in the OCR of BMDMs after treatment with oligomycin (Oligo), FCCP, and rotenone (Rot). MRC, maximal respiratory capacity (double-headed arrow), is shown for the control in WT BMDMs. (D) Maximal respiratory capacity of BMDMs measured by real-time changes in OCR. (E) Glucose uptake of BMDMs determined by direct incubation with 2-NBDG (a fluorescent D-glucose analog) for 2 hours, followed by fluorescence detection. (F) Quantification of GLUT1 plasma membrane translocation using ImageStream. Percentage of cells with GLUT1 cell surface translocation was determined by colocalized GLUT1 (green) and CD11b (red) as shown in the representative images (see fig. S5E). All values are means ± SD of at least three independent experiments. Student’s t test (unpaired); *P < 0.05, **P < 0.01, ***P < 0.001.
Fig. 2.
Fig. 2.. IL-10 prevents accumulation of dysfunctional mitochondria and production of mitochondrial ROS via the induction of mitophagy.
(A to E) WT or Il10−/− BMDMs stimulated without (control) or with LPS in the presence or absence of IL-10 for 24 hours. Total mitochondrial mass was analyzed by flow cytometry in cells labeled with MitoTracker Green (A). Mitochondrial membrane potential (Δψm) and ROS were analyzed in cells labeled with MitoTracker Green and MitoTracker Red (B), or with MitoSOX (C) and (D), respectively. Representative microscopic images show mitochondrial ROS production in Il10−/− BMDMs labeled with MitoTracker Green and MitoSOX (E). Scale bars, 10 μm. (F and G) Quantification of LC3-GFP punctate formation in IL-10–sufficient (Il10+/−) or –deficient (Il10−/−) LC3-GFP tg BMDMs stimulated as in (A) or with rapamycin for 6 hours. Representative microscopic images show LC3-GFP punctate in higher magnification of the indicated area (box) (F). Quantification based on counting LC3-GFP punctate per cell in the field of view (G). (H) OCR in BMDMs generated from Atg5flox/flox (Atg5WT) or Atg5flox/flox LysM-Cre (Atg5M–KO) mice and stimulated as in (A) for the indicated times. All values are means ± SD of at least three independent experiments. Student’s t test (unpaired); *P < 0.05, **P < 0.01.
Fig. 3.
Fig. 3.. Induction of DDIT4 by IL-10 inhibits mTOR signaling and maintains mitochondrial fitness.
BMDMs of the indicated strains were stimulated without (control) or with LPS in the presence or absence of IL-10, rapamycin, or antibody against IL-10Rα (anti-IL-10R) for 24 hours or the indicated times. (A and B) Comparison of mTORC1 activation in WT and Il10−/− BMDMs (A) or Stat3flox/flox (Stat3WT) and Stat3flox/flox LysM-Cre (Stat3M–KO) BMDMs (B) was analyzed by Western blotting. (C) Mitochondrial membrane potential (Δψm) was analyzed in Il10−/− BMDMs labeled with MitoTracker Green and MitoTracker Red. (D) Real-time changes in the OCR of Il10−/− BMDMs after treatment with oligomycin, FCCP, and rotenone were assessed by Seahorse assay. MRC, maximal respiratory capacity (double-headed arrow), is shown for rapamycintreated Il10−/− BMDMs at 12 hours. (E) Basal respiration and maximal respiratory piratory capacity of Il10−/− BMDMs, measured by real-time changes in OCR. (F) Heat map showing RNA-seq data, log2 (fold change) of a selected subset of genes encoding negative regulators of mTORC1 activation in Il10−/− BMDMs. (G) Induction of Ddit4 mRNA expression by IL-10 in Il10−/− or Stat3M–KO BMDMs was analyzed by quantitative PCR. Data are expressed as fold change. (H) Induction of DDIT4 protein expression by IL-10 in Il10−/− BMDMs. (I) Comparison of mTORC1 activation in WT and Ddit4−/− BMDMs. (J) ECAR and OCR in WT and Ddit4−/− BMDMs. (K and L) Δψm and mitochondrial ROS were analyzed in WT and Ddit4−/− BMDMs labeled with MitoTracker Green and MitoTracker Red (K) or with MitoSOX (L). All values are means ± SD of at least three independent experiments. Student’s t test (unpaired); **P < 0.05, **P < 0.01. *** P < 0.001.
Fig. 4.
Fig. 4.. Aberrant activation of inflammasome via mTOR signaling and mitochondrial ROS production in macrophages from IL-10–deficient mice and IBD patients with loss of IL-10R signaling.
(A) The cleavage of caspase-1 to its active p10 subunit in WT, Ddit4−/−, or Il10−/− BMDMs primed with LPS for 12 hours and stimulated with ATP for 30 min. (B to E) IL-1β secretion by BMDMs of the indicated strains stimulated without (control) or with LPS in the absence or presence of IL-10, NAC, Mito-TEMPO, rapamycin, or 3-MA for 24 hours was measured by enzyme-linked immunosorbent assay (ELISA). DMSO, dimethyl sulfoxide. (F and G) Mitochondrial ROS, mitochondrial membrane potential (Δψm), and phosphorylation of 4EB-P1 in colonic lamina propria cells, isolated from WT or Il10−/− mice and labeled with MitoSOX [(F) left] or with MitoTracker Green and MitoTracker Red [(F) right] or stained intracellularly for phosphorylated 4EB-P1 (G) were analyzed by flow cytometry gated on CD11b+ for lamina propria macrophages (LPMs). (H) Representative immunohistochemistry images of hematoxylin and eosin staining in middle-colon tissue from the indicated mouse strains. Scale bar, 200 μm. (I) IL-1β secretion by monocytederived macrophages (MDMs) from IL-10R–deficient patients versus healthy subjects, stimulated without (control) or with LPS in the absence or presence of IL-10 or antibody against IL-10Rα (anti-IL-10R) for 24 hours. (J) Comparison of DDIT4 expression and mTORC1 activation in MDMs from IL-10R–deficient patients versus healthy subjects was analyzed by Western blotting. MDMs were stimulated as in (I) for the indicated times. (K) The effect of inhibition of ROS and mTORC1 on IL-1β secretion by MDMs from IL-10R–deficient patients and stimulated as in (I) in the absence or presence of ebselen or rapamycin for 24 hours. All values are means ± SD of at least three independent experiments (A to H) or two independent experiments (I to K). Student’s t test (unpaired); **P < 0.01, *** P < 0.001.

Comment in

References

    1. Ouyang W, Rutz S, Crellin NK, Valdez PA, Hymowitz SG, Annu. Rev. Immunol 29, 71–109 (2011). - PubMed
    1. Shouval DS et al., Immunity 40, 706–719 (2014). - PMC - PubMed
    1. Zigmond E et al., Immunity 40, 720–733 (2014). - PubMed
    1. Franke A et al., Nat. Genet 40, 1319–1323 (2008). - PubMed
    1. Franke A et al., Nat. Genet 42, 1118–1125 (2010). - PMC - PubMed

Publication types

MeSH terms