. 2017 Jun 9;356(6342):eaag3009.
doi: 10.1126/science.aag3009. Epub 2017 May 4.

Mapping the human DC lineage through the integration of high-dimensional techniques

Affiliations

Mapping the human DC lineage through the integration of high-dimensional techniques

Peter See et al. Science. .

Abstract

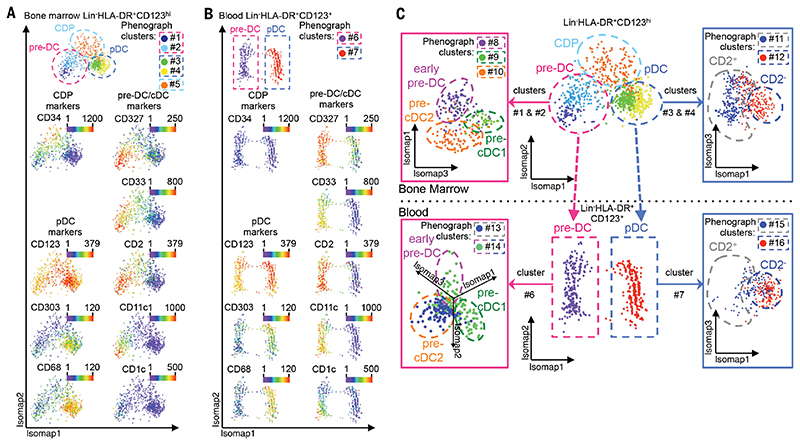
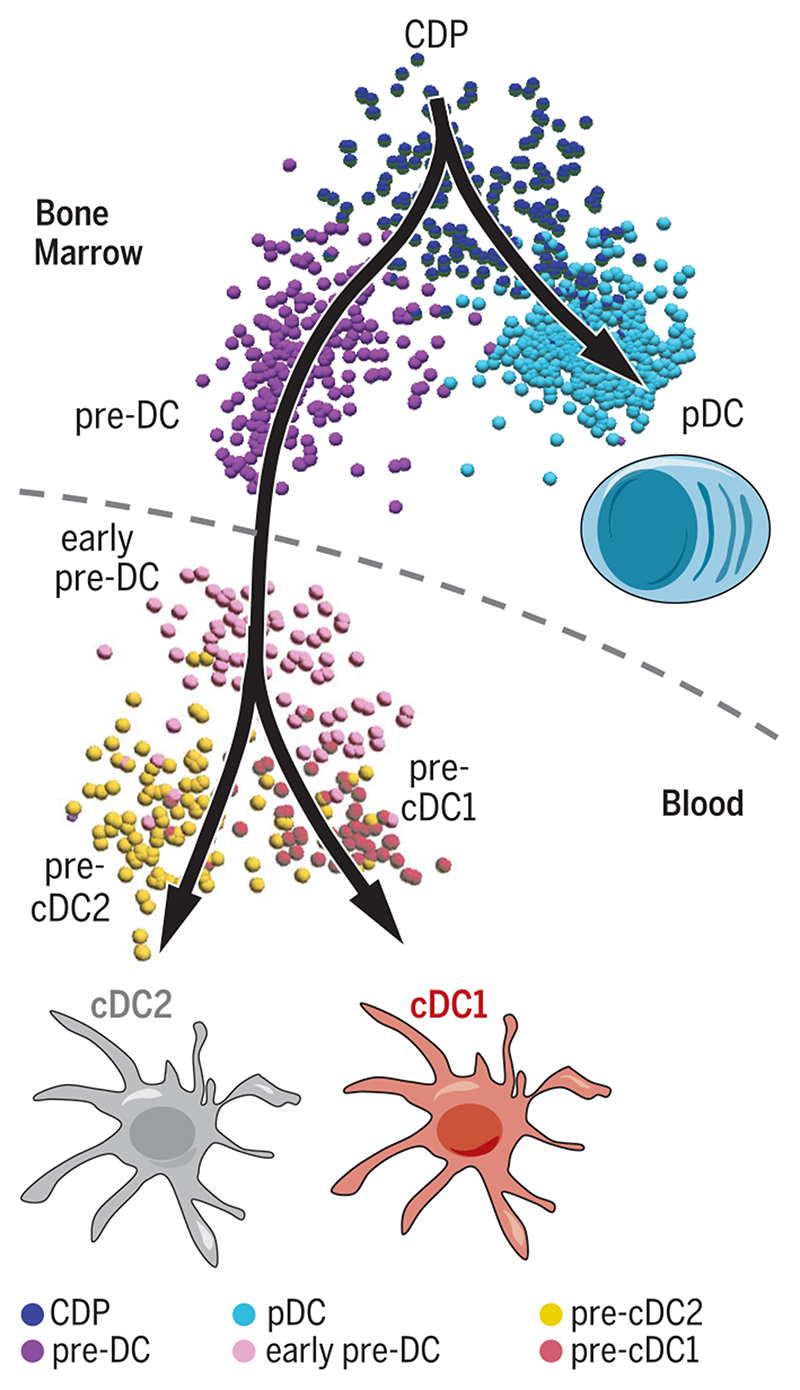
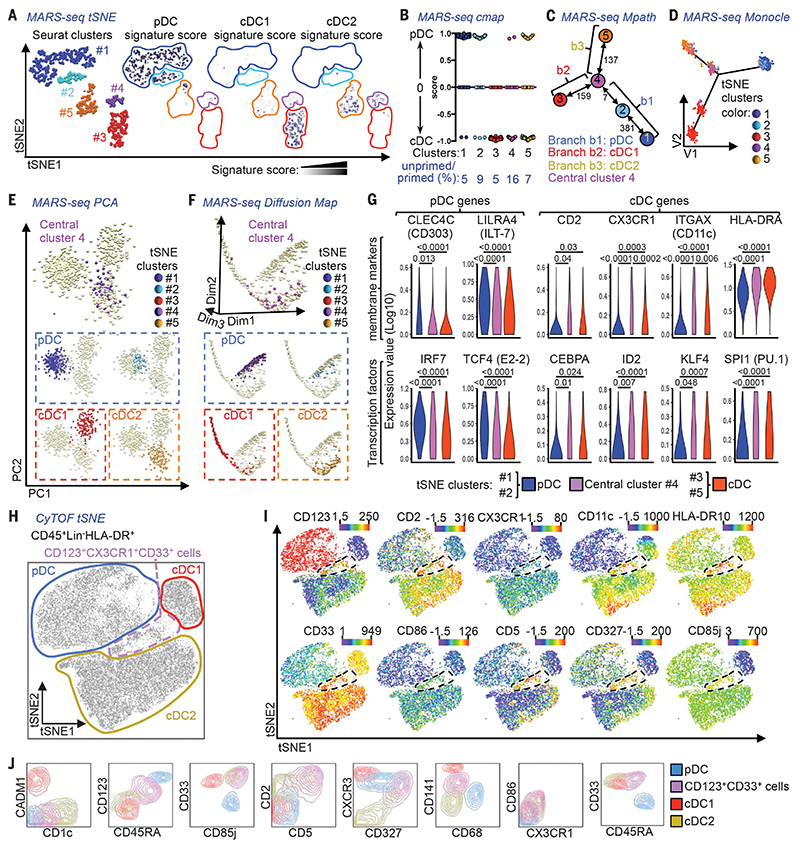
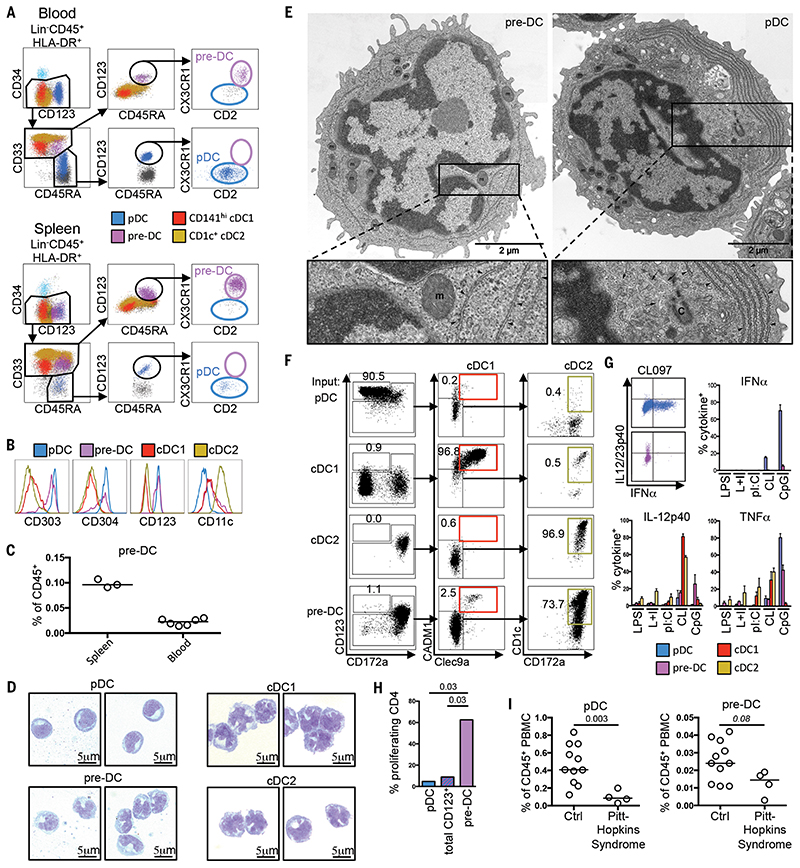
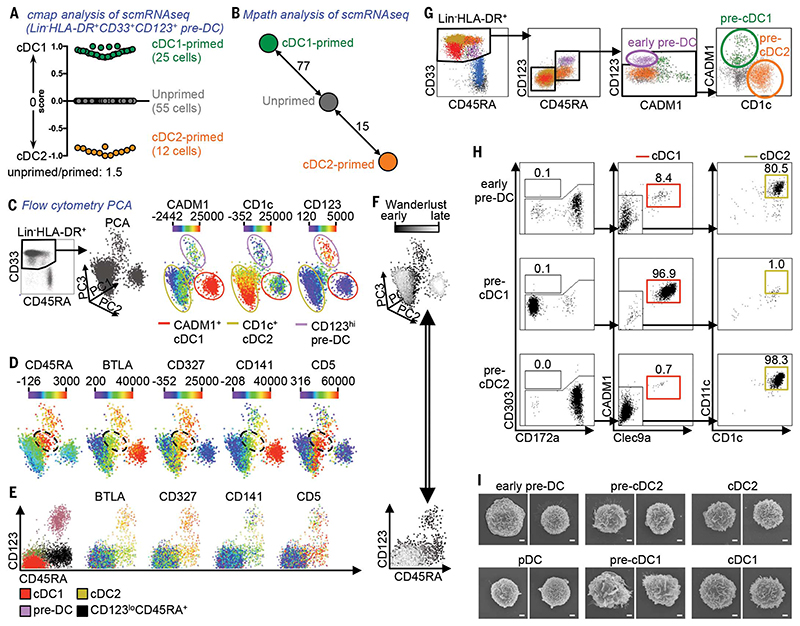
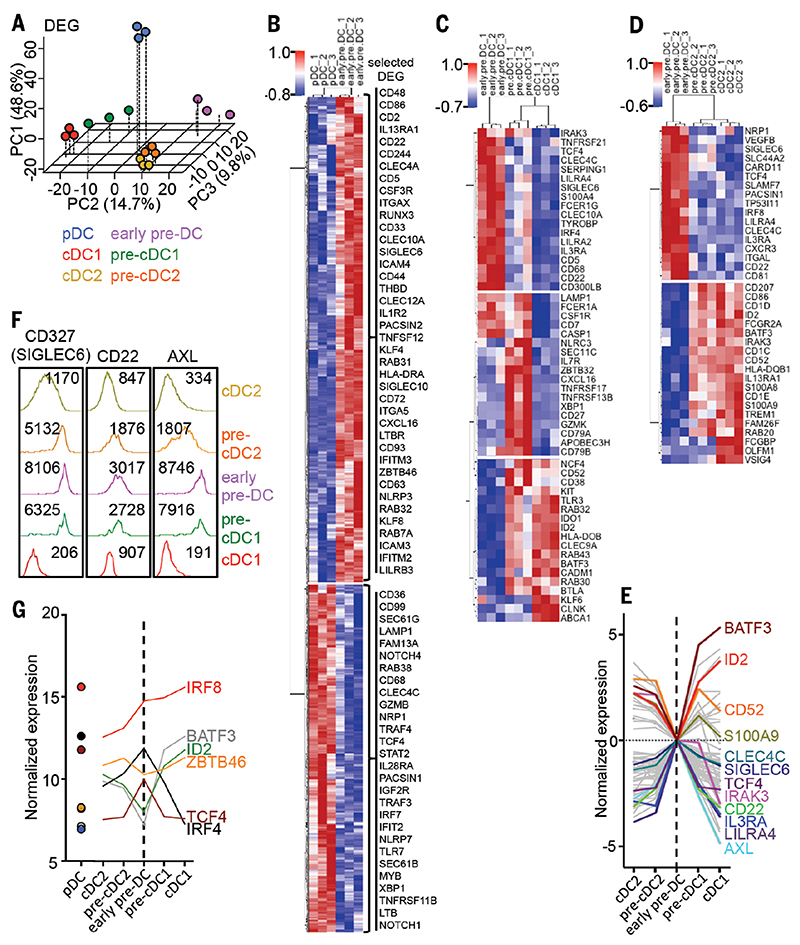
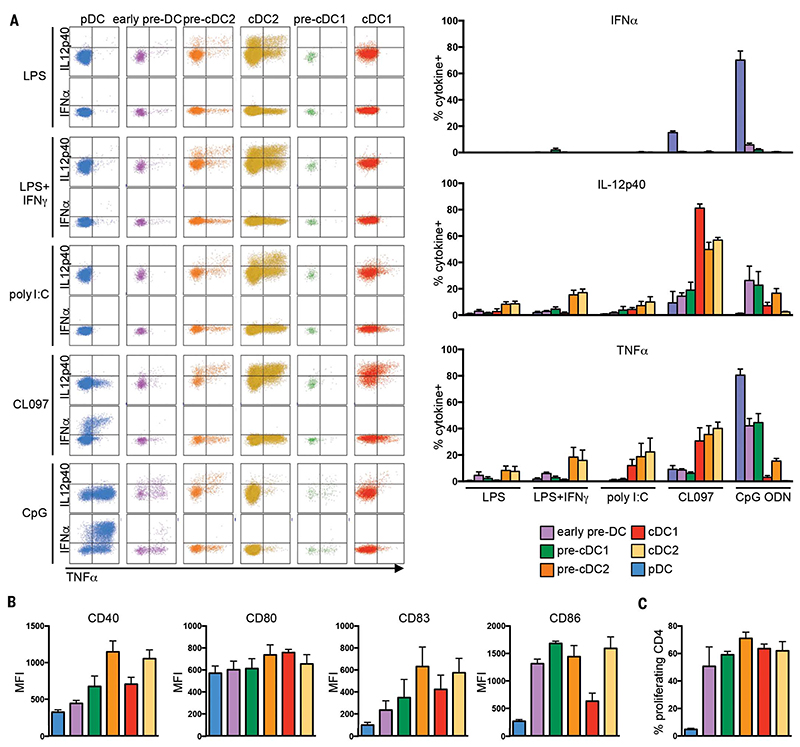
Dendritic cells (DC) are professional antigen-presenting cells that orchestrate immune responses. The human DC population comprises two main functionally specialized lineages, whose origins and differentiation pathways remain incompletely defined. Here, we combine two high-dimensional technologies-single-cell messenger RNA sequencing (scmRNAseq) and cytometry by time-of-flight (CyTOF)-to identify human blood CD123+CD33+CD45RA+ DC precursors (pre-DC). Pre-DC share surface markers with plasmacytoid DC (pDC) but have distinct functional properties that were previously attributed to pDC. Tracing the differentiation of DC from the bone marrow to the peripheral blood revealed that the pre-DC compartment contains distinct lineage-committed subpopulations, including one early uncommitted CD123high pre-DC subset and two CD45RA+CD123low lineage-committed subsets exhibiting functional differences. The discovery of multiple committed pre-DC populations opens promising new avenues for the therapeutic exploitation of DC subset-specific targeting.


Figures

None
Human DC emerge from BM CDP, diverge at the point of emergence of pre-DC and pDC potential, and culminate in maturation of both lineages in the blood.
The pre-DC compartment further differentiates into functionally and phenotypically distinct lineage-committed subpopulations, including one early uncommitted CD123+ pre-DC subset (early pre-DC), which give rise to both cDC1 and cDC2 through corresponding CD45RA+CD123b pre-cDC1 and pre-cDC2 lineage-committed subsets, respectively.
Fig. 1
Fig. 1. MARS-seq and CyTOF identify rare CD123+CD33+ putative DC precursors (pre-DC).
Lin(CD3/CD14/CD16/CD20/CD34)”HLA-DR+CD135+ sorted PBMC were subjected to MARS-seq. (A) t-stochastic neighbor embedding (tSNE) plot of 710 cells fulfilling all quality criteria, colored by clusters identified by tSNE plus Seurat clustering, or by the relative signature score for pDC, cDC1, and cDC2. (B) Connectivity map (cmap) analysis showing the degree of enrichment for pDC or cDC signature genes in the tSNE/Seurat clusters. (C) Mpath analysis applied to the tSNE/Seurat clusters defining their developmental relationship. Representations of the 710 cells by (D) Monocle, (E) PCA, and (F) Diffusion map, highlighting the tSNE/Seurat clusters identified in (A). (G) Violin plots of tSNE/Seurat pDC clusters, cluster #4, and cDC clusters showing the expression of pDC and cDC signature genes with differential expression between cluster #4 and pDC clusters. Adjusted P values calculated by Kruskal-Wallis test followed by Dunn’s multiple comparisons procedure. (H and I) tSNE plots of CyTOF data from CD45+Lin(CD7/CD14/CD15/CD16/CD19/CD34)HLA-DR+ PBMC, showing (H) gates defining the CD123+CD33+ cells and DC subsets and (I) relative expression of selected markers. (J) Subsets defined in (H) were overlaid onto 2D-contour plots for phenotypic comparison. The gating strategy before MARS-seq is shown in fig. S1a.
Fig. 2
Fig. 2. Characterization of human pre-DC.
(A) Flow cytometric identification of pre-DC and pDC within PBMC and spleen cell suspensions. (B) Expression of CD303/CD304/CD123/CD11c by blood pre-DC and DC subsets. (C) % pre-DC within spleen (n = 3) and PBMC (n = 6) CD45+ populations. (D) Wright-Giemsa staining of sorted blood pre-DC and DC subsets. (E) Electron micrographs of pre-DC and pDC [RER (arrowheads), centriole (C), and microtubules (small arrows) near RER cisterna are indicated]. (F) DC subsets or pre-DC were cocultured for 5 days with MS-5 feeder cells, FLT3L, GM-CSF, and SCF. Their capacity to differentiate into cDC1 or cDC2 was measured by flow cytometry (n = 3). (G) Intracellular detection of cytokines in DC subsets and pre-DC post-TLR stimulation. TNF-α and IL-12p40 production by pDC and pre-DC, alongside mean % cytokine-positive pre-DC and DC subsets exposed to LPS, LPS+IFN-γ (L+I), polyI:C (pI:C), CL097 (CL), or CpG-ODN2216 (CpG) (n = 4). (H) Proliferation of naïve CD4+ Tcells cultured for 6 days with allogeneic pDC, total CD123+HLA-DR+ cells, or pre-DC (n = 2). (I) Frequency of pDC and pre-DC from control subjects (Ctrl) (n = 11) and Pitt-Hopkins syndrome (PHS) patients (n = 4). P values calculated by Mann-Whitney test. Error bars, mean ± SEM.
Fig. 3
Fig. 3. Identification of committed human pre-DC subsets.
(A and B) Single-cell mRNA sequencing (scmRNAseq) of 92 Lin(CD3/14/16/19/20)”HLA-DR+CD33+CD123+ cells (sort gating strategy in fig. S8a). (A) Connectivity map (cmap) enrichment score of cells (cDC1-versus cDC2-specific signatures). (B) Mpath analysis showing the developmental relationship between “unprimed,” cDC1-primed, and cDC2-primed cells defined in (A). (C) Lin”HLA-DR+CD33+ PBMC analyzed by flow cytometry and visualized as 3D-PCA of three cell clusters (pre-DC, cDC1, and cDC2) and the relative expression of CADM1, CD1c, and CD123. (D) Relative expression of CD45RA, BTLA, CD327, CD141, and CD5 in the same 3D-PCA plot. The dashed black circles indicate the intermediate CD45RA+ population. (E) CD45RA/CD123 dot plots showing overlaid cell subsets defined in the 3D-PCA plot (left panel) with the relative expression of BTLA, CD327, CD141, and CD5. (F) Overlay of the Wanderlust dimension [progression from early (dark) to late (clear) events is shown] onto the 3D-PCA and CD45RA/CD123 dot plots. (G) Gating strategy starting from live CD45+Lin(CD3/14/16/19/20)”CD34”HLA-DR+ PBMC to define pre-DC subsets among CD33+CD45RA+ cDC. (H) Pre-DC subsets were cocultured for 5 days with MS-5 feeder cells, FLT3L, GM-CSF, and SCF (n = 3). Their capacity to differentiate into Clec9A+CADM1+ cDC1 (red) or CD1c+CD11c+ cDC2 (beige) was analyzed by flow cytometry. (I) Scanning electron microscopy of pre-DC and DC subsets. Scale bar, 1 μm.
Fig. 4
Fig. 4. DC and pre-DC subset gene expression analysis.
(A) Microarray data from sorted DC and pre-DC subsets (shown in Fig. 3) were analyzed by 3D PCA using differentially expressed genes (DEG). For each PCA dimension (principal component, PC), the variance explained by each component is indicated. (B to D) Heat maps of DEG between (B) early pre-DC/pDC, (C) early pre-DC/pre-cDC1/cDC1, and (D) early pre-DC/pre-cDC2/cDC2. (E) Expression profiles of 62 common genes identified from DEG analysis comparisons along the lineage progression from early pre-DC to mature cDC for cDC1 and cDC2, respectively. The profiles were plotted with the log2 foldchange values (versus early pre-DC). (F) Expression level of CD327 (SIGLEC6), CD22, and AXL proteins by DC and pre-DC subsets evaluated by flow cytometry. The mean fluorescence intensities are indicated. (G) Expression profile of selected transcription factors.
Fig. 5
Fig. 5. Functional analysis of DC and pre-DC subsets.
(A) Frequency of cytokine production by pre-DC and DC subsets upon TLR stimulation was measured by intracellular flow cytometry. Dot plots (left panel) show TNF-α, IL-12p40, and TNFa production by pDC, early pre-DC, pre-DC2, cDC2, pre-DC1, and cDC1. Bar charts (right panel) show the mean relative numbers of pre-DC and DC subset cells producing TNF-α+, IL-12p40+, or TNF-α+ in response to LPS, LPS+IFN-γ (L+I), pI:C, CL097 (CL), or CpG ODN2216 (CpG) (n = 4). (B) Expression level [represented as mean fluorescence intensity (MFI)] of costimulatory molecules (CD40, CD80, CD83, and CD86) by blood pre-DC and DC subsets (n = 4). (C) Proliferation of naïve CD4+ Tcells after 6 days of culture with allogenic pre-DC and DC subsets (n = 3). P values calculated by Mann-Whitney test. Error bars, mean ± SEM.
Fig. 6
Fig. 6. Unsupervised mapping of DC ontogeny using CyTOF.
CyTOF data from bone marrow (BM) and PBMC were analyzed using Isomap dimensionality reduction to compare overall phenotypic relatedness of cell populations and were automatically subdivided into clusters using the phenograph algorithm. (A and B) Isomap plots showing the expression level of common DC progenitor (CDP), pDC, pre-DC, and cDC-specific markers within (A) BM and (B) blood Lin(CD3/CD7/CD14/CD15/CD19/CD34)HLA-DR+CD123+ cells. (C) Phenotypic association between Lin-HLA-DR+CD123hl BM and CD123+ PBMC, showing progression from CDP toward pDC or pre-DC in the BM and the clear separation of pDC and pre-DC in the blood. Cells within the pre-DC phenograph clusters (clusters #1 and #2 in the BM and #6 in the blood) and cells within the pDC phenograph clusters (clusters #3 and #4 in the BM and #7 in the blood) were further analyzed by Isomap to define pre-DC subsets (left panels and fig. S20, c and d) and heterogeneity among pDC (right panels and fig. S20, d and e).In summary, we traced the developmental stages of DC from the BM to the peripheral blood through CyTOF, showing that the CDP population in the BM bifurcates into two pathways, developing into either pre-DC or pDC in the blood (Fig. 6, A to C). This pre-DC population is heterogeneous and exists as distinct subsets detectable in both the blood and BM (Fig. 6C and fig. S20, b and c). Furthermore, we uncovered an intriguing heterogeneity in blood and BM pDC that warrants further investigation (Fig. 6C and fig. S20, d and e).

References

    1. Schlitzer A, McGovern N, Ginhoux F. Dendritic cells and monocyte-derived cells: Two complementary and integrated functional systems. Semin Cell Dev Biol. 2015;41:9–22. doi: 10.1016/Jsemcdb.2015.03.011. - DOI - PubMed
    1. Merad M, Sathe P, Helft J, Miller J, Mortha A. The dendritic cell lineage: Ontogeny and function of dendritic cells and their subsets in the steady state and the inflamed setting. Annu Rev Immunol. 2013;31:563–604. doi: 10.1146/annurev-immunol-020711-074950. - DOI - PMC - PubMed
    1. Guilliams M, et al. Dendritic cells, monocytes and macrophages: A unified nomenclature based on ontogeny. Nat Rev Immunol. 2014;14:571–578. doi: 10.1038/nri3712. - DOI - PMC - PubMed
    1. Liu K, et al. In vivo analysis of dendritic cell development and homeostasis. Science. 2009;324:392–397. - PMC - PubMed
    1. Ginhoux F, et al. The origin and development of nonlymphoid tissue CD103+DCs. J Exp Med. 2009;206:3115–3130. doi: 10.1084/jem.20091756. - DOI - PMC - PubMed

Publication types