. 2017 Apr 20:11:93.
doi: 10.3389/fncel.2017.00093. eCollection 2017.

Mechanical Strain Promotes Oligodendrocyte Differentiation by Global Changes of Gene Expression

Affiliations

Mechanical Strain Promotes Oligodendrocyte Differentiation by Global Changes of Gene Expression

Anna Jagielska et al. Front Cell Neurosci. .

Abstract

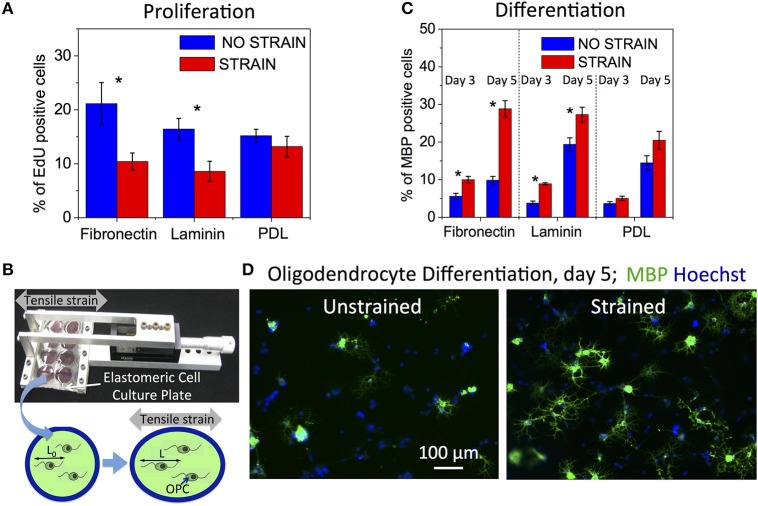
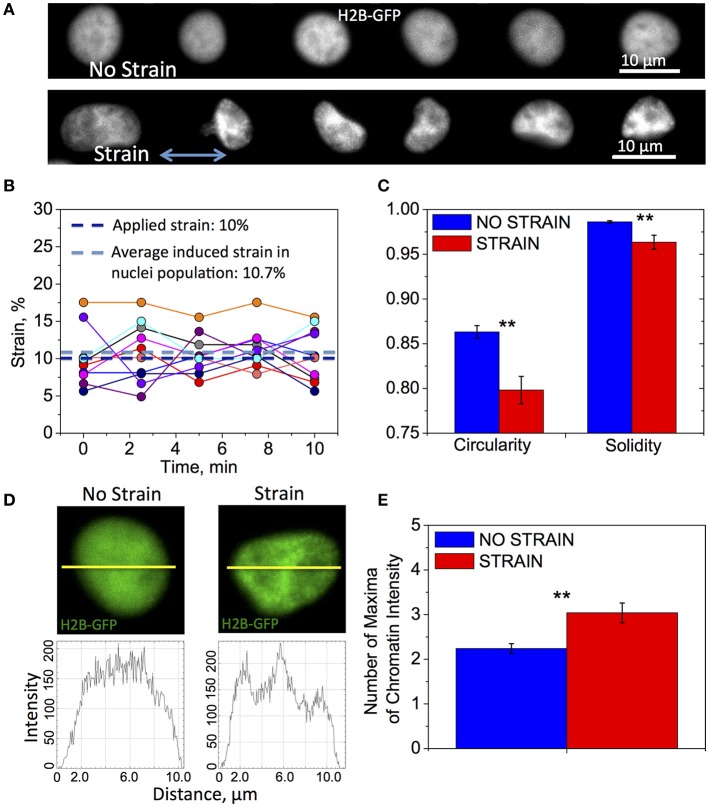
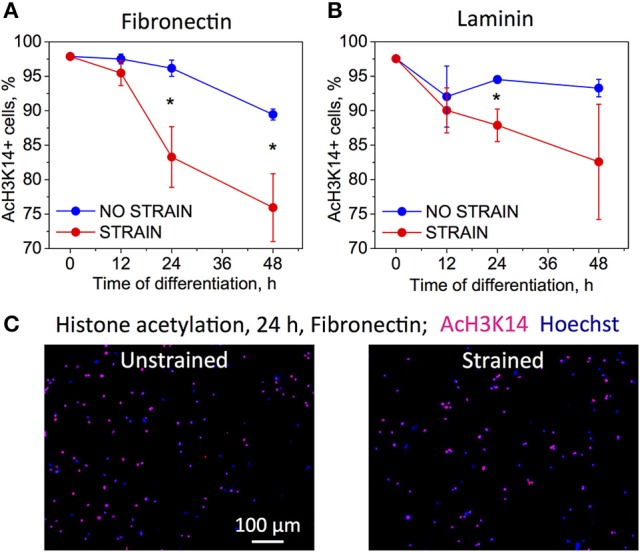
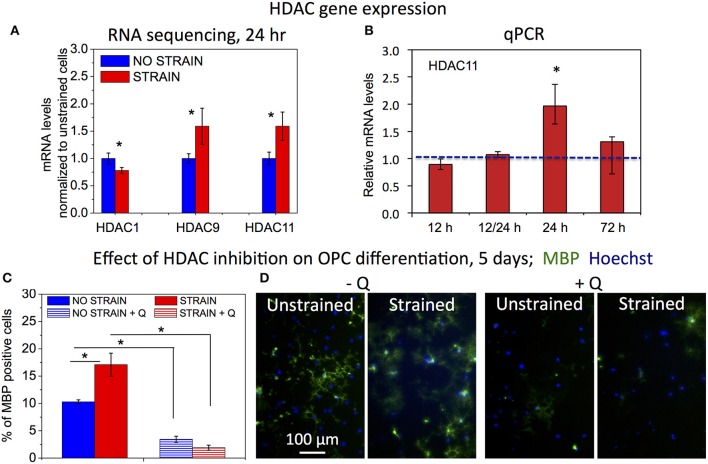
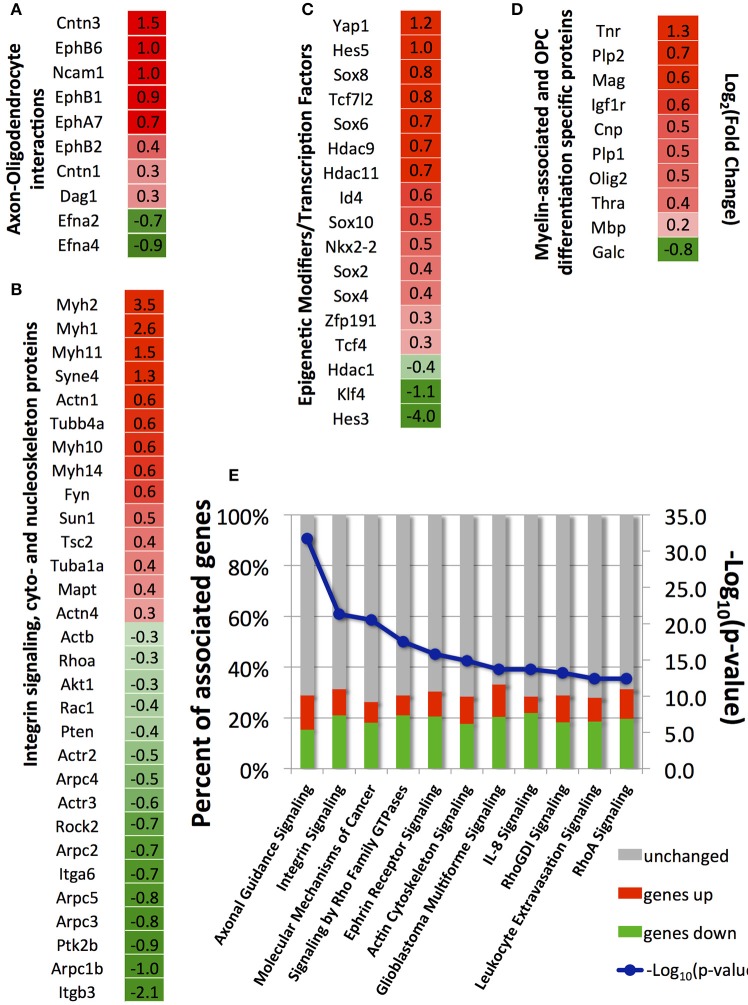
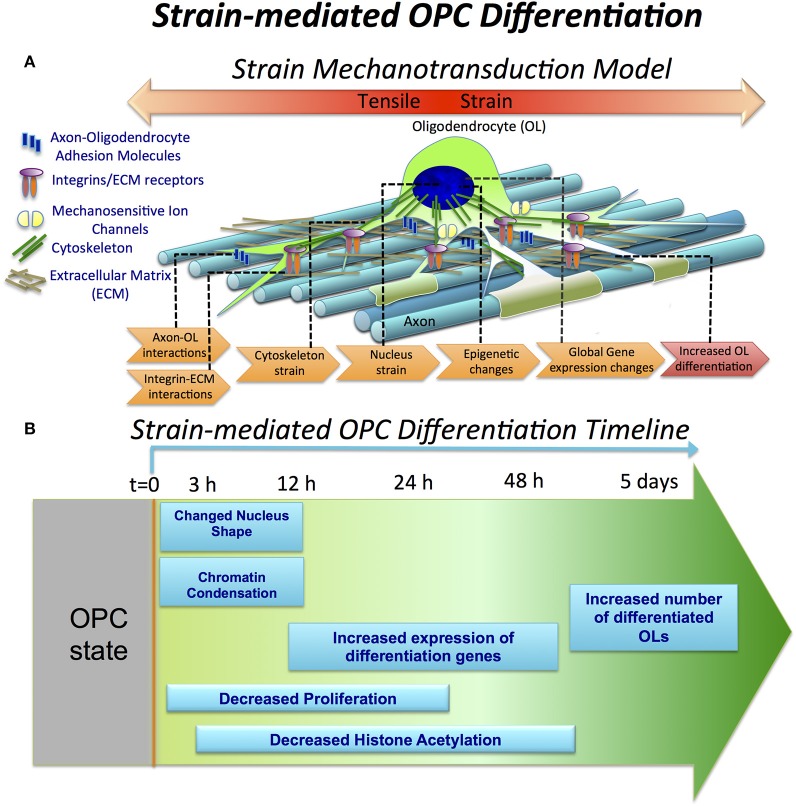
Differentiation of oligodendrocyte progenitor cells (OPC) to oligodendrocytes and subsequent axon myelination are critical steps in vertebrate central nervous system (CNS) development and regeneration. Growing evidence supports the significance of mechanical factors in oligodendrocyte biology. Here, we explore the effect of mechanical strains within physiological range on OPC proliferation and differentiation, and strain-associated changes in chromatin structure, epigenetics, and gene expression. Sustained tensile strain of 10-15% inhibited OPC proliferation and promoted differentiation into oligodendrocytes. This response to strain required specific interactions of OPCs with extracellular matrix ligands. Applied strain induced changes in nuclear shape, chromatin organization, and resulted in enhanced histone deacetylation, consistent with increased oligodendrocyte differentiation. This response was concurrent with increased mRNA levels of the epigenetic modifier histone deacetylase Hdac11. Inhibition of HDAC proteins eliminated the strain-mediated increase of OPC differentiation, demonstrating a role of HDACs in mechanotransduction of strain to chromatin. RNA sequencing revealed global changes in gene expression associated with strain. Specifically, expression of multiple genes associated with oligodendrocyte differentiation and axon-oligodendrocyte interactions was increased, including cell surface ligands (Ncam, ephrins), cyto- and nucleo-skeleton genes (Fyn, actinins, myosin, nesprin, Sun1), transcription factors (Sox10, Zfp191, Nkx2.2), and myelin genes (Cnp, Plp, Mag). These findings show how mechanical strain can be transmitted to the nucleus to promote oligodendrocyte differentiation, and identify the global landscape of signaling pathways involved in mechanotransduction. These data provide a source of potential new therapeutic avenues to enhance OPC differentiation in vivo.

Keywords: cell nucleus shape; chromatin remodeling; mechanical strain; mechanotransduction; multiple sclerosis (MS); oligodendrocyte differentiation; oligodendrocyte precursor cell (OPC); oligodendrocytes.


Figures

Figure 1
Figure 1
Effect of static strain on OPC proliferation and differentiation, on fibronectin, laminin, or poly-D-lysine (PDL) coated PDMS substrates. (A) Proliferation under static strain (15%), expressed as percentage of EdU-positive cells. (B) Schematic of tensile strain transfer to cells via custom stretcher that applies strain to the elastomeric plate on which cells are grown. Stretching of elastomeric plate results in elongation of cells adhered to the plate surface. (C) Differentiation under static strain (10%) at 3 and 5 days of strain duration, expressed as percentage of MBP-positive cells. (D) Representative fluorescence images of immunostaining against MBP (green) and nuclei staining (Hoechst, blue) at day 5 of differentiation, for unstrained and strained cell populations. Blue bars, unstrained samples; red bars, strained samples. N ≥ 6 experiments per condition; Average number of cells analyzed per condition: proliferation—8,076, differentiation—2,212; Error bars are SEM (standard error of the mean); *p < 0.05.
Figure 2
Figure 2
Differences in nuclear shape and chromatin organization between unstrained and strained OPCs. Time-lapse fluorescence images for data in subfigures (A,C–E) of H2B-GFP expressing nuclei in live OPCs were collected within the first 3 h of strain duration; for data in (B) GFP-NLS nuclei were imaged within first 10 min of strain duration. (A) Representative chromatin structures for unstrained (top) and strained (bottom) OPC nuclei. Blue arrow shows direction of tensile strain; (B) Strain (elongation) of OPC nuclei along strain directions measured during 10 min of 10% applied strain; Dark blue line, applied strain (10%); Light blue line, strain induced on nuclei, averaged over 10 analyzed nuclei (10.7%); Circles, strain exerted on nucleus at each time point; each color represents different nucleus (N = 10); (C) Average nucleus circularity and solidity for unstrained (blue) and strained (red) OPC populations; (D) Examples of nuclei (top) for unstrained (left) and strained (right) nuclei, and corresponding chromatin intensity profiles (bottom) along nuclear diameter (yellow line); (E) Chromatin condensation extent, expressed as average number of chromatin fluorescence intensity maxima along major or minor axis, for unstrained (blue) and strained (red) OPC populations. N > 20 nuclei per condition; Error bars are SEM (Standard error of the mean); **p < 0.01.
Figure 3
Figure 3
Effect of strain on histone acetylation in OPCs on (A) fibronectin, and (B) laminin coated PDMS substrates, for time points 0–48 h of strain duration and incubation in differentiating media. Acetylation expressed as percentage of cells that immunostained against acetyl group on histone 3, lysine 14 residue (AcH3K14). Blue bars, unstrained samples; red bars, strained samples (static strain of 10%); (C) Examples of fluorescence images quantified in (A,B) for unstrained and strained OPCs, at 24 h strain duration on fibronectin; blue, nuclear staining with Hoechst; pink, overlap with red color staining for AcH3K14. N = 4 experiments per timepoint; Average number of cells analyzed per timepoint: 1,069; Error bars are SEM (Standard error of the mean). *p < 0.05.
Figure 4
Figure 4
Effect of HDAC inhibition on strain-mediated OPC differentiation. (A) mRNA levels of histone deacetylases (HDACs) for unstrained (blue) and strained (red) OPC populations (normalized by values for unstrained cell populations), obtained from Illumina RNA sequencing; mRNA collected after 24 h of strain (10%) applied to cells cultured on laminin coated PDMS plates. N = 2 for strained and N = 3 for unstrained samples. (B) mRNA levels of Hdac11 in strained OPCs (red) relative to unstrained controls (normalized to 1—blue line), obtained from qPCR for different durations of applied static strain (10%): 12 h, 12/24 h—12 h strain followed by 12 h strain release (RNA levels tested at total of 24 h after strain initiation), 24 h, and 72 h. Hdac11 gene expression was significantly higher in strained samples after 24 h of applied strain (p = 0.004), in agreement with RNA sequencing data. N = 3 independent samples per condition. (C) Effect of HDAC inhibition with Quisinostat on OPC differentiation measured after 5 days of strain (10%) applied to cells cultured on laminin coated PDMS plates, and expressed as percentage of MBP-positive cells. Blue, unstrained, untreated sample; blue stripes, unstrained sample, treated with Quisinostat (Q, 100 pM); red, strained, untreated sample; red stripes, strained sample, treated with Quisinostat. (D) Examples of fluorescence images quantified in (C) for unstrained and strained OPCs, without (−Q) and with (+Q) Quisinostat; blue, nuclear staining with Hoechst; green, immunostaining against MBP. For (C,D) N ≥ 2 samples per condition; for (C,D) average number of cells analyzed per condition: 1,130; error bars are SEM (Standard error of the mean); *p < 0.05.
Figure 5
Figure 5
Selected differentially expressed genes between strained and unstrained OPC populations. (A) Genes involved in axon-oligodendrocyte interactions; (B) Genes involved in integrin signaling and cyto- and nucleo-skeleton remodeling; (C) Epigenetic modifiers and transcription factors; (D) Genes associated with myelin and OPC differentiation markers. (A–D) Column 1—gene_id. Column 2—log2 (fold-change), where fold-change is a ratio of mean gene expression level for stretched OPC samples to the mean gene expression level of control (unstrained) OPC samples; Color scale: red, genes upregulated in stretched samples [positive log2 (fold-change) values]; intensity increases with increasing relative expression level in stretched samples; green, genes downregulated in stretched samples [negative log2 (fold-change) values]; intensity increases with decreasing relative expression level in stretched samples. (E) Top canonical pathways (lowest p-value) associated with differentially expressed genes identified by Ingenuity Pathway analysis; blue, –log10(p-value); bars, percent of upregulated (red), downregulated (green), and unchanged (gray) genes in stretched samples with respect to unstrained control; Number of independent samples: N = 3 for unstrained and N = 2 for strained conditions.
Figure 6
Figure 6
Strain-mediated OPC differentiation. (A) Hypothetical model of strain mechanotransduction in OPCs. Based on our data, applied tensile strain is transferred via axon-OPC and ECM-OPC interaction interfaces to OPC cytoskeleton, and then to the cell nucleus, where it changes chromatin structure and epigenetic regulation, resulting in global changes in gene expression and increased OPC differentiation. (B) Schematic of OPC response to tensile strain, as a function of differentiation time and strain duration. Observations are expressed as relative to the unstrained OPC nuclei. OPC differentiation (t = 0) is initiated by removal of growth factors from both strained and unstrained OPC cultures and concurrent application of static tensile strain to “strained” cell population. Within the first 3 h, nucleus elongation and chromatin condensation are observed in strained nuclei. From t = 12 to 48 h, histone H3 deacetylation increases (lysine 14). This is correlated with upregulation of many differentiation genes measured at t = 24 h. OPC proliferation is inhibited under strain, quantified at t = 24 h in non-differentiation media (containing growth factors). At extended strain duration of t = 5 days, a greater number of MBP-positive cells, indicating increased OPC differentiation, is observed.

Similar articles

Cited by

References

    1. Ahmed W. W., Williams B. J., Silver A. M., Saif T. A. (2013). Measuring nonequilibrium vesicle dynamics in neurons under tension. Lab Chip 13, 570–578. 10.1039/c2lc41109a - DOI - PubMed
    1. Amano M., Nakayama M., Kaibuchi K. (2010). Rho-kinase/ROCK: a key regulator of the cytoskeleton and cell polarity. Cytoskeleton 67, 545–554. 10.1002/cm.20472 - DOI - PMC - PubMed
    1. Anders S., Huber W. (2010). Differential expression analysis for sequence count data. Genome Biol. 11:R106. 10.1186/gb-2010-11-10-r106 - DOI - PMC - PubMed
    1. Arulmoli J., Pathak M. M., McDonnell L. P., Nourse J. L., Tombola F., Earthman J. C., et al. . (2015). Static stretch affects neural stem cell differentiation in an extracellular matrix-dependent manner. Sci. Rep. 5:8499. 10.1038/srep08499 - DOI - PMC - PubMed
    1. Baer A. S., Syed Y. A., Kang S. U., Mitteregger D., Vig R., ffrench-Constant C., et al. . (2009). Myelin-mediated inhibition of oligodendrocyte precursor differentiation can be overcome by pharmacological modulation of Fyn-RhoA and protein kinase C signalling. Brain 132(Pt 2), 465–481. 10.1093/brain/awn334 - DOI - PMC - PubMed