. 2017 Apr 20:8:147.
doi: 10.3389/fneur.2017.00147. eCollection 2017.

The Subiculum: A Potential Site of Ictogenesis in a Neonatal Seizure Model

Affiliations

The Subiculum: A Potential Site of Ictogenesis in a Neonatal Seizure Model

Xin-Xin Wang et al. Front Neurol. .

Abstract

Studies have reported that the subiculum is one origin of interictal-like discharges in adult patients with temporal lobe epilepsy; however, whether the subiculum represents a site of ictogenesis for neonatal seizures remains unclear. In this study, multi-electrode recording techniques were used to record epileptiform discharges induced by low-Mg2+ or high-K+ artificial cerebrospinal fluid in neonatal mouse hippocampal slices, and the spatiotemporal dynamics of the epileptiform discharges were analyzed. The Na+-K+-2Cl- cotransporter 1 (NKCC1) blocker, bumetanide, was applied to test its effect upon epileptiform discharges in low-Mg2+ model. The effect of N-methyl-d-aspartate receptors (NMDARs) antagonist, d-AP5, upon the epileptiform discharges in high-K+ model was examined. We found that the neonatal subiculum not only relayed epileptiform discharges emanating from the hippocampus proper (HP) but also initiated epileptiform discharges (interictal- and ictal-like discharges) independently. The latency to onset of the first epileptiform discharge initiated in the subiculum was similar to that initiated in the HP. Bumetanide efficiently blocked seizures in the neonatal HP, but was less effectively in suppressing seizures initiated in the subiculum. In high-K+ model, d-AP5 was more effective in blocking seizures initiated in the subiculum than that initiated in the HP. Furthermore, Western blotting analysis showed that NKCC1 expression was lower in the subiculum than that in the HP, whereas the expression of NMDAR subunits, NR2A and NR2B, was higher in the subiculum than that in the HP. Our results revealed that the subiculum was a potential site of ictogenesis in neonatal seizures and possessed similar seizure susceptibility to the HP. GABAergic excitation resulting from NKCC1 may play a less dominant role during ictogenesis in the subiculum than that in the HP. The subicular ictogenesis may be related to the glutamatergic excitation mediated by NMDARs.

Keywords: N-methyl-d-aspartate receptors; Na+–K+–2Cl− cotransporter 1; hippocampus proper; neonatal seizures; subiculum.


Figures
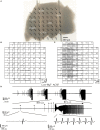
Figure 1
Figure 1
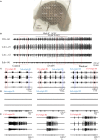
One example slice and low-Mg2+-induced epileptiform discharges. (A) An image of a hippocampal slice mounted on micro-electrode array (MEA). The black dots stand for the electrodes, with electrode number labeled at its top left corner. The slice is composed of the hippocampus proper (DG, CA3a/b/c, CA1) and the subiculum (Sub). (B,C) Low-Mg2+-induced interictal-like discharges (IIDs) (B) and ictal-like discharges (IDs) (C) recorded by the MEA. Each window represents the recording from one electrode, with each electrode number labeled at its top right corner. (D) The upper trace exhibits a period (−2,100 s) of data recorded by one electrode (number 27) in (A), which represents four discharge cycles in the CA3. The middle trace displays one of the four discharge cycles in the upper trace in an expanded time scale, which consists of six IIDs (*) and one ID (→). The lower trace further shows one IID and the ID in the middle trace in a more expanded time scale.
Figure 2
Figure 2
Initiation and propagation of the ictal-like discharges (IDs) and interictal-like discharges (IIDs). (A) Examples of the two types of contour plots for the relative onset-time delays of one single ID (a,b) and IID (c,d) in the slice shown in Figure 1A. (B) Two types of contour plots for the averaged relative onset-time delays of all the IDs (a,b) and IIDs (c,d) in the slice shown in Figure 1A. The number of the electrodes (black dots) were denoted by the x and y coordinates. The color bar represents the relative onset-time delays. The different color in different regions symboled the initiate sites and propagation pathways. The epileptiform discharges had two initiations (dark blue regions), CA3a/b (Aa, Ac, Ba, Bc) and the subiculum (Ab, Ad, Bb, Bd). The CA3-origin epileptiform discharges initiated in CA3a/b and propagated bidirectionally to the CA1, subiculum (anterograde), to the CA3c, and DG (retrograde). The Sub-origin epileptiform discharges initiated in the subiculum and did not propagate backward to the CA1. (C) The quantitative analysis pertaining to the initiations of the IIDs (a) and IDs (b) in the 21 slices.
Figure 3
Figure 3
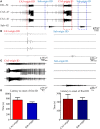
CA3- and Sub-origin epileptiform discharges. (A) Epileptiform discharges recorded by four electrodes (numbers 54, 27, 41, 82) in the slice shown in Figure 1A, which represents the epileptiform discharges in the DG, CA3, CA1, and subiculum, respectively. The red and blue rectangles represent the CA3- and Sub-origin epileptiform discharges, respectively. (B) The interictal-like discharges (IIDs) in rectangles in (A) are displayed in an expanded time scale. (C) The ictal-like discharges (IDs) in rectangles in (A) are shown on an expanded time scale. (D) Latency to onset of the first CA3-origin ID/IID in the hippocampus proper and Sub-origin ID/IID in the subiculum. Data were presented as mean ± SEM. There was no significant difference between them (P > 0.05, paired t-test, n = 21).
Figure 4
Figure 4
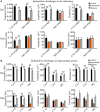
Parameters of CA3- and Sub-origin ictal-like discharges (IDs)/interictal-like discharge (IIDs). (A,B) The frequency, amplitude and duration of CA3- and Sub-origin IDs (A) and IIDs (B). Data were presented as mean ± SEM. There was no significant difference between the frequencies of CA3- and Sub-origin IDs/IIDs (P > 0.05, paired t-test, n = 21). The amplitude of CA3-origin epileptiform discharges in CA3 was significantly higher than that of the Sub-origin epileptiform discharges in the subiculum (**P < 0.01, paired t-test, n = 21). The duration of CA3-origin IDs was significantly longer than that of Sub-origin IDs (**P < 0.01, paired t-test, n = 21). The duration of CA3-origin IIDs was significantly shorter than that of the Sub-origin IIDs (*P < 0.05, paired t-test, n = 21).
Figure 5
Figure 5
Effect of bumetanide upon the CA3- and Sub-origin epileptiform discharges. (A) An example slice mounted on micro-electrode array. (B) The long-term display of the epileptiform discharges before (−2,700 s), during (−7,200 s), and after (−4,455 s) bumetanide application, which were recorded by four electrodes (numbers 54, 27, 22, 83) in (A), corresponding to the epileptiform discharges in the DG, CA3, CA1, and subiculum, respectively. (C) The CA3- and Sub-origin epileptiform discharges in the rectangles (−1,200 s) in (B), corresponding to the epileptiform discharges before (Control), during (Bumetanide), and after (Washout) bumetanide application. The red and blue rectangles represented the CA3- and Sub-origin epileptiform discharges, respectively. (D) The waveforms of the Sub-origin ictal-like discharges (IDs)/interictal-like discharges (IIDs), corresponding to the blue rectangles (−9 s) in (C) in an expanded time scale. (E) The waveforms of the CA3-origin IDs/IIDs, corresponding to the red rectangles (−30 s) in (C) in an expanded time scale.
Figure 6
Figure 6
The effect of bumetanide upon the parameters of epileptiform discharges. (A) The effect of bumetanide upon the CA3- and Sub-origin epileptiform discharges in the subiculum. During bumetanide application, the CA3-origin ictal-like discharges (IDs) were reversely abolished. The frequencies of Sub-origin IDs and CA3-origin interictal-like discharges (IIDs) were significantly lower than those before/after bumetanide application [**P < 0.01, one-way analysis of variance (ANOVA), n = 11], whereas their amplitudes and durations were not significantly different (P > 0.05, one-way ANOVA, n = 11). During bumetanide application, the parameters of Sub-origin IIDs were not significantly different with those before/after bumetanide application (P > 0.05, one-way ANOVA, n = 11). (B) The effect of bumetanide upon the epileptiform discharges in the hippocampus proper (HP). The effect of bumetanide upon the IDs/IIDs in HP was similar to that upon the CA3-origin IDs/IIDs in the subiculum.
Figure 7
Figure 7
The effect of bumetanide upon the initiation and propagation of interictal-like discharges (IIDs). (A–C) The contour plots for the averaged relative onset-time delays of IIDs before (A), during (B), and after (C) bumeatnide application in the slice shown in Figure 5A. The number of the electrodes (black dots) were denoted by the x and y coordinates. The color bar represents the relative onset-time delays. The different color in different regions symboled the initiate sites and propagation pathways. During bumetanide application, the IIDs had two initiations, CA3a/b (Ba) and the subiculum (Bb), the CA3-origin IIDs (Ba) initiated in the CA3a/b, propagated bidirectionally to CA1, subiculum (anterograde) and CA3c, DG (retrograde). The Sub-origin IIDs (Bb) initiated in the subiculum and did not propagate backward to the CA1. The two initiations and two corresponding propagation patterns of IIDs were not significantly different with those before/after bumetanide application.
Figure 8
Figure 8
Effect of d-AP5 upon the CA3- and Sub-origin epileptiform discharges. (A) An example slice mounted on micro-electrode array. (B) The long-term display of the epileptiform discharges before (−2,560 s), during (−3,600 s), and after (−2,726 s) d-AP5 application, which were recorded by four electrodes (numbers 66, 25, 52, 86) in (A), corresponding to the epileptiform discharges induced by high-K+ artificial cerebrospinal fluid in the DG, CA3, CA1, and subiculum, respectively. (C) The CA3- and Sub-origin epileptiform discharges in the rectangles (−900 s) in (B), corresponding to the epileptiform discharges before (Control), during (d-AP5), and after (Washout) d-AP5 application. The red and blue rectangles represented the CA3- and Sub-origin epileptiform discharges, respectively. (D) The waveforms of the Sub-origin ictal-like discharges (IDs)/interictal-like discharge (IIDs), corresponding to the blue rectangles (−30 s) in (C) in an expanded time scale. (E) The waveforms of the CA3-origin IDs/IIDs, corresponding to the red rectangles (−60 s) in (C) in an expanded time scale.
Figure 9
Figure 9
The effect of d-AP5 upon the parameters of epileptiform discharges. (A) The effect of d-AP5 upon the CA3- and Sub-origin epileptiform discharges in the subiculum. During d-AP5 application, the Sub-origin ictal-like discharges (IDs) were abolished; the frequencies, amplitudes, and durations of Sub-origin interictal-like discharge (IIDs) and CA3-origin IDs/IIDs were not significantly different with the Control/Washout group [P > 0.05, one-way analysis of variance (ANOVA), n = 5]. (B) The effect of d-AP5 upon the epileptiform discharges in the hippocampus proper (HP). The effect of d-AP5 upon the IDs/IIDs in the HP was similar to that upon the CA3-origin IDs/IIDs in the subiculum.
Figure 10
Figure 10
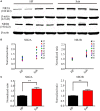
Na+–K+–2Cl cotransporter 1 (NKCC1) expression level in the hippocampus proper (HP) and the subiculum. (A) One example of Western blots of the NKCC1 in the HP and the subiculum (Sub). (B,C) Protein levels were quantified by densitometric signals obtained from Western blots, the level of NKCC1 protein in the subiculum were normalized to this protein level in the HP. The normalized protein levels in each mouse were displayed in (B), and the averaged normalized protein levels of eight mice were displayed in (C). The level of NKCC1 protein was significantly higher in the HP than that in the subiculum (**P < 0.01, paired t-test, n = 8).
Figure 11
Figure 11
NR2A and NR2B expression levels in the hippocampus proper (HP) and the subiculum. (A) Examples of Western blots of the NR2A and NR2B in the HP and the subiculum (Sub). (B,C) Protein levels were quantified by densitometric signals obtained from Western blots. NR2A and NR2B protein levels in the subiculum were normalized to the corresponding protein level in the HP. The normalized protein levels in each mouse were displayed in (B), and the averaged normalized protein levels of eight mice were displayed in (C). The levels of NR2A and NR2B protein in HP were significantly lower than that in the subiculum (**P < 0.01, paired t-test, n = 8).

Similar articles

Cited by

References

    1. Khanna A, Walcott BP, Kahle KT. Limitations of current GABA agonists in neonatal seizures: toward GABA modulation via the targeting of neuronal Cl(-) transport. Front Neurol (2013) 4:78.10.3389/fneur.2013.00078 - DOI - PMC - PubMed
    1. Ronen GM, Penney S, Andrews W. The epidemiology of clinical neonatal seizures in Newfoundland: a population-based study. J Pediatr (1999) 134(1):71–5.10.1016/S0022-3476(99)70374-4 - DOI - PubMed
    1. Glass HC, Sullivan JE. Neonatal seizures. Curr Treat Options Neurol (2009) 11(6):405–13.10.1007/s11940-009-0045-1 - DOI - PubMed
    1. Ronen GM, Buckley D, Penney S, Streiner DL. Long-term prognosis in children with neonatal seizures: a population-based study. Neurology (2007) 69(19):1816–22.10.1212/01.wnl.0000279335.85797.2c - DOI - PubMed
    1. Kirmse K, Witte OW, Holthoff K. GABAergic depolarization during early cortical development and implications for anticonvulsive therapy in neonates. Epilepsia (2011) 52(9):1532–43.10.1111/j.1528-1167.2011.03128.x - DOI - PubMed