. 2017 Apr;12(2):124-138.
doi: 10.1007/s11515-017-1447-1. Epub 2017 Mar 8.

The radial organization of neuronal primary cilia is acutely disrupted by seizure and ischemic brain injury

Affiliations

The radial organization of neuronal primary cilia is acutely disrupted by seizure and ischemic brain injury

Gregory W Kirschen et al. Front Biol (Beijing). 2017 Apr.

Abstract

Background: Neuronal primary cilia are sensory organelles that are critically involved in the proper growth, development, and function of the central nervous system (CNS). Recent work also suggests that they signal in the context of CNS injury, and that abnormal ciliary signaling may be implicated in neurological diseases.

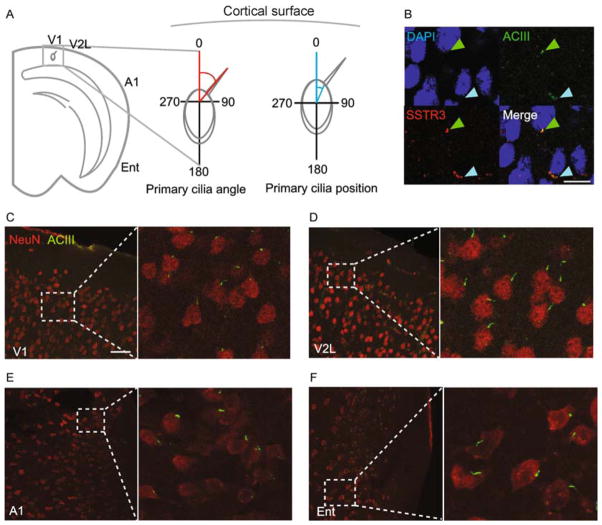
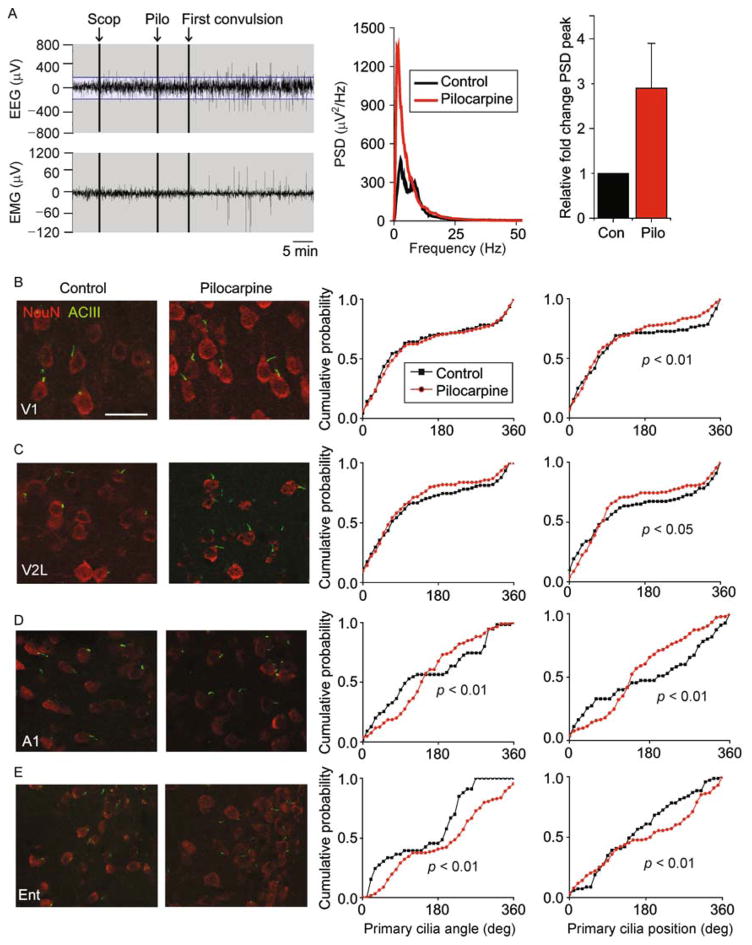
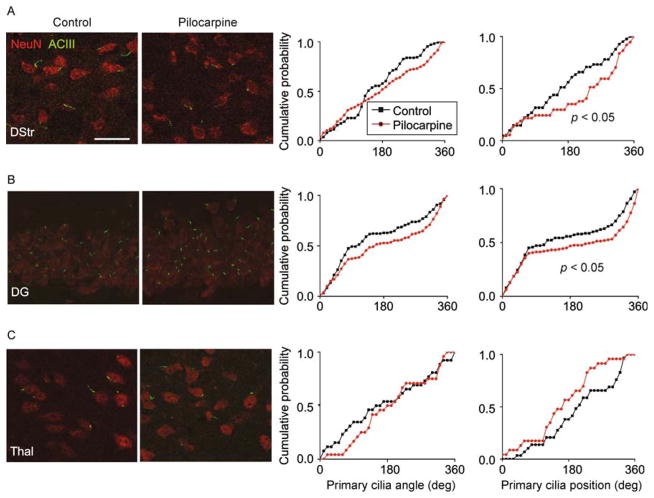
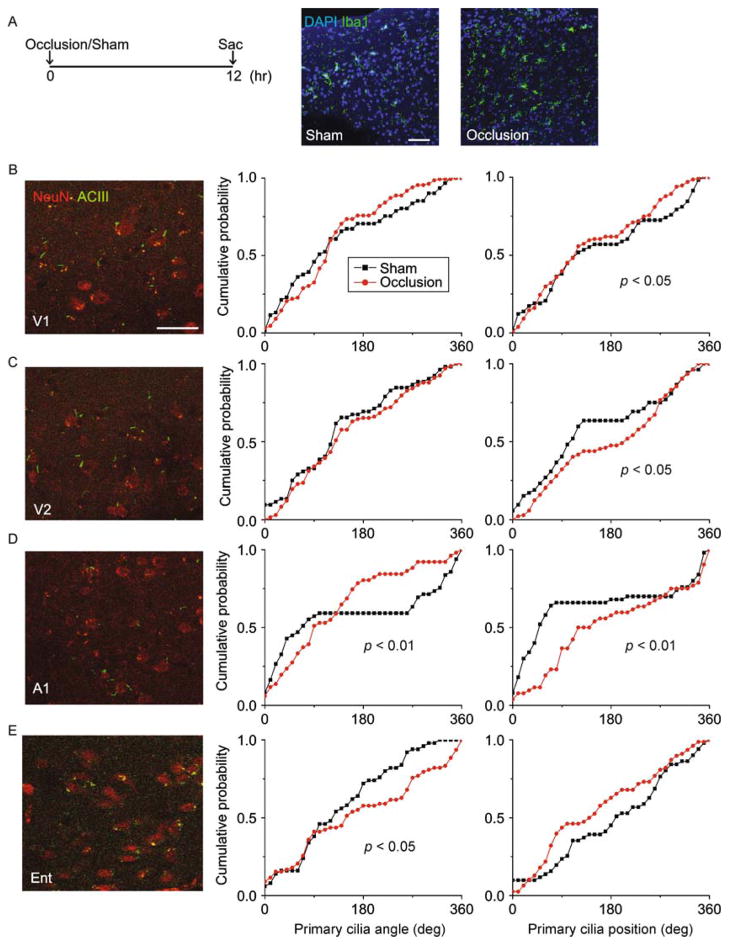
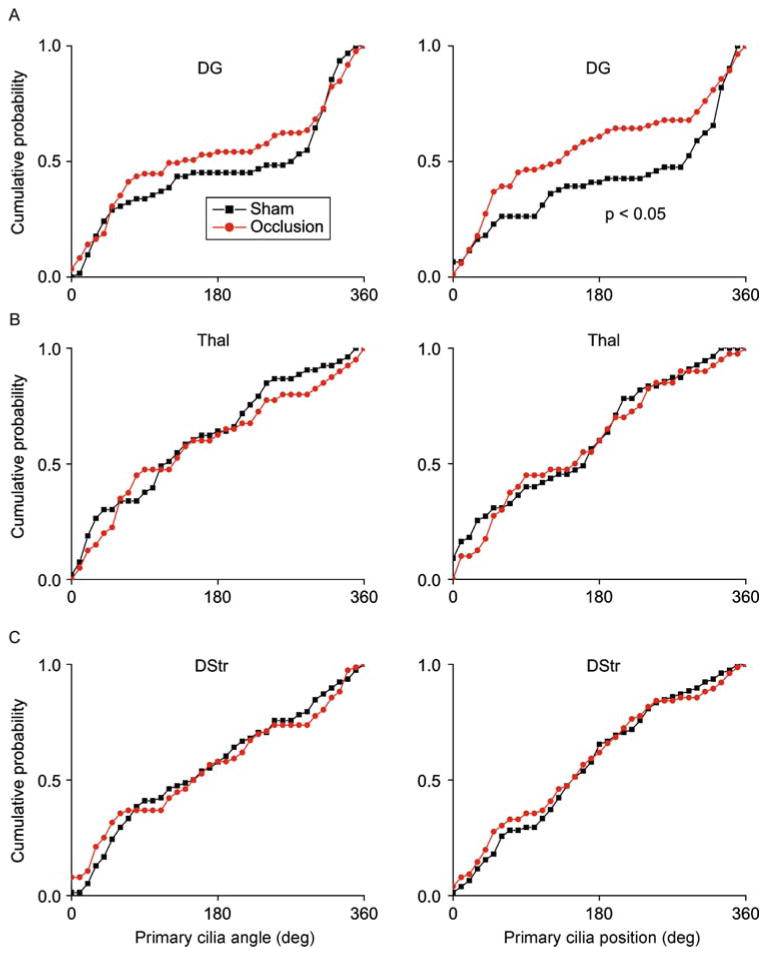
Methods: We quantified the distribution of neuronal primary cilia alignment throughout the normal adult mouse brain by immunohistochemical staining for the primary cilia marker adenylyl cyclase III (ACIII) and measuring the angles of primary cilia with respect to global and local coordinate planes. We then introduced two different models of acute brain insult-temporal lobe seizure and cerebral ischemia, and re-examined neuronal primary cilia distribution, as well as ciliary lengths and the proportion of neurons harboring cilia.

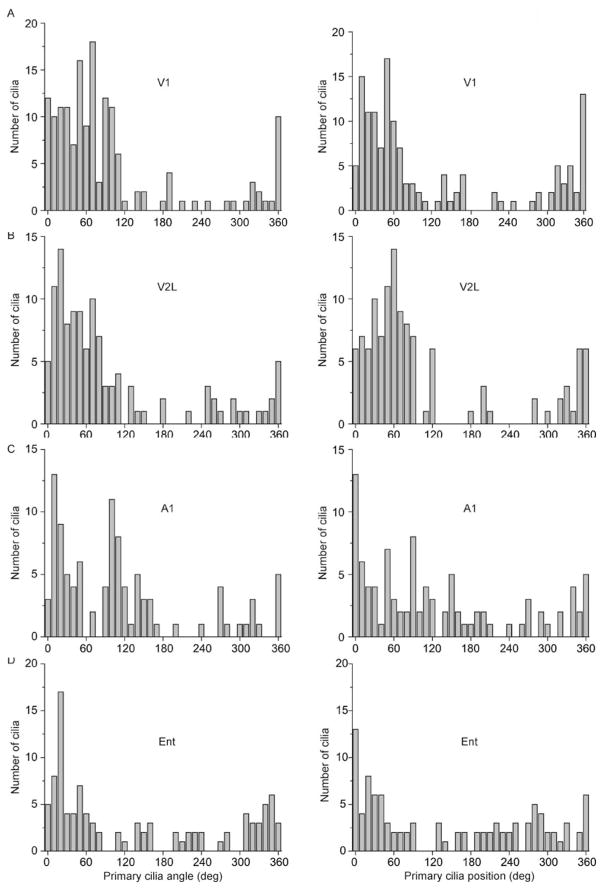
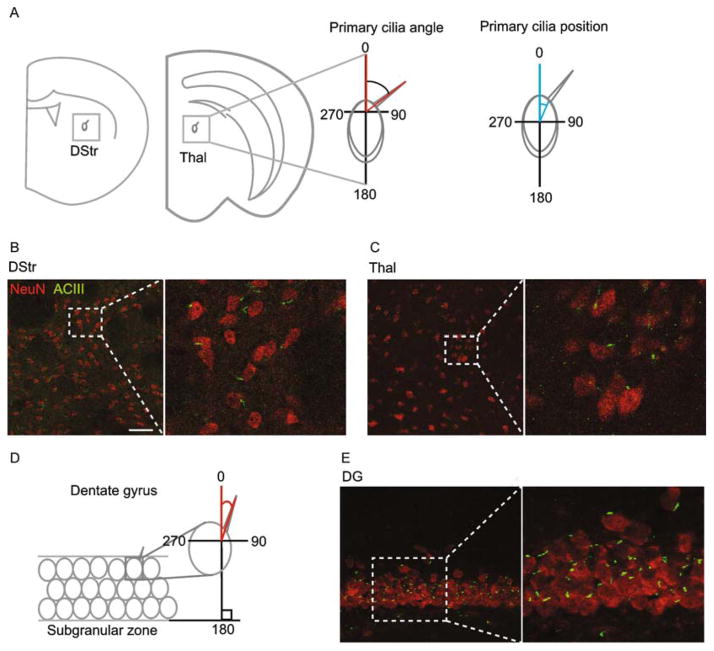
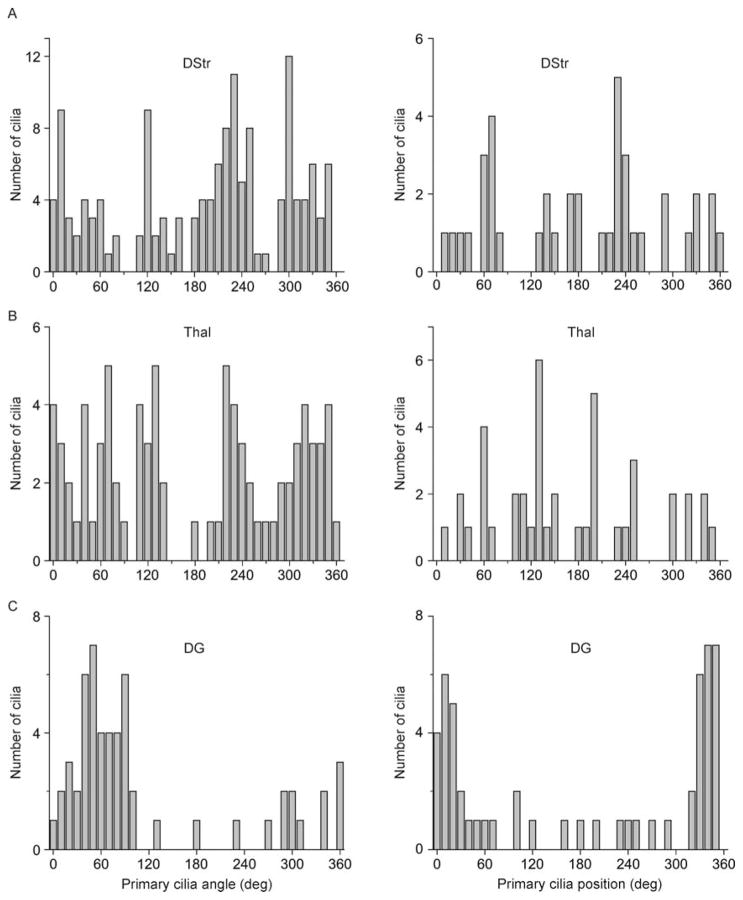
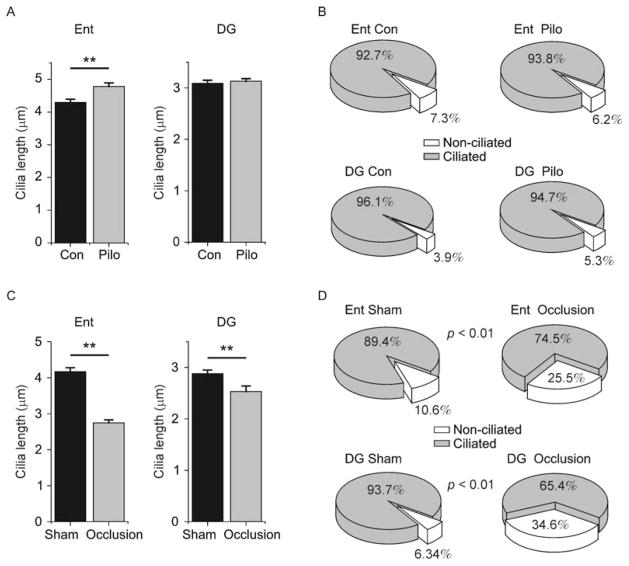
Results: Under basal conditions, cortical cilia align themselves radially with respect to the cortical surface, while cilia in the dentate gyrus align themselves radially with respect to the granule cell layer. Cilia of neurons in the striatum and thalamus, by contrast, exhibit a wide distribution of ciliary arrangements. In both cases of acute brain insult, primary cilia alignment was significantly disrupted in a region-specific manner, with areas affected by the insult preferentially disrupted. Further, the two models promoted differential effects on ciliary lengths, while only the ischemia model decreased the proportion of ciliated cells.

Conclusions: These findings provide evidence for the regional anatomical organization of neuronal primary cilia in the adult brain and suggest that various brain insults may disrupt this organization.

Keywords: cerebral cortex; cerebral ischemia; dentate gyrus; temporal lobe seizure.


Figures

Figure 1
Figure 1
Neuronal primary cilia are radially aligned throughout the cortex. (A) Shown is a schematic of the primary cilia angle and position measurements (°). (B) Shown is a representative image of a cell stained for adenylyl cyclase III and somatostatin receptor 3 (SSTR3). The scale bar is 30 μm. (C) Shown is a representative image of neurons and their primary cilia in area V1. The scale bar is 50 μm. (D) Shown is a representative image of neurons and their primary cilia in area V2L. (E) Shown is a representative image of neurons and their primary cilia in area A1. (F) Shown is a representative image of neurons and their primary cilia in area Ent.
Figure 2
Figure 2
Neuronal primary cilia alignment in the cortex. (A) Shown are the distribution of angles (°) of primary cilia with respect to the cortical surface (left) and with respect to the soma (right) in area V1. (B) Shown are the distribution of angles (°) of primary cilia with respect to the cortical surface (left) and with respect to the soma (right) in area V2L. (C) Shown are the distribution of angles (°) of primary cilia with respect to the cortical surface (left) and with respect to the soma (right) in area A1. (D) Shown are the distribution of angles (°) of primary cilia with respect to the cortical surface (left) and with respect to the soma (right) in area Ent. Angle: N = 159 cells (V1), 116 cells (V2L), 102 cells (A1), 101 cells (Ent); Position: N = 141 cells (V1), 118 cells (V2L), 102 cells (A1), 101 cells (Ent) from 4 animals.
Figure 3
Figure 3
Neuronal primary cilia alignment in dorsal striatum, thalamus, and dentate gyrus. (A) Shown is a schematic of the primary cilia angle and position measurements (°) in dorsal striatum (DStr) and thalamus (Thal). (B) Shown is a representative image of neurons and their primary cilia in the dorsal striatum. The scale bar is 50 μm. (C) Shown is a representative image of neurons and their primary cilia in the anterior nucleus of the thalamus. (D) Shown is a schematic of the primary cilia angle measurement in the dentate gyrus (DG) with respect to the subgranular zone (SGZ). (E) Shown is a representative image of neurons and their primary cilia in the DG. N = 4 animals.
Figure 4
Figure 4
Distribution of neuronal primary cilia angles and positions in dorsal striatum, thalamus, and dentate gyrus. (A) Shown are the distribution of angles (left) and positions (right) of primary cilia with respect to the cortical surface (°) in DStr. (B) Shown are the distribution of angles (left) and positions (right) of primary cilia with respect to the cortical surface (°) in Thal. (C) Shown are the distribution of angles (left) and positions (right) of primary cilia with respect to the cortical surface (°) in DG. Angle: N = 142 cells (DStr), 82 cells (Thal), 55 cells (DG); Position: N = 40 cells (DStr), 43 cells (Thal), 55 cells (DG) from 4 animals.
Figure 5
Figure 5
Pilocarpine-induced seizure disrupted primary cilia alignment in cortical neurons. (A) On the left are representative EEG and EMG traces taken from an animal injected with scopolamine (Scop) followed by pilocarpine (Pilo). The corresponding power spectrum density graph is shown in the center. On the right is a graph of the peak power for all animals in the Contrl (Con) and Pilo groups. (B) Shown on the left are representative images of neurons and their primary cilia in area V1 in the control and pilocarpine conditions. On the right are distribution plots of primary cilia angle and position (°). The scale bar is 30 μm. (C) Shown on the left are representative images of neurons and their primary cilia in area V2L in the control and pilocarpine conditions. On the right are distribution plots of primary cilia angle and position (°). (D) Shown on the left are representative images of neurons and their primary cilia in area A1 in the control and pilocarpine conditions. On the right are distribution plots of primary cilia angle and position (°). (E) Shown on the left are representative images of neurons and their primary cilia in area Ent in the control and pilocarpine conditions. On the right are distribution plots of primary cilia angle and position (°). Two-sample Kolmogorov–Smirnov tests: V1 angle (synonymous with orientation): P >0.05, V1 position: P = 0.001, N = 84 cells (control), 186 cells (pilocarpine); V2L angle P >0.05, V2L position: P = 0.049, N = 105 cells (control), 169 cells (pilocarpine); A1 angle: P = 0.001, A1 position: P <0.001, E1: P <0.001, N = 55 cells (control), 134 cells (pilocarpine); Ent angle: P <0.001, Ent position: P <0.001, N = 68 (control), 128 (pilocarpine) cells from 5 animals per group.
Figure 6
Figure 6
Pilocarpine-induced seizure disrupted primary cilia alignment in hippocampal and striatal neurons. (A) Shown on the left are representative images of neurons and their primary cilia in DStr in the control and pilocarpine conditions. On the right are distribution plots of primary cilia angle and position (°). The scale bar is 30 μm. (B) Shown on the left are representative images of neurons and their primary cilia in DG in the control and pilocarpine conditions. On the right are distribution plots of primary cilia angle and position (°). (C) Shown on the left are representative images of neurons and their primary cilia in Thal in the control and pilocarpine conditions. On the On the right are distribution plots of primary cilia angle and position (°). Two-sample Kolmogorov–Smirnov tests, DStr position: P = 0.014, N = 195 cells (control), 87 cells (pilocarpine), DG position: P = 0.023 N = 140 cells (control), 160 cells (pilocarpine) from 5 animals per group.
Figure 7
Figure 7
Internal carotid artery occlusion disrupted primary cilia alignment in cortical neurons. (A) Shown on the left is the experimental procedure timeline. On the right are representative images of Iba1-stained sections taken from the infarct region from an animal in the occlusion condition side-by-side with a sham-operated control. The scale bar is 50 μm. (B) Shown on the left are representative images of neurons and their primary cilia in area V1 in the occlusion condition. On the right are distribution plots of primary cilia angle and position (°). (C) Shown on the left are representative images of neurons and their primary cilia in area V2L in the occlusion condition. On the right are distribution plots of primary cilia angle and position (°). (D) Shown on the left are representative images of neurons and their primary cilia in area A1 in the occlusion condition. On the right are distribution plots of primary cilia angle and position (°). (E) Shown on the left are representative images of neurons and their primary cilia in area A1 in the occlusion condition. On the right are distribution plots of primary cilia angle and position (°). Two-sample Kolmogorov–Smirnov tests: V1 position: P = 0.039, N = 59 cells (sham), 99 cells (occlusion); V2L position: P = 0.017, N = 53 cells (sham), 132 cells (occlusion); A1 angle: P = 0.004, A1 position: P <0.001, N = 50 cells (sham), 53 cells (occlusion); Ent angle: P = 0.042, N = 51 cells (sham), 83 cells (occlusion) from 3 animals per group.
Figure 8
Figure 8
Internal carotid artery occlusion affected primary cilia alignment in the dentate gyrus but not in striatum or thalamus. (A) Shown are distribution plots of primary cilia angle and position (°) in DG. (B) Shown are distribution plots of primary cilia angle and position (°) in Thal. (C) Shown are distribution plots of primary cilia angle and position (°) in DStr. Two-sample Kolmogorov–Smirnov tests: DG angle: P >0.05, DG position: P = 0.011, N = 61 cells (sham), 85 cells (occlusion); Thal angle: P >0.05, Thal position: P >0.05, N = 55 cells (sham), 40 cells (occlusion); DStr orientation: P >0.05, DStr orientation: P >0.05, N = 78 cells (sham), 76 cells (occlusion).
Figure 9
Figure 9
Primary cilia length and number in seizure and ischemia. (A) Shown are plots of cilia lengths measured in entorhinal cortex (Ent) and dentate gyrus (DG) in mice injected with pilocarpine (Pilo) or saline (Con). Ent con: 4.27±0.11 μm, Ent pilo 4.54±0.11 μm, Kolmogorov–Smirnov test P <0.001, N = 105, 199 cells, respectively; DG con: 3.09±0.06 μm, pilo: 3.13±0.05 μm, Kolmogorov–Smirnov test P >0.05, N = 250 cells/group from 3 animals/group. (B) Shown are pie charts displaying the proportion of neurons containing (gray wedge) or lacking (white wedge) primary cilia in Ent and DG of Pilo and Con animals. Ent con: 190/205 cells ciliated, Ent Pilo: 212/226 cells ciliated, binomial test P >0.05; DG Con: 355/370 cells ciliated, DG Pilo: 319/337 cells ciliated, binomial test P >0.05. (C) Shown are plots of cilia lengths measured in entorhinal cortex (Ent) and dentate gyrus (DG) in mice that received carotid artery occlusion (Occlusion) or sham surgery (Sham). Ent sham: 4.17±0.11 um, Ent occlusion: 2.75±0.08 um, Kolmogorov–Smirnov test P <0.001, N = 150, 161 cells, respectively; DG sham: 2.88±0.07 um, DG occlusion: 2.54±0.11 um, Kolmogorov–Smirnov test P = 0.001, N = 100, 56 cells, respectively. (D) Shown are pie charts displaying the proportion of neurons containing (gray wedge) or lacking (white wedge) primary cilia in Ent and DG of Occlusion and Sham animals. (Ent sham: 186/208 cells ciliated, Ent occlusion: 117/157 cells ciliated, binomial test P <0.001; DG sham: 399/426 cells ciliated, DG occlusion: 219/335 cells ciliated, binomial test P <0.001. ** represents P <0.01.

Similar articles

Cited by

References

    1. Albrecht PJ, Dahl JP, Stoltzfus OK, Levenson R, Levison SW. Ciliary neurotrophic factor activates spinal cord astrocytes, stimulating their production and release of fibroblast growth factor-2, to increase motor neuron survival. Exp Neurol. 2002;173(1):46–62. - PubMed
    1. Benes FM, Berretta S. GABAergic interneurons: implications for understanding schizophrenia and bipolar disorder. Neuropsychopharmacology. 2001;25(1):1–27. - PubMed
    1. Berbari NF, Lewis JS, Bishop GA, Askwith CC, Mykytyn K. Bardet-Biedl syndrome proteins are required for the localization of G protein-coupled receptors to primary cilia. Proc Natl Acad Sci USA. 2008;105(11):4242–4246. - PMC - PubMed
    1. Berbari NF, O’Connor AK, Haycraft CJ, Yoder BK. The primary cilium as a complex signaling center. Curr Biol. 2009;19(13):R526–R535. - PMC - PubMed
    1. Bishop GA, Berbari NF, Lewis J, Mykytyn K. Type III adenylyl cyclase localizes to primary cilia throughout the adult mouse brain. J Comp Neurol. 2007;505(5):562–571. - PubMed

LinkOut - more resources