

Do payers value rarity? An analysis of the relationship between disease rarity and orphan drug prices in Europe
- PMID: 28473888
- PMCID: PMC5405566
- DOI: 10.1080/20016689.2017.1299665
Do payers value rarity? An analysis of the relationship between disease rarity and orphan drug prices in Europe
Abstract
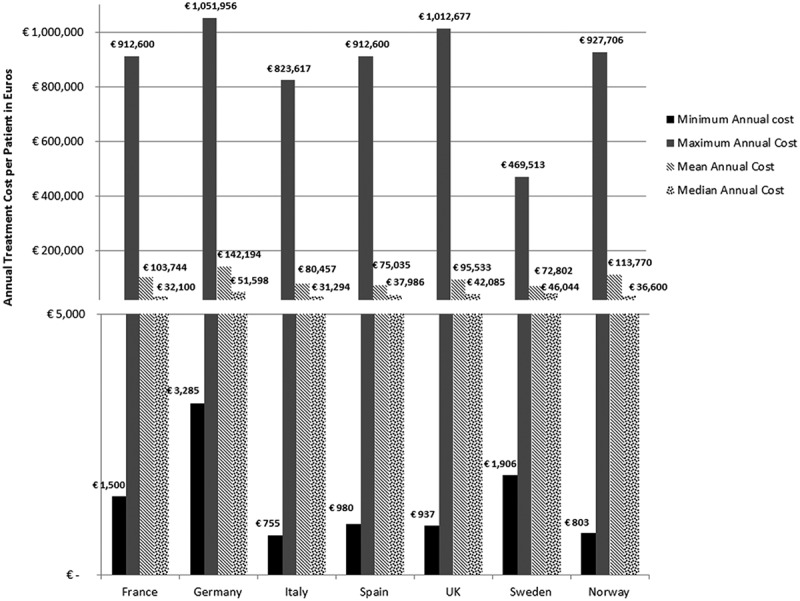
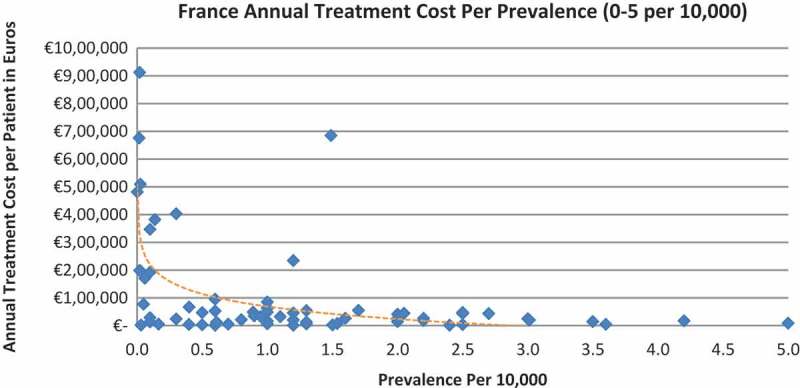
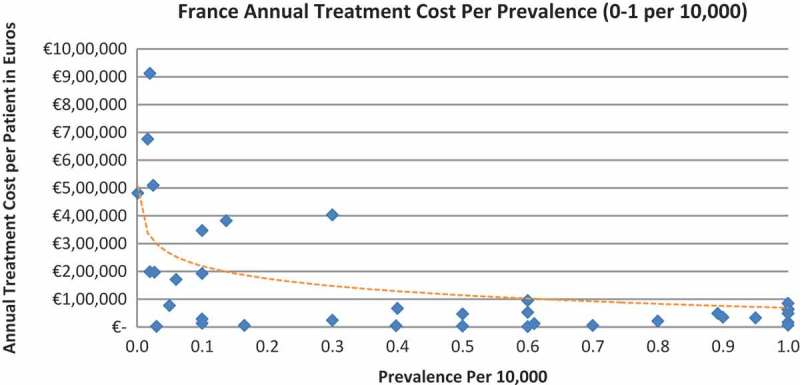
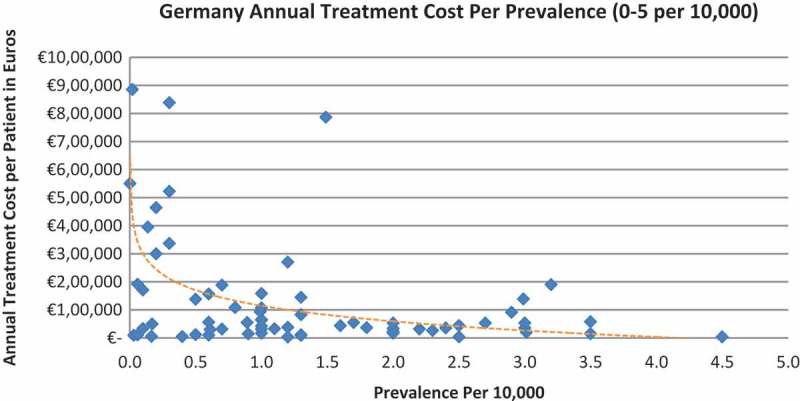
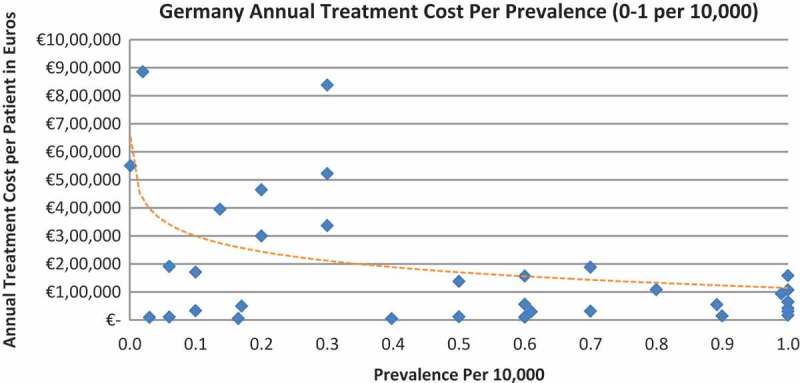
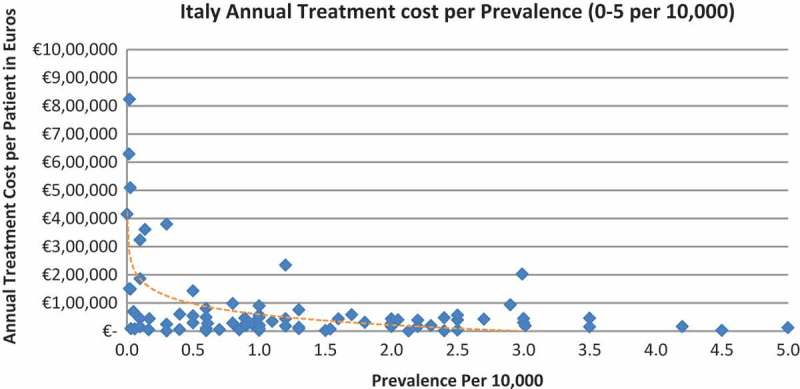
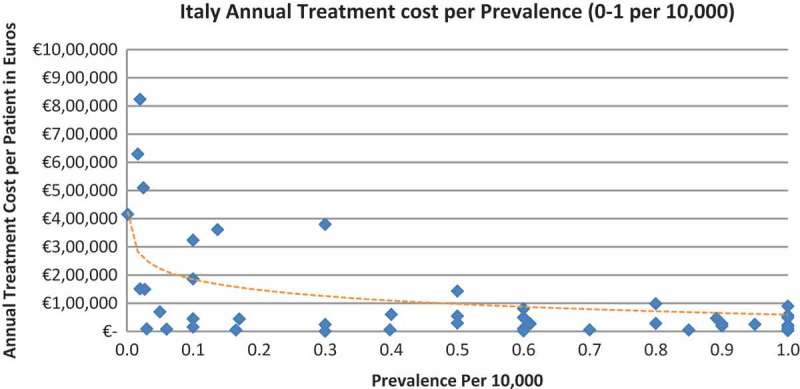
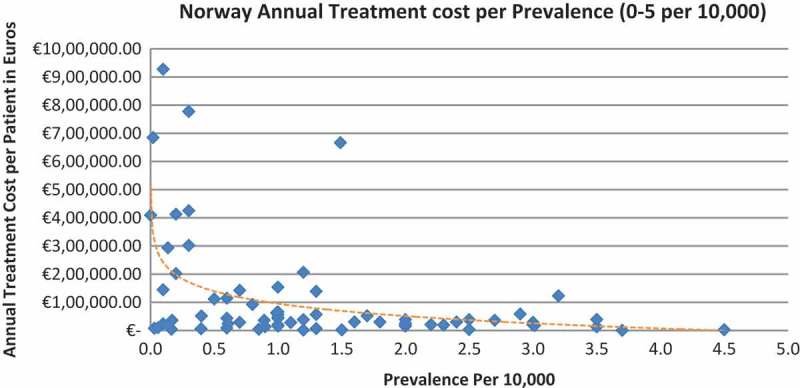
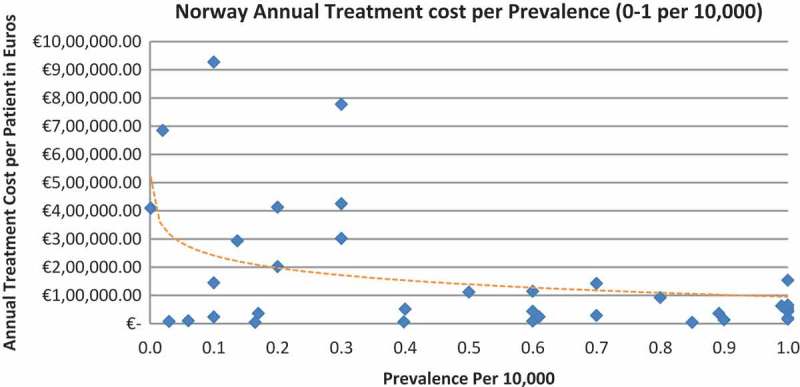
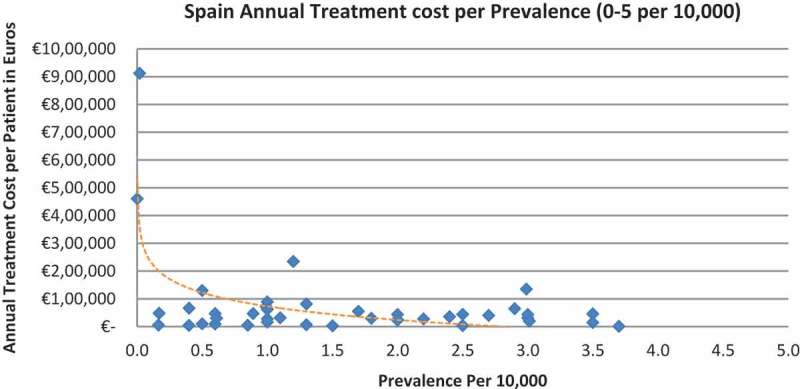
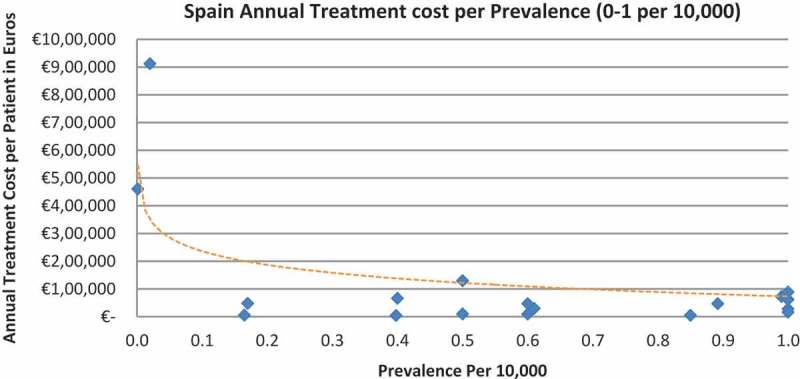
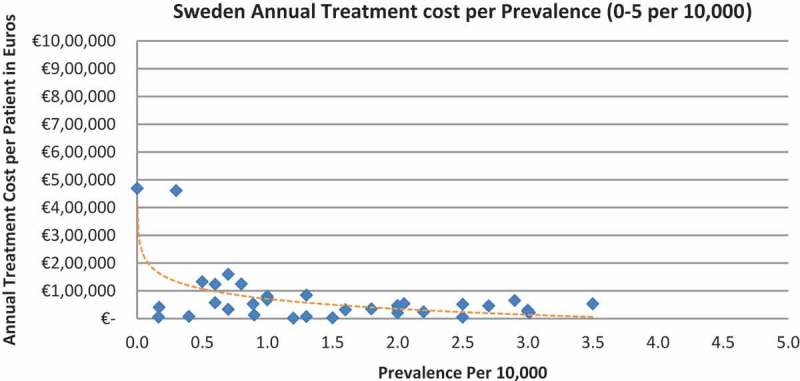
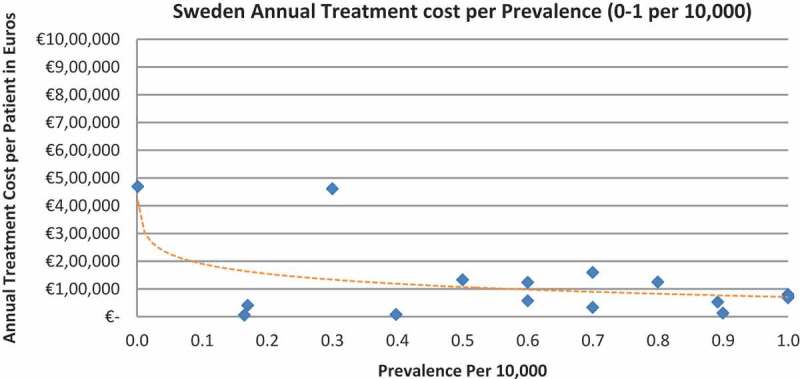
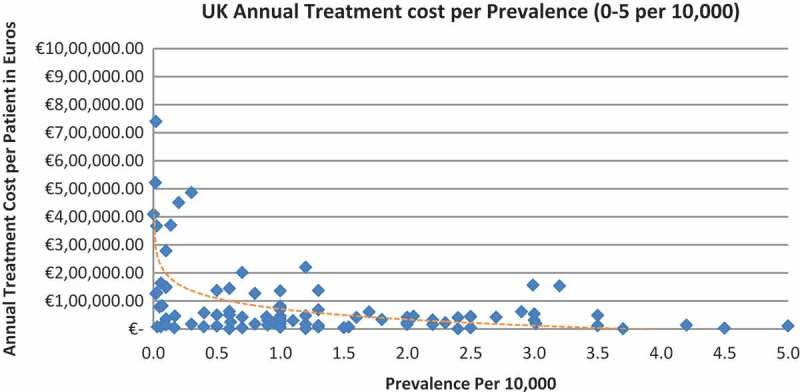
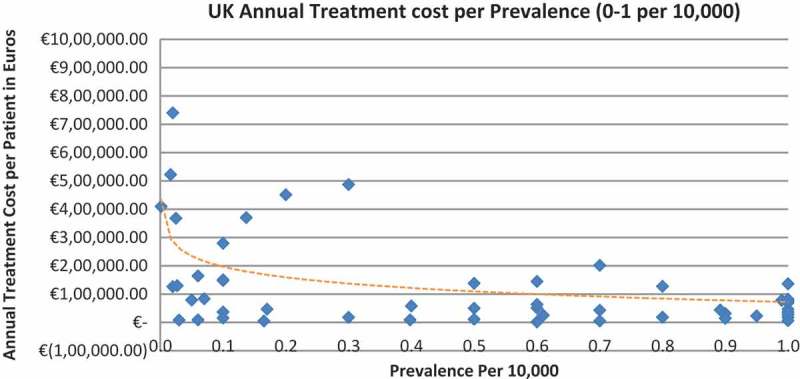
Background and Objective: Orphan drugs have been a highlight of discussions due to their higher prices than non-orphan drugs. There is currently no European consensus on the method of value assessment for orphan drugs. This study assessed the relationship between the prevalence of rare diseases and the annual treatment cost of orphan drugs in France, Germany, Italy, Norway, Spain, Sweden, and UK. Methods: Approved orphan drugs and prevalence data were extracted from the European Medicines Agency website. Annual treatment costs were calculated using ex-factory price. Simple regression was used to analyse the relationship between costs and prevalence. A specific bivariate analysis was performed for the rarest diseases (≤1 per 10,000). Results: 120 drugs were analysed. Prevalence ranged from 0.001 to 5 per 10,000 (mean 1.24, median 1). Annual treatment costs per patient ranged from €755 to €1,051,956 (mean €100,000, median €39,303). Results show a statistically significant inverse correlation between annual treatment cost and disease prevalence in all countries (France: r = -0.370, p = 0.002; Germany: r = -0.365, p = 0.002; Italy: r = -0.340, p = 0.002; Spain: r = -0.316, p = 0.041; UK: r = -0.358, p = 0.0004; Sweden: r = -0.414, p = 0.014; Norway: r = -0.367, p = 0.002). When analysis was focused on the rarest diseases, a stronger correlation exists in all countries (France: r = -0.525, Germany: r = -0.482, Italy: r = -0.497, Spain: r = -0.531, UK: r = -0.436, Sweden: r = -0.455, Norway: r = -0.466; all p < 0.05 except Sweden p = 0.077). Conclusions: This study shows an inverse correlation between annual treatment cost and prevalence with high statistical significance in the studied countries. Although pricing is a complex process where different attributes are assessed, this study supports the idea that payers value rarity in pricing decisions.
Keywords: Europe; Rare diseases; orphan drugs; pricing; treatment cost.
Figures
References
-
- European Medicines Agency (EMA): Orphan drugs and rare diseases at a glance 2007 Jul 13; http://www.ema.europa.eu/docs/en_GB/document_library/Other/2010/01/WC500... cited. 2016. Available from:
-
- NICE Citizens Council Report Ultra Orphan Drugs. 2004 Jul 14; https://www.nice.org.uk/Media/Default/Get-involved/Citizens-Council/Repo... cited. 2016. Available from: - PubMed
-
- Hughes-Wilson W, Palma A, Schuurman A. Paying for the Orphan Drug System: break or bend? Is it time for a new evaluation system for payers in Europe to take account of new rare disease treatments? Orphanet J Rare Dis. 2012 Jul;7:74. http://www.ojrd.com/content/7/1/74 cited. 2016. Available from: - PMC - PubMed
-
- European Commission: Regulation (EC) No. 141/2000 of the European Parliament and of the Council of 16 December 1999 on orphan medicinal products Official Journal of the European Communities L18/1-L18/5 (2000) 2016 Jul; http://eur-lex.europa.eu/LexUriServ/LexUriServ.do?uri=OJ:L:2000:018:0001... cited. Available from:
-
- European Commision Orphan Medicinal Products 2016 Jul 13; http://ec.europa.eu/health/human-use/orphan-medicines/index_en.htm cited. Available from:
LinkOut - more resources
Full Text Sources
Other Literature Sources