. 2017 Aug;38(8):3988-4008.
doi: 10.1002/hbm.23643. Epub 2017 May 5.

Disrupted topological organization of structural networks revealed by probabilistic diffusion tractography in Tourette syndrome children

Affiliations

Disrupted topological organization of structural networks revealed by probabilistic diffusion tractography in Tourette syndrome children

Hongwei Wen et al. Hum Brain Mapp. 2017 Aug.

Abstract

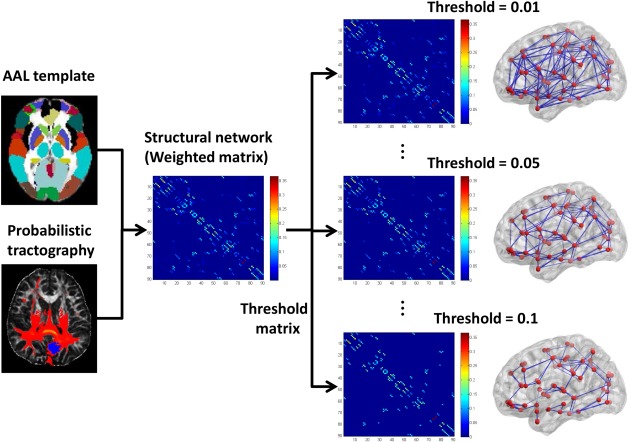
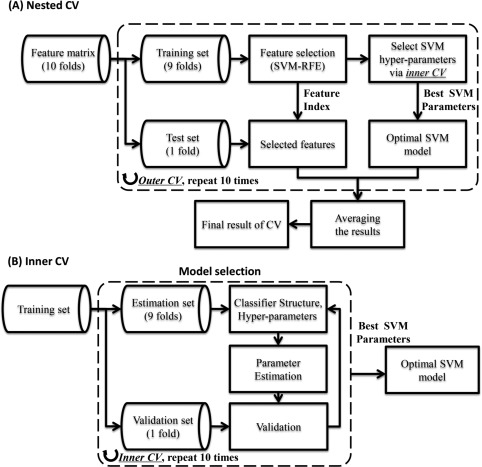
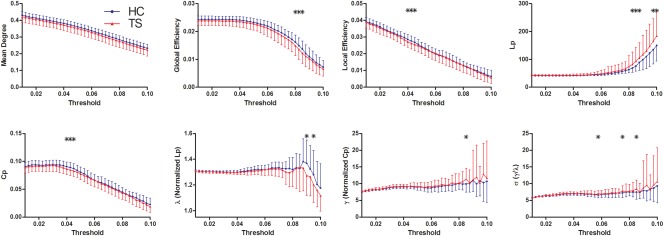
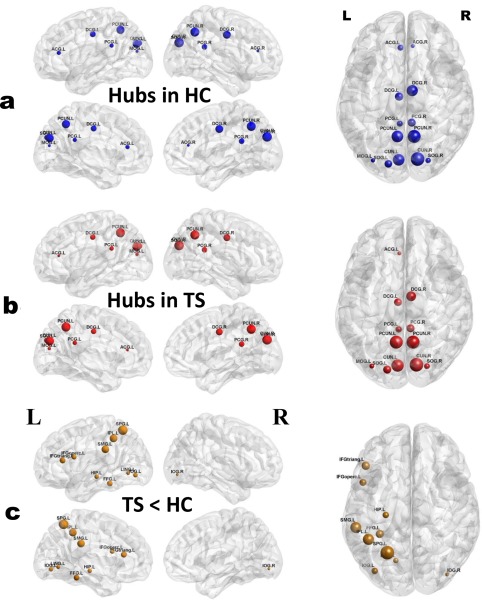
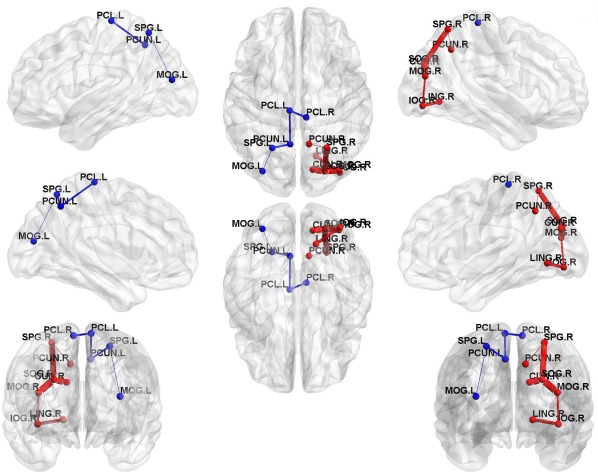
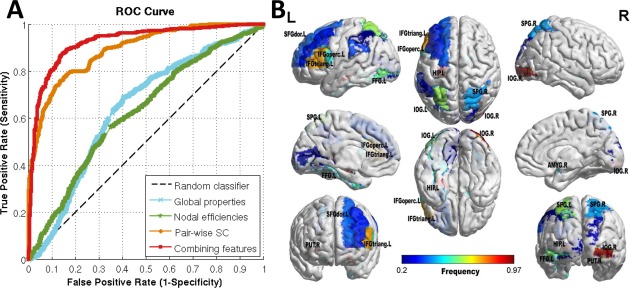
Tourette syndrome (TS) is a childhood-onset neurobehavioral disorder. Although previous TS studies revealed structural abnormalities in distinct corticobasal ganglia circuits, the topological alterations of the whole-brain white matter (WM) structural networks remain poorly understood. Here, we used diffusion MRI probabilistic tractography and graph theoretical analysis to investigate the topological organization of WM networks in 44 drug-naive TS children and 41 age- and gender-matched healthy children. The WM networks were constructed by estimating inter-regional connectivity probability and the topological properties were characterized using graph theory. We found that both TS and control groups showed an efficient small-world organization in WM networks. However, compared to controls, TS children exhibited decreased global and local efficiency, increased shortest path length and small worldness, indicating a disrupted balance between local specialization and global integration in structural networks. Although both TS and control groups showed highly similar hub distributions, TS children exhibited significant decreased nodal efficiency, mainly distributed in the default mode, language, visual, and sensorimotor systems. Furthermore, two separate networks showing significantly decreased connectivity in TS group were identified using network-based statistical (NBS) analysis, primarily composed of the parieto-occipital cortex, precuneus, and paracentral lobule. Importantly, we combined support vector machine and multiple kernel learning frameworks to fuse multiple levels of network topological features for classification of individuals, achieving high accuracy of 86.47%. Together, our study revealed the disrupted topological organization of structural networks related to pathophysiology of TS, and the discriminative topological features for classification are potential quantitative neuroimaging biomarkers for clinical TS diagnosis. Hum Brain Mapp 38:3988-4008, 2017. © 2017 Wiley Periodicals, Inc.

Keywords: Tourette syndrome; diffusion MRI; graph theory; multiple kernel learning; probabilistic tractography; structural network; topological organization.


Figures

Figure 1
Figure 1
The flowchart for constructing the WM structural network using diffusion MRI data. [Color figure can be viewed at http://wileyonlinelibrary.com]
Figure 2
Figure 2
The nested cross‐validation strategy used in our study. (A) The flow chart of the nested CV strategy. The feature selection is implemented on the training set, rather than entire dataset. The performance is evaluated on independent test set in outer CV, which may avoid the overfitting problem. (B) The detailed explanation of the inner CV. In the inner CV, the training set is further divided into estimation set and validation set, the SVM parameters was estimated using a grid search method on the estimation set, the validation set is used to assess the optimal SVM parameters.
Figure 3
Figure 3
Differences in topological properties of WM structural networks between TS patients and controls. Global metrics of WM structural networks were quantified in controls and TS patients with different probability thresholds. Data points marked with a star indicate a significant group difference (P < 0.05) in the global network metric under a corresponding threshold. Both TS patients and controls showed a small‐world organization of WM networks characterized by a γ > 1 and λ ≈ 1. However, compared with controls, TS patients had significantly decreased C p, λ, global and local efficiency, increased L p, γ, and σ in the WM networks for a series of considered thresholds. HC, healthy controls. [Color figure can be viewed at http://wileyonlinelibrary.com]
Figure 4
Figure 4
Distribution of hub regions in the WM structural networks of the control and TS groups and nodes with decreased efficiency in TS children. (a,b) 3D representations of the hub distributions in the control (a) and TS (b) groups. The hub nodes are shown in blue and red with node sizes indicating their nodal efficiency values. (c) The disrupted nodes with the significant between‐group differences in the regional efficiency are shown in yellow, and the node sizes indicate the t values in t test. The brain graphs were visualized by using BrainNet Viewer software (http://www.nitrc.org/projects/bnv/). HC, healthy controls. For the abbreviations of nodes, see Table 2. [Color figure can be viewed at http://wileyonlinelibrary.com]
Figure 5
Figure 5
Two separate networks that show decreased structural connection strengths in TS children. Two separate networks showing significantly decreased connectivity were identified in TS group compared with control group (P values < 0.05, NBS corrected). The red nodes and edges represent network 1, primarily comprising the right parieto‐occipital, precuneus, and cuneus regions. The blue nodes and edges represent network 2, involving the left parieto‐occipital, precuneus, and bilateral paracentral lobule regions. In the 3D surface view of the components, the edge widths represent the emerging percentage of the WM connections under all 37 thresholds. The nodes and connections were mapped onto the cortical surfaces using BrainNet Viewer software (http://www.nitrc.org/projects/bnv/). For detailed information of the WM connections in the significant NBS components, see Table 6. [Color figure can be viewed at http://wileyonlinelibrary.com]
Figure 6
Figure 6
Results of TS classification based on different types of features. (A) ROC curves of the classification results, which demonstrate the superior performance of using combined features over a single type of features. (B) Brain regions with nodal efficiencies identified as discriminative features for classification using MKL. The brain graphs were visualized by volume to surface function in BrainNet Viewer software. The regional colors with progressive shade (from blue to red) indicate the frequency of being selected by the nested CV procedure. Abbreviation is the same as Table 2. [Color figure can be viewed at http://wileyonlinelibrary.com]

Similar articles

Cited by

References

    1. Basser PJ, Mattiello J, LeBihan D (1994a): Estimation of the effective self‐diffusion tensor from the NMR spin echo. J Magn Reson Ser B 103:247–254. - PubMed
    1. Basser PJ, Mattiello J, LeBihan D (1994b): MR diffusion tensor spectroscopy and imaging. Biophys J 66:259–267. - PMC - PubMed
    1. Basser PJ, Pajevic S, Pierpaoli C, Duda J, Aldroubi A (2000): In vivo fiber tractography using DT‐MRI data. Magn Reson Med 44:625–632. - PubMed
    1. Behrens TE, Berg HJ, Jbabdi S, Rushworth MF, Woolrich MW (2007): Probabilistic diffusion tractography with multiple fibre orientations: What can we gain? NeuroImage 34:144–155. - PMC - PubMed
    1. Benjamini Y, Hochberg Y (2015): Controlling the false discovery rate ‐ A practical and powerful approach to multiple testing. J R Stat Soc 57:289–300.

Publication types

MeSH terms