. 2017 May 5:8:15289.
doi: 10.1038/ncomms15289.

Stat3 regulates centrosome clustering in cancer cells via Stathmin/PLK1

Affiliations

Stat3 regulates centrosome clustering in cancer cells via Stathmin/PLK1

Edward J Morris et al. Nat Commun. .

Abstract

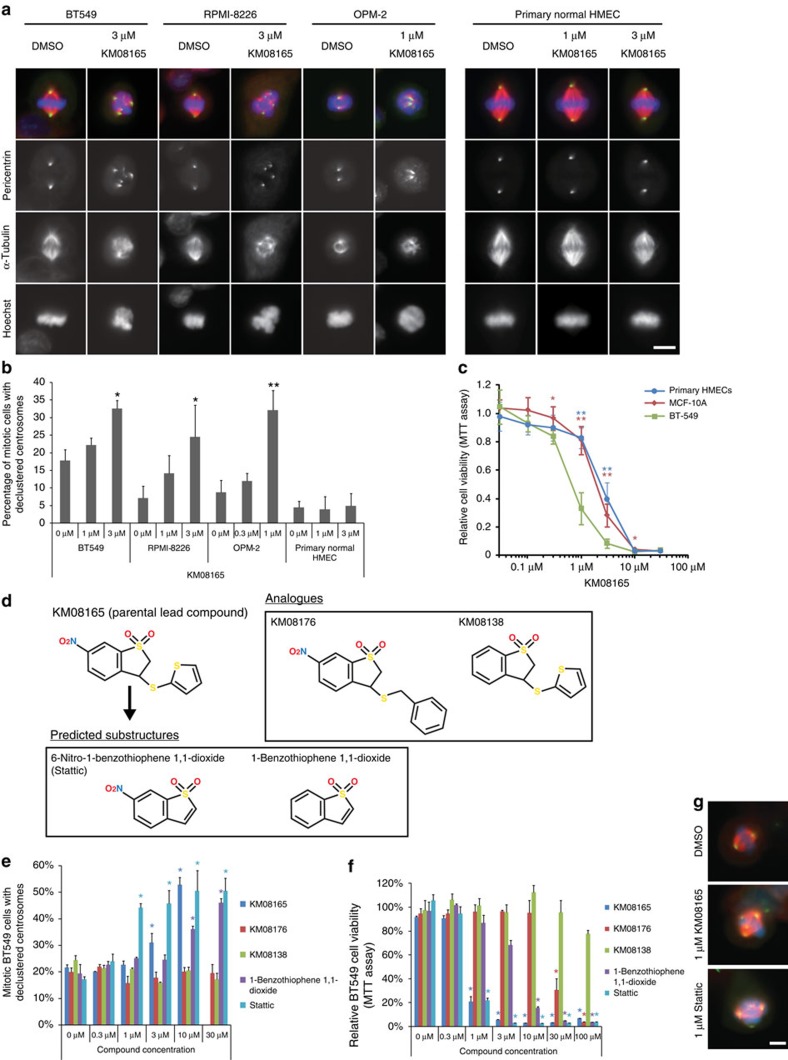
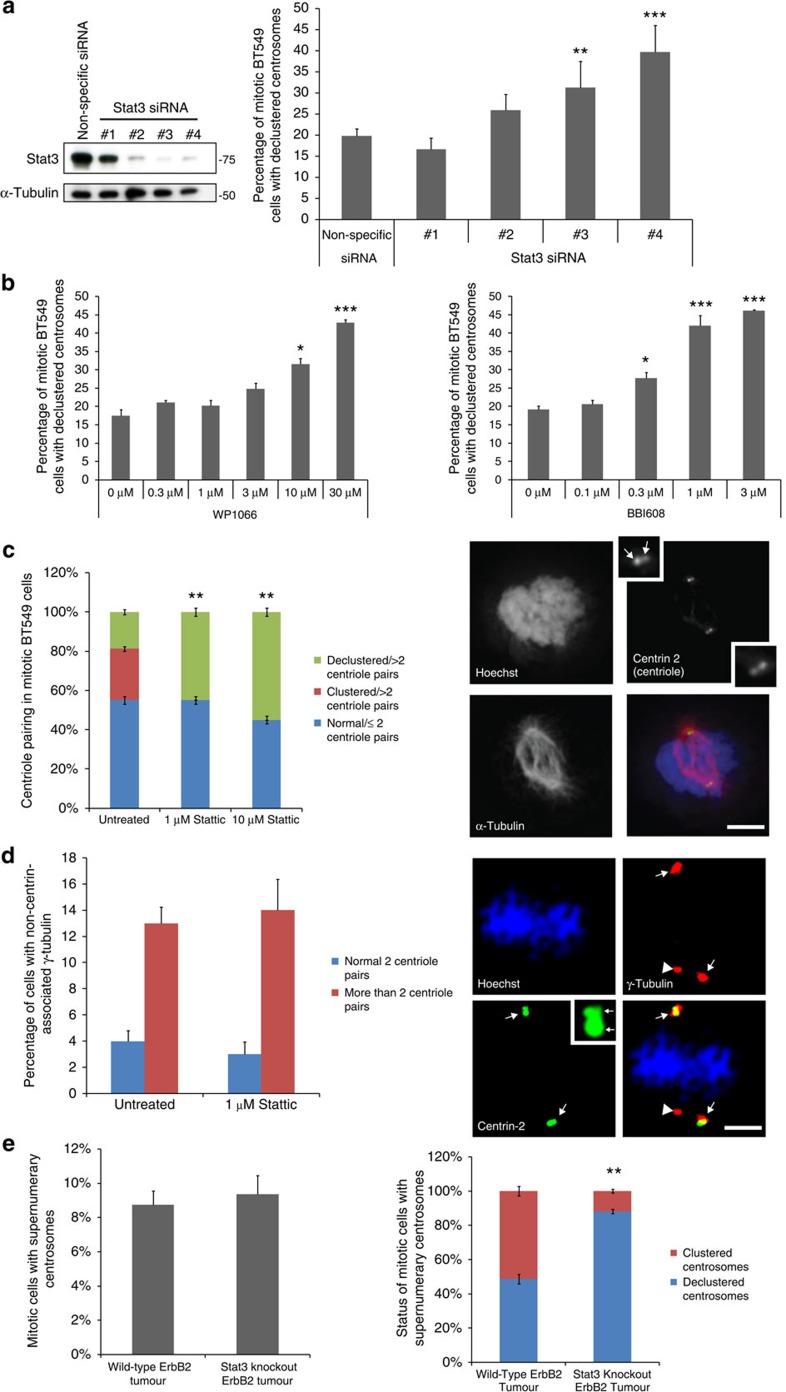
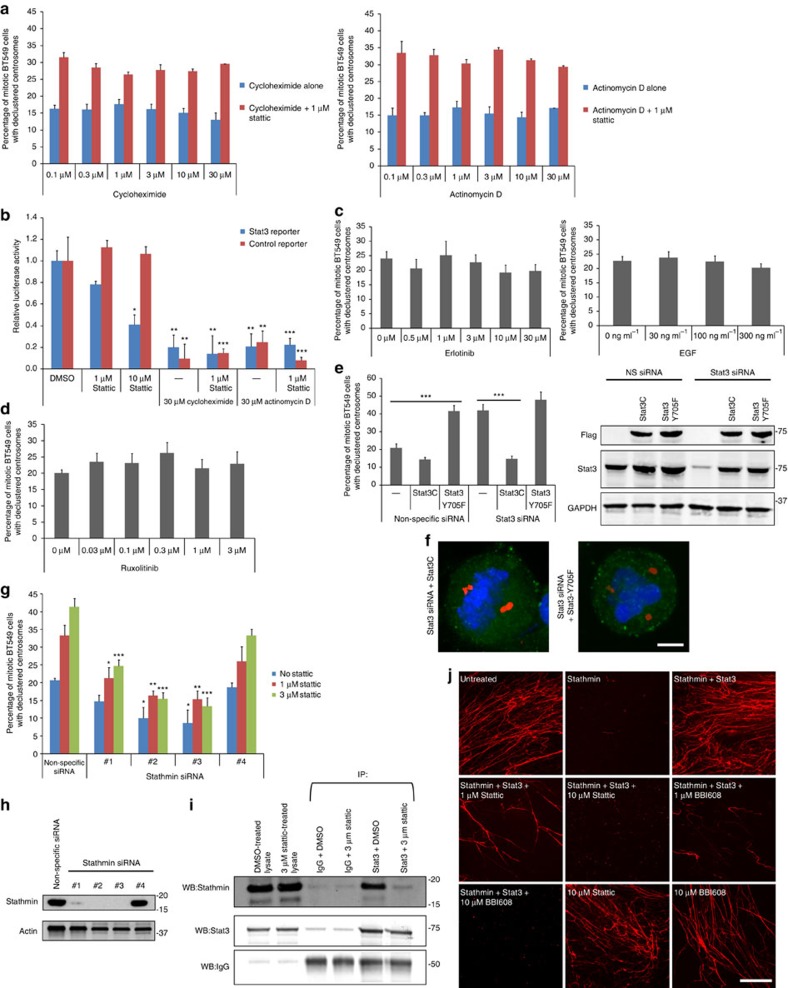
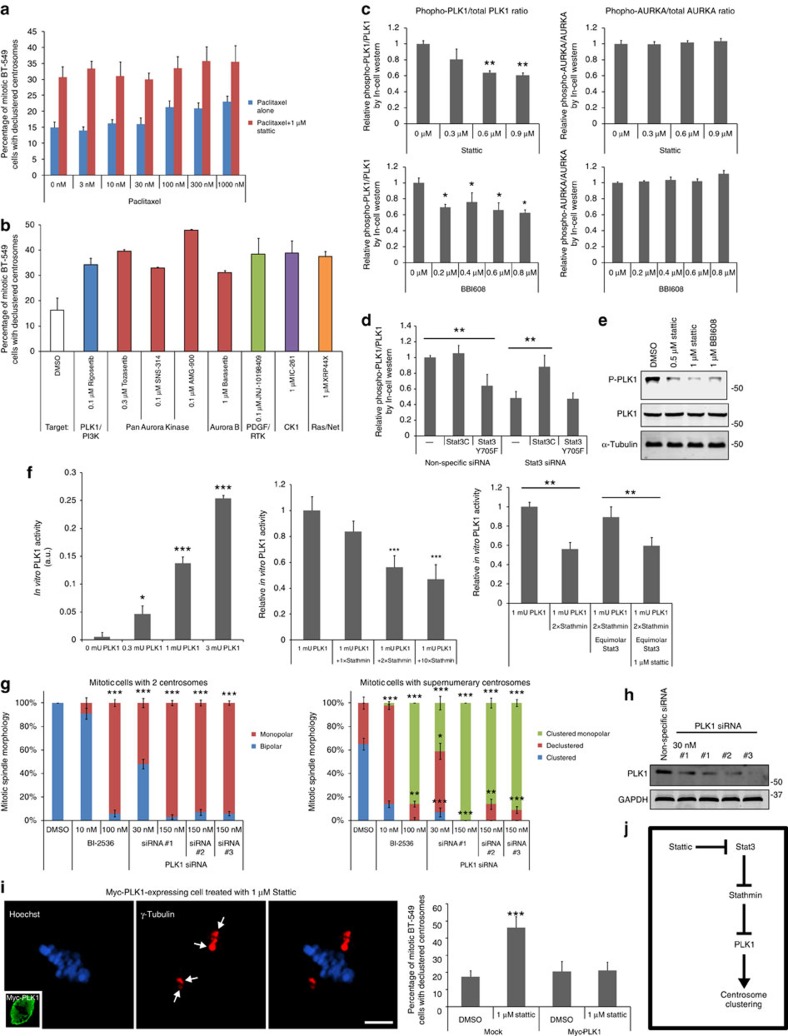
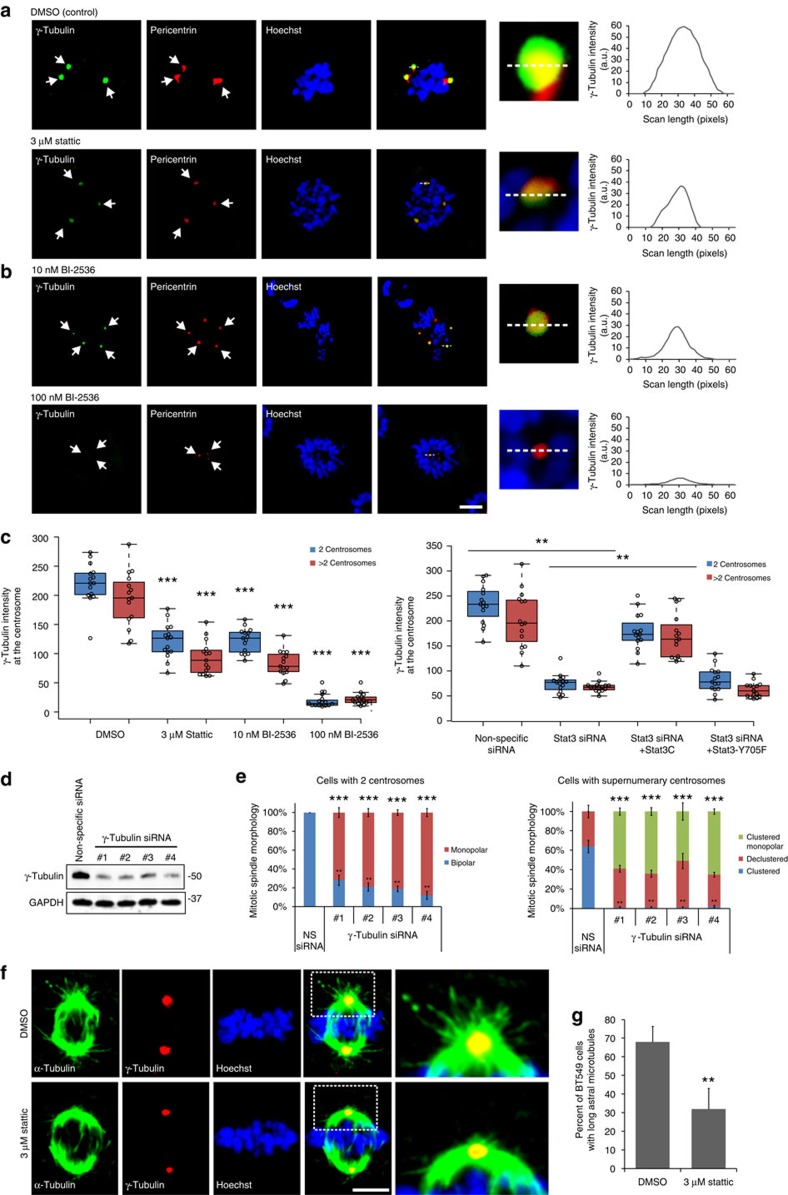
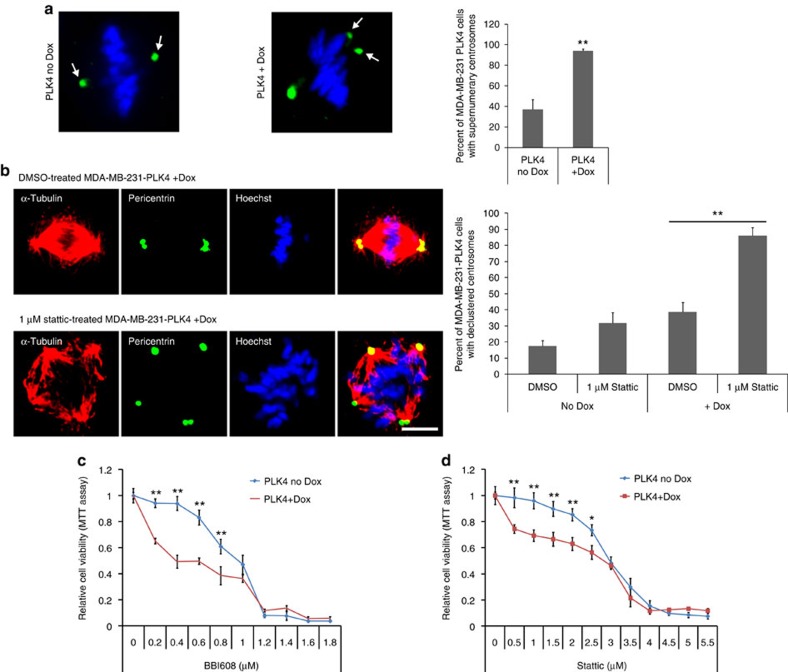
Cancer cells frequently have amplified centrosomes that must be clustered together to form a bipolar mitotic spindle, and targeting centrosome clustering is considered a promising therapeutic strategy. A high-content chemical screen for inhibitors of centrosome clustering identified Stattic, a Stat3 inhibitor. Stat3 depletion and inhibition in cancer cell lines and in tumours in vivo caused significant inhibition of centrosome clustering and viability. Here we describe a transcription-independent mechanism for Stat3-mediated centrosome clustering that involves Stathmin, a Stat3 interactor involved in microtubule depolymerization, and the mitotic kinase PLK1. Furthermore, PLK4-driven centrosome amplified breast tumour cells are highly sensitive to Stat3 inhibitors. We have identified an unexpected role of Stat3 in the regulation of centrosome clustering, and this role of Stat3 may be critical in identifying tumours that are sensitive to Stat3 inhibitors.


Conflict of interest statement

The authors declare no competing financial interests.

Figures

Figure 1
Figure 1. Identification of KM08165 as a centrosome clustering inhibitor and chemical substructure analysis to identify Stattic.
(a) Immunofluorescence images of cells treated with KM08165. Mitotic spindle morphology was observed by staining for pericentrin (green), α-tubulin (red) and DNA (Hoechst, blue). Scale bar, 8 μm. (b) Quantification of KM08165-dependent inhibition of centrosome clustering in cells derived from various origins including breast cancer (BT-549), myeloma (RPMI-8226, OPM-2) and freshly isolated normal primary human mammary epithelial cells (primary HMECs). n=3 biological replicates, ≥128 cells per condition. Statistical significance was tested between untreated and KM08165-treated groups with analysis of variance (ANOVA). (c) Quantification of cell viability 3-(4,5-dimethylthiazol-2-yl)-2,5-diphenyltetrazolium bromide (MTT) assay in invasive mammary tumour cells (BT-549), normal mammary cells (MCF-10A) and primary human mammary epithelial cells (primary HMECs) treated with KM08165. n=3 biological replicates. Statistical significance was tested between BT-549 and the other cell lines at different concentrations of KM08165 with ANOVA. (d) Chemical structures of KM08165 analogues and in silico determined chemical substructures. (e) Percentage of compound-treated BT-549 cells with declustered centrosomes. n=3 biological replicates. Statistical significance was tested between untreated and compound-treated groups with ANOVA. (f) Relative viability of cells treated with KM08165 analogues and computed substructures. n=3 biological replicates. Statistical significance was tested between untreated and compound-treated groups with ANOVA. (g) Images of mitotic cells treated with dimethylsulphoxide (DMSO; control), KM08165 and Stattic. Mitotic spindle morphology was observed by immunofluorescence staining for pericentrin (green), α-tubulin (red) and DNA (Hoechst, blue). Scale bar, 8 μm. *P<0.05; **P<0.01. Error bars represent s.d.
Figure 2
Figure 2. Stat3 is required for centrosome clustering.
(a) Western blot of Stat3 and tubulin (loading control) of BT-549 cells treated with Stat3 siRNAs (left). Quantification of the percentage of mitotic Stat3 siRNA-treated cells with declustered centrosomes (right; n=3 biological replicates, ≥600 cells per condition). Statistical significance was tested between non-specific siRNA-treated and Stat3 siRNA-treated groups with analysis of variance (ANOVA). (b) Quantification of inhibition of centrosome clustering in cells treated with the Stat3 inhibitors WP1066 and BBI-608 (n=5 biological replicates, ≥1,000 cells per data point). Statistical significance was tested between untreated and compound-treated groups with ANOVA. (c) Quantification of the number of centriole pairs in Stattic-treated cells (left; n=4 biological replicates, 80 cells per condition). Statistical significance was tested between untreated and Stattic-treated groups with ANOVA. Immunofluorescence images of centriole pairs (centrin-2, green), tubulin (red) and DNA (Hoechst, blue) in a normal mitotic BT-549 cell (right). Inset: magnified image of centrin-2 stain. Arrows point to centrioles. Scale bar, 8 μm. (d) Quantification of the percentage of BT-549 cells with non-centrin-associated γ-tubulin (left panel) and immunofluorescence images (right panels) of centrin-2 (green), γ-tubulin (red) and DNA (Hoechst, blue). Scale bar, 5 μm. Arrows point to γ-tubulin with centrin-2 staining, arrowheads point to γ-tubulin staining without centrin-2 staining. Inset: magnified image of centrin-2 stain with arrows pointing to centrioles. n=4 biological replicates, 100 cells per condition. Statistical significance was tested between untreated and Stattic-treated groups with Student's T-test. (e) Analysis of supernumerary centrosomes in Stat3−/− ErbB2 induced mouse mammary tumours. The percentage of cells with supernumerary centrosomes was quantified as described in Experimental Procedures (left panel; n=4 mice per condition, 80 cells per condition). In separate scoring, the percentage of supernumerary centrosome cells with clustered or declustered centrosomes was quantified (right; n=4 mice per condition, 80 cells per condition). Statistical significance was tested between wild-type and Stat3-knockout groups with Student's T-test. *P<0.05; **P<0.01; ***P<0.001. Error bars represent s.e.m.
Figure 3
Figure 3. Stat3 induces centrosome clustering via Stathmin and is independent of Stat3 transcription factor function.
(a) Quantification of centrosome declustering in BT-549 cells treated with the protein synthesis inhibitor cycloheximide (left panel; n=5 biological replicates, ≥1,000 cells per data point) and the transcription inhibitor actinomycin D (right panel; n=5 biological replicates, ≥1,000 cells per data point). (b) Transcriptional reporter activity of cells treated with Stattic, cycloheximide or actinomycin D. n=4 biological replicates. Statistical significance was tested between untreated and compound-treated groups with analysis of variance (ANOVA). (c) Quantification of centrosome declustering in mitotic BT-549 cells treated with epidermal growth factor (EGF; left; n=5 biological replicates, ≥1,000 cells per data point) or the EGF receptor inhibitor erlotinib (right; n=5 biological replicates, ≥1,000 cells per data point). Statistical significance was tested between untreated and compound-treated groups with ANOVA. (d) Quantification of centrosome declustering in BT-549 cells treated with the Jax1/2 inhibitor ruxolitinib. n=5 biological replicates, ≥1,000 cells per data point. Statistical significance was tested between untreated and ruxolitinib-treated groups with ANOVA. (e) Left: quantification of centrosome declustering in Stat3 siRNA-treated mitotic BT-549 cells stably expressing Flag-Stat3C or Flag-Stat3-Y705F (n=5 biological replicates, 250 cells per condition). Right: western blot of Flag, Stat3 and GAPDH (loading control) using lysates from Stat3 siRNA-treated cells stably expressing Flag-Stat3C or Flag-Stat3-Y705F. Statistical significance between the indicated groups was tested using ANOVA. (f) Immunofluorescence images of Stat3 siRNA-treated BT-549 cells stably expressing Flag-Stat3C (left) or Flag-Stat3-Y705F (right). Pericentrin (red), Flag (green) and DNA (Hoechst, blue). Scale bar, 4 μm. (g) Quantification of centrosome declustering in BT-549 cells treated with Stathmin siRNA±Stattic. n=4 biological replicates, ≥800 cells per condition. Statistical significance was tested between untreated and Stattic-treated groups with ANOVA. (h) Western blot of Stathmin and actin (loading control) using lysates from Stathmin siRNA-treated cells. (i) Immunoprecipitation of IgG (control) or Stat3 from BT-549 cells using endogenous protein and western blotted for Stathmin, Stat3 and IgG. (j) In vitro tubulin polymerization assay using purified proteins. Microtubules were grown in the presence of the microtubule depolymerase Stathmin (HIS-tagged), Stat3 (GST-tagged), Stattic and BBI-608. HIS-Stathmin and GST-Stat3 were used at 1.8 and 0.36 μM concentrations, respectively. Scale bar, 8 μm. *P<0.05; **P<0.01; ***P<0.001. Error bars represent s.e.m.
Figure 4
Figure 4. Stat3/Stathmin act through PLK1 to regulate centrosome clustering.
(a) Quantification of centrosome clustering in paclitaxel-treated BT-549 cells with or without Stattic (n=6 biological replicates, ≥1,200 cells per data point). (b) Positive kinase inhibitor ‘hits' identified from a screen of 400 known kinase inhibitors. n=2 biological replicates, ≥400 cells per data point. Error bars (s.d.). PLK1 and aurora kinase A (AURKA) were selected as potential downstream effector candidates of Stat3–Stathmin. (c) Quantification of phosphorylated to total PLK1 and AURKA ratios in Stat3-inhibitor-treated BT-549 cells using In-Cell Western assays (n=4 biological replicates). (d) Quantification of phospho-PLK1 to PLK1 ratios in BT-549 cells stably expressing Stat3C or Stat3-Y705F and treated with Stat3 siRNA, as determined using In-Cell Western assays (n=8 biological replicates). (e) Western blot of phospho-PLK1 and PLK1 from lysates of BT-549 cells treated with Stattic or BBI-608. Tubulin is a loading control. (f) ELISA-based quantification of in vitro PLK1 activity. Quantification of PLK1 activity assay using increasing concentrations of PLK1 (left panel; n=4 biological replicates). Quantification of relative PLK1 activity using 1 mU PLK1 and increasing amounts of Stathmin (middle panel; n=4 biological replicates). Quantification of recombinant PLK1 activity in the presence of recombinant Stathmin, Stat3 and Stattic (right panel; n=4 biological replicates). 1 mU (milli unit)=1 nmole of phosphate incorporated min−1 mg−1. (g) Quantification of the effects of low and high concentrations of the PLK1 inhibitor BI-2536 and PLK1 siRNA on centrosome clustering in mitotic BT-549 cells (n=4 biological replicates, 80 cells per condition). (h) Western blot of PLK1 siRNA-treated BT-549 cells stained for PLK1 and GAPDH (loading control). (i) Immunofluorescence images of γ-tubulin (red), DNA (Hoechst, blue) and Myc-Tag (inset, green) in a mitotic BT-549 cell transiently overexpressing Myc-tagged PLK1 and treated with 1 μM Stattic (left panels). Arrows point to clustered supernumerary centrosomes. Scale bar, 5 μm. Quantification of the percentage of Myc-PLK1-expressing mitotic BT-549 cells with declustered centrosomes (right panel; n=4 biological replicates, 120 cells per condition). (j) Diagram of potential Stat3–Stathmin–PLK1 pathway. *P<0.05; **P<0.01; ***P<0.001. Error bars represent s.e.m. Statistical significance was tested between the indicated groups with analysis of variance in all graphs.
Figure 5
Figure 5. The Stat3–PLK1 pathway regulates centrosomal γ-tubulin and astral microtubules.
Immunofluorescence images of pericentrin (red), γ-tubulin (green) and Hoechst (blue) in mitotic supernumerary centrosome BT-549 cells treated with Stattic (a) or BI-2536 (b). Graphs of line scans (right panels), dashed white lines denote the scanned area, arrows point to centrosomes. Scale bar, 3 μm. (c) Quantification of fluorescence intensities of γ-tubulin in mitotic cells treated with Stattic or BI-2536 (top) or Stat3 siRNA and Stat3C or Stat3-Y705F (bottom). Data points (circles). Centre lines (medians). Box limits indicate the 25th and 75th percentiles. Whiskers extend 1.5 times the interquartile range from the 25th and 75th percentiles. n=15 biological replicates. Statistical significance was tested between control and treated groups with analysis of variance (ANOVA). (d) Western blot of γ-tubulin siRNA-treated BT-549 cells stained for γ-tubulin and GAPDH (loading control). (e) Quantification of the mitotic spindle morphologies of γ-tubulin siRNA-treated mitotic BT-549 cells with two centrosomes (left) or supernumerary centrosomes (right). n=5 biological replicates, 100 cells per condition. Statistical significance was tested between non-specific and γ-tubulin siRNA-treated groups with ANOVA. (f) Immunofluorescence images of α-tubulin (green), γ-tubulin (red) and DNA (Hoechst, blue) in mitotic BT-549 cells with normal centrosome number that have been treated with dimethylsulphoxide (DMSO; top) or Stattic (bottom). Magnified areas show astral microtubules. Scale bar, 3 μm. (g) Quantification of the percentage of normal (two centrosome) mitotic BT-549 cells with long astral microtubules. *P<0.05; **P<0.01; ***P<0.001. Error bars represent s.e.m.
Figure 6
Figure 6. Cells with centrosome amplification are more sensitive to Stat3 inhibitors.
(a) Left: representative immunofluorescence images of MDA-MB-231 cells with doxycycline-induced, PLK4-dependent centrosome amplification. Pericentrin (green) and DNA (Hoechst, blue). Scale bar, 3 μm. Right: quantification of the number of doxycycline-induced (Dox) MDA-MB-231-PLK4 cells with supernumerary centrosomes. n=5 biological replicates, ≥100 cells per condition. (b) Left: representative immunofluorescence images of dimethylsulphoxide (DMSO)-treated and Stattic-treated MDA-MB-231 cells with doxycycline-induced, PLK4-dependent centrosome amplification. Tubulin (red), pericentrin (green) and DNA (Hoechst, blue). Scale bar, 3 μm. Right: quantification of the number of Stattic-treated doxycycline-induced (Dox) MDA-MB-231-PLK4 cells with declustered centrosomes. n=4 biological replicates, 160 cells per condition. (c) Quantification of cell viability (MTT assay) in BBI-608-treated MDA-MB-231-PLK4 cells with (PLK4+Dox) or without (PLK4 no-Dox) doxycycline-induced PLK4-608 expression. n=6 biological replicates. Statistical significance was tested between the no-Dox and Dox groups with analysis of variance (ANOVA). (d) Quantification of cell viability (MTT assay) in Stattic-treated MDA-MB-231-PLK4 cells with (PLK4+Dox) or without (PLK4 no-Dox) doxycycline-induced centrosome amplification. n=6 biological replicates. Statistical significance was tested between no-Dox and Dox groups with ANOVA. *P<0.05; **P<0.01. Error bars represent s.e.m.

Comment in

References

    1. Ferguson L. R. et al. Genomic instability in human cancer: molecular insights and opportunities for therapeutic attack and prevention through diet and nutrition. Semin. Cancer Biol. 35, (Suppl): S5–S24 (2015). - PMC - PubMed
    1. Bhakta-Guha D., Saeed M. E., Greten H. J. & Efferth T. Dis-organizing centrosomal clusters: specific cancer therapy for a generic spread? Curr. Med. Chem. 22, 685–694 (2015). - PubMed
    1. Korzeniewski N., Hohenfellner M. & Duensing S. The centrosome as potential target for cancer therapy and prevention. Expert Opin Ther. Targets 17, 43–52 (2013). - PubMed
    1. Pannu V. et al. Rampant centrosome amplification underlies more aggressive disease course of triple negative breast cancers. Oncotarget 6, 10487–10497 (2015). - PMC - PubMed
    1. Chan J. Y. A clinical overview of centrosome amplification in human cancers. Int. J. Biol. Sci. 7, 1122–1144 (2011). - PMC - PubMed

Publication types

LinkOut - more resources