

Characterization and Interrelations of One-Carbon Metabolites in Tissues, Erythrocytes, and Plasma in Mice with Dietary Induced Folate Deficiency
- PMID: 28475162
- PMCID: PMC5452192
- DOI: 10.3390/nu9050462
Characterization and Interrelations of One-Carbon Metabolites in Tissues, Erythrocytes, and Plasma in Mice with Dietary Induced Folate Deficiency
Abstract
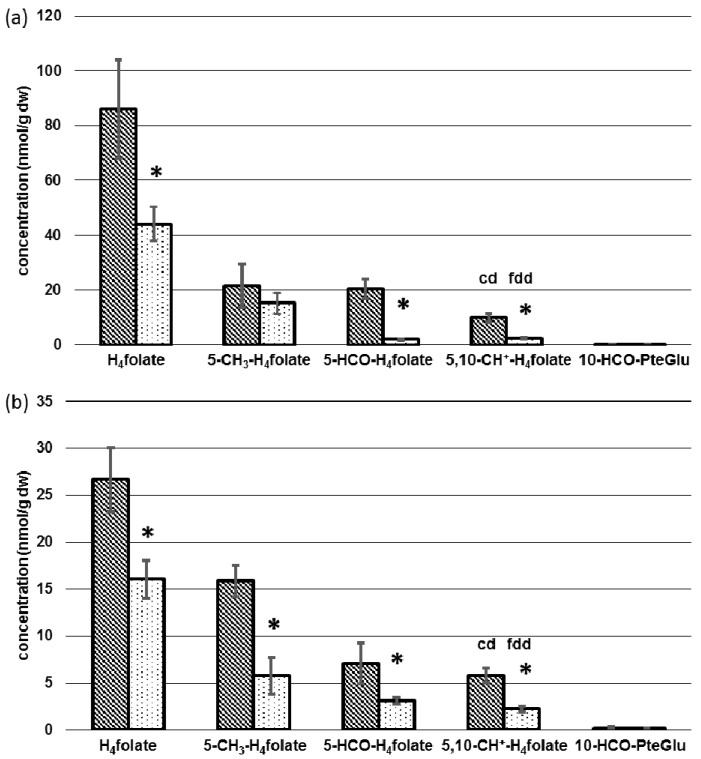
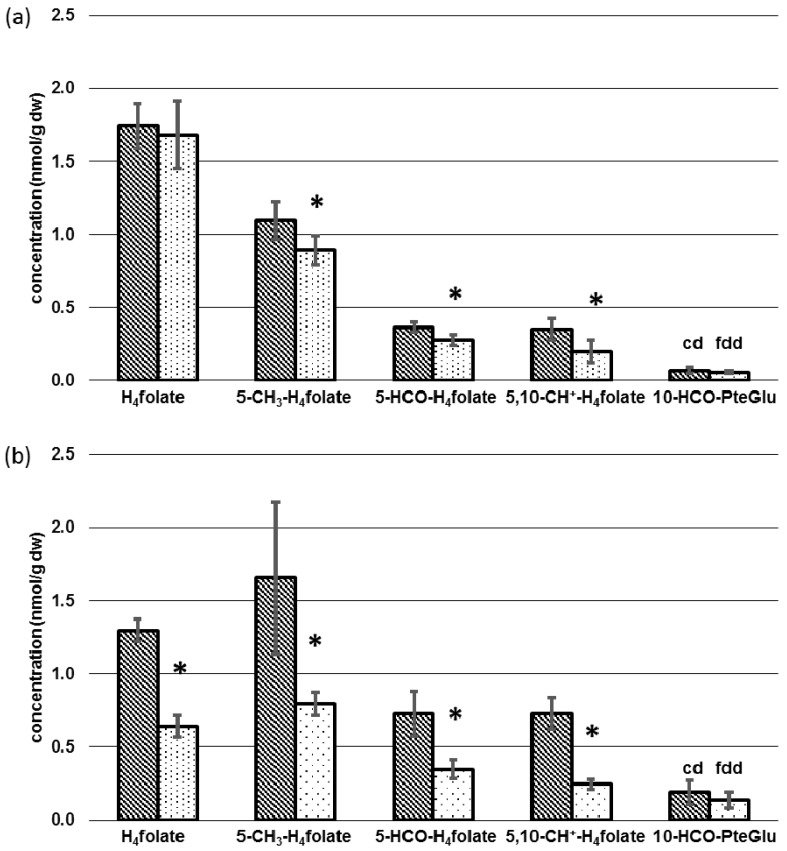
Studies on one-carbon metabolism for the assessment of folate deficiency have focused on either metabolites of folate metabolism or methionine cycle. To bridge the gap between deficiency markers in these pathways we designed a dietary induced folate deficiency study using male C57BL/6N mice. After weaning (3 weeks) mice were fed a defined control diet (1 week) before being fed a folate deficient diet (n = 6 mice) and the control diet (n = 6 mice) for 12 additional weeks. Thereafter, we determined total homocysteine in plasma and folate in erythrocytes as well as S-adenosylmethionine, S-adenosylhomocysteine, and six folate vitamers in tissues including 5-methyltetrahydrofolate, 5-formyltetrahydrofolate, 5,10-methenyltetrahydrofolate, tetrahydrofolate, 10-formylfolic acid, and folic acid by means of stable isotope dilution assays coupled with liquid chromatography tandem mass spectrometry. In all organs, except heart (mainly 5-mehtyltetrahydrofolate), tetrahydrofolate constitutes the main vitamer. Moreover, in liver tetrahydrofolate was most abundant followed by 5-methyltetrahydrofolate (heart: tetrahydrofolate), 5-formyltetrahydrofolate, and 5,10-methenyltetrahydrofolate. Because of the significant decrease (p < 0.05) of folate status and S-adenosylmethionine/S-adenosylhomocysteine ratio accompanied with increasing S-adenosylhomocysteine (p < 0.05), hepatocytes are most susceptible to folate deficiency. To the best of our knowledge, we herein present the first method for simultaneous quantitation of eight metabolites for both folate and methionine cycle in one tissue sample, tHcy in plasma, and erythrocyte folate to shed light on physiological interrelations of one-carbon metabolism.
Keywords: S-adenosylhomocysteine; S-adenosylmethionine; folate deficiency; folate metabolism; homocysteine; methionine metabolism.
Conflict of interest statement
The authors declare no conflict of interest.
Figures


Similar articles
-
Stable Isotope Dilution Assays for Clinical Analyses of Folates and Other One-Carbon Metabolites: Application to Folate-Deficiency Studies.PLoS One. 2016 Jun 8;11(6):e0156610. doi: 10.1371/journal.pone.0156610. eCollection 2016. PLoS One. 2016. PMID: 27276031 Free PMC article.
-
Low Dietary Folate Interacts with MTHFD1 Synthetase Deficiency in Mice, a Model for the R653Q Variant, to Increase Incidence of Developmental Delays and Defects.J Nutr. 2018 Apr 1;148(4):501-509. doi: 10.1093/jn/nxy013. J Nutr. 2018. PMID: 29659962
-
Dietary folate and selenium affect dimethylhydrazine-induced aberrant crypt formation, global DNA methylation and one-carbon metabolism in rats.J Nutr. 2003 Sep;133(9):2907-14. doi: 10.1093/jn/133.9.2907. J Nutr. 2003. PMID: 12949386
-
Alterations in Sulfur Amino Acids as Biomarkers of Disease.J Nutr. 2020 Oct 1;150(Suppl 1):2532S-2537S. doi: 10.1093/jn/nxaa118. J Nutr. 2020. PMID: 33000156 Review.
-
Biomarkers of nutrient exposure and status in one-carbon (methyl) metabolism.J Nutr. 2003 Mar;133 Suppl 3(3):941S-947S. doi: 10.1093/jn/133.3.941S. J Nutr. 2003. PMID: 12612180 Review.
Cited by
-
Ability of dietary factors to affect homocysteine levels in mice: a review.Nutr Metab (Lond). 2021 Jun 30;18(1):68. doi: 10.1186/s12986-021-00594-9. Nutr Metab (Lond). 2021. PMID: 34193183 Free PMC article. Review.
-
Simultaneous Determination of One-Carbon Folate Metabolites and One-Carbon-Related Amino Acids in Biological Samples Using a UHPLC-MS/MS Method.Int J Mol Sci. 2024 Mar 19;25(6):3458. doi: 10.3390/ijms25063458. Int J Mol Sci. 2024. PMID: 38542431 Free PMC article.
-
AHL-differential quorum sensing regulation of amino acid metabolism in Hafnia alvei H4.Microbiol Spectr. 2024 Apr 2;12(4):e0068723. doi: 10.1128/spectrum.00687-23. Epub 2024 Feb 23. Microbiol Spectr. 2024. PMID: 38391231 Free PMC article.
-
Low Maternal Dietary Folate Alters Retrotranspose by Methylation Regulation in Intrauterine Growth Retardation (IUGR) Fetuses in a Mouse Model.Med Sci Monit. 2019 May 7;25:3354-3365. doi: 10.12659/MSM.914292. Med Sci Monit. 2019. PMID: 31061382 Free PMC article.
-
Effect of supplementation with methyl-donor nutrients on neurodevelopment and cognition: considerations for future research.Nutr Rev. 2018 Jul 1;76(7):497-511. doi: 10.1093/nutrit/nuy007. Nutr Rev. 2018. PMID: 29701796 Free PMC article. Review.
References
-
- Obeid R., Pietrzik K., Oakley G., Kancherla V., Holzgreve W., Wieser S. Preventable neural tube defects in Germany. Reprod. Toxicol. 2015;56:30–31. doi: 10.1016/j.reprotox.2015.07.073. - DOI
-
- Snowdon D.A., Tully C.L., Smith C.D., Riley K.P., Markesbery W.R. Serum folate and the severity of atrophy of the neocortex in Alzheimer disease: Findings from the Nun study. Am. J. Clin. Nutr. 2000;71:993–998. - PubMed
MeSH terms
Substances
LinkOut - more resources
Full Text Sources
Other Literature Sources
Medical
Miscellaneous
