. 2017 Jun;24(6):984-996.
doi: 10.1038/cdd.2017.28. Epub 2017 May 5.

Keratins regulate colonic epithelial cell differentiation through the Notch1 signalling pathway

Affiliations

Keratins regulate colonic epithelial cell differentiation through the Notch1 signalling pathway

Iris A K Lähdeniemi et al. Cell Death Differ. 2017 Jun.

Abstract

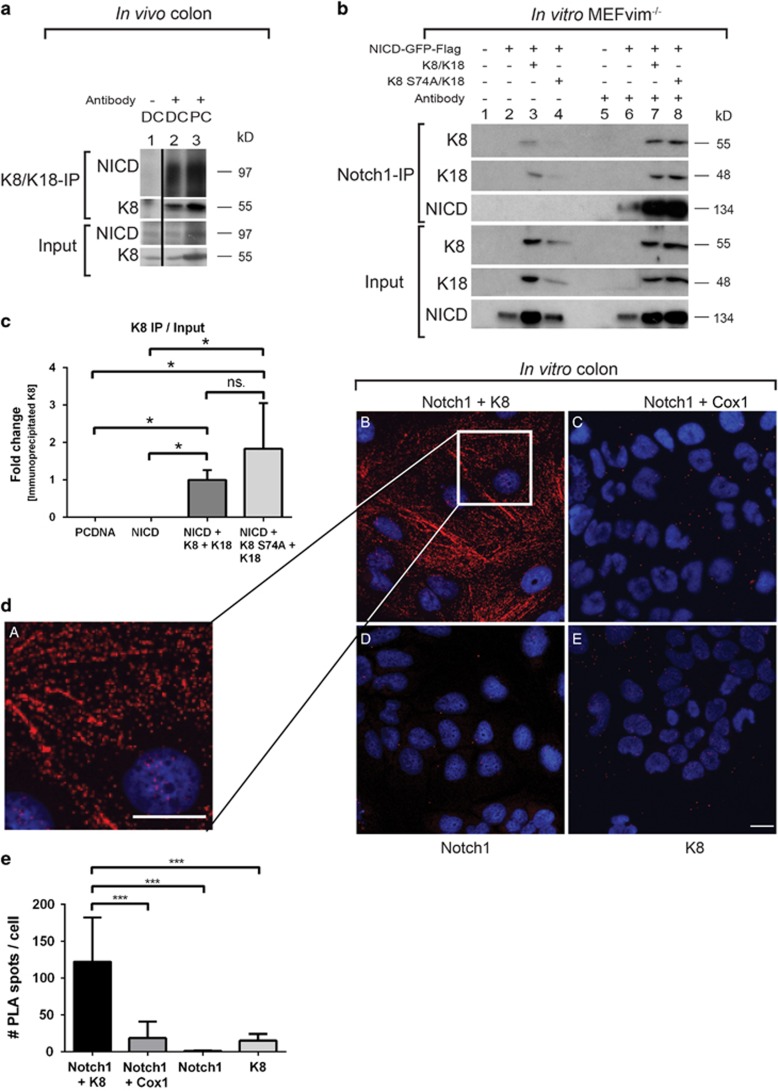
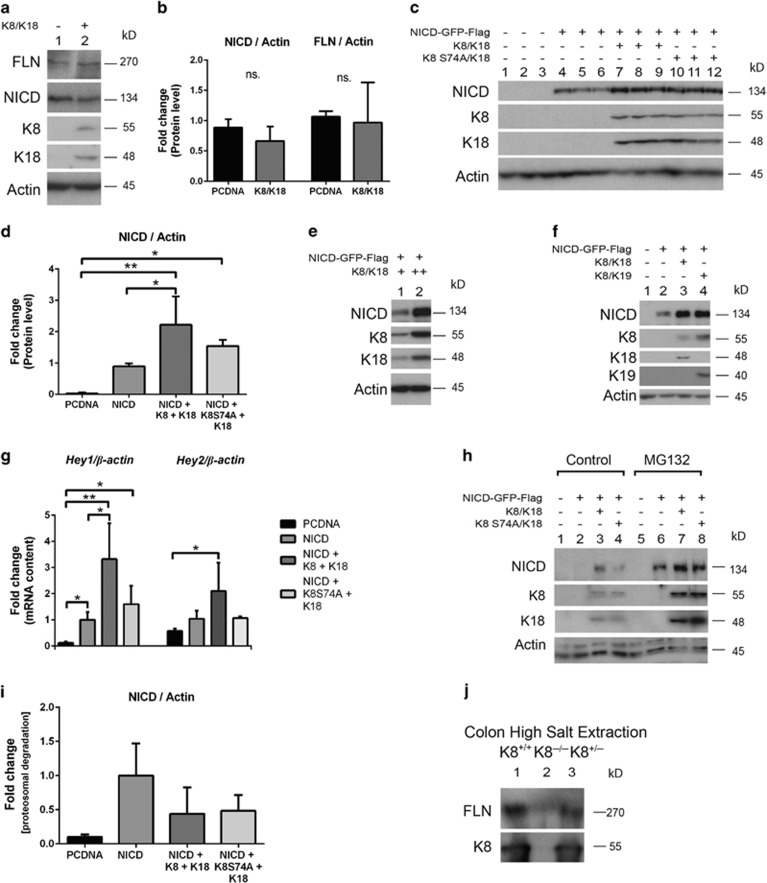
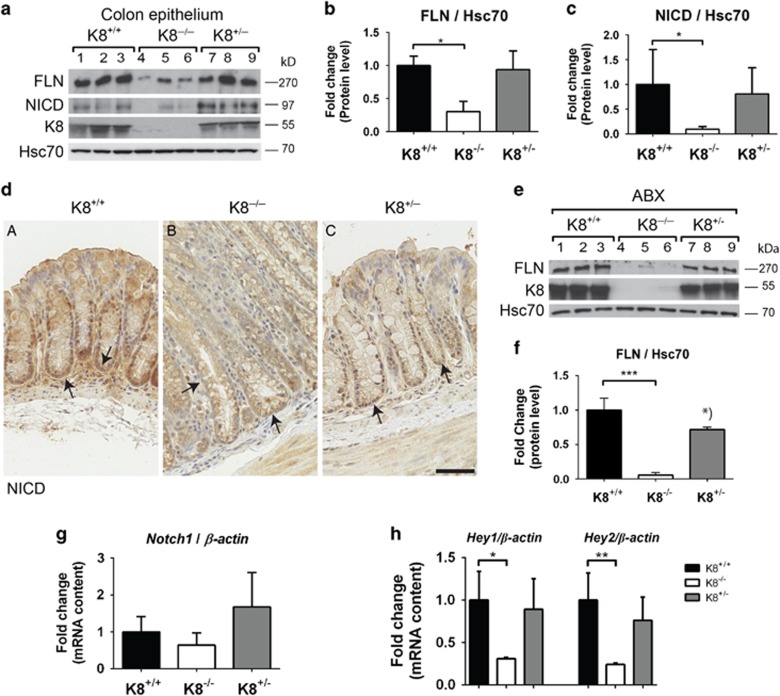
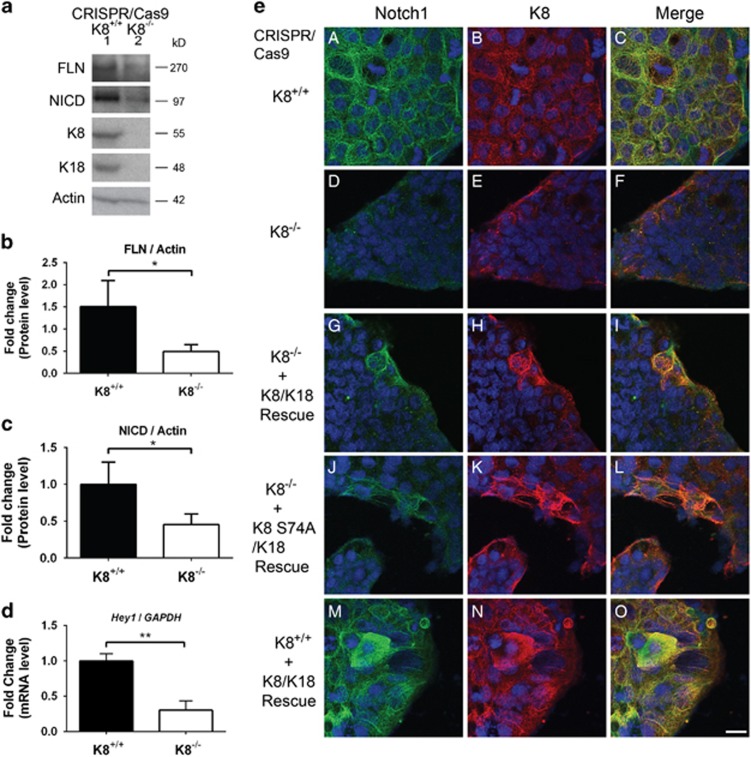
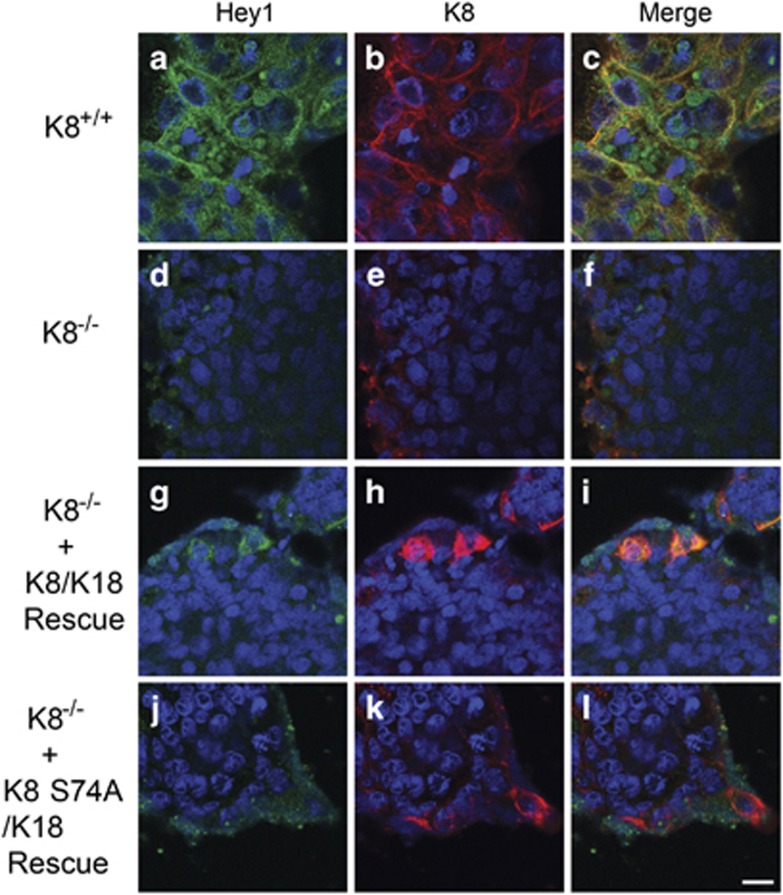
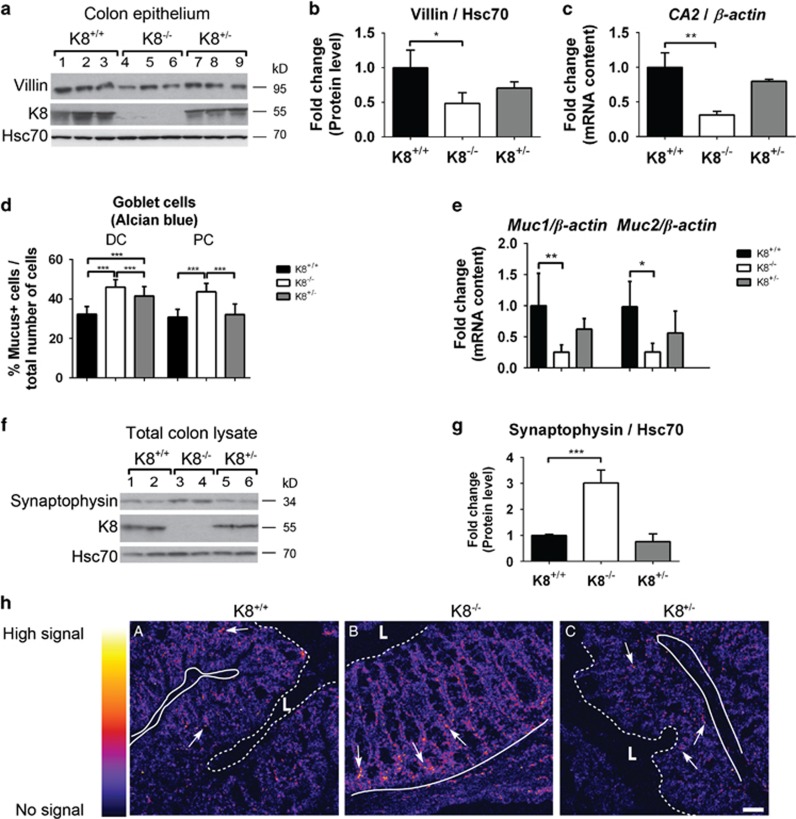
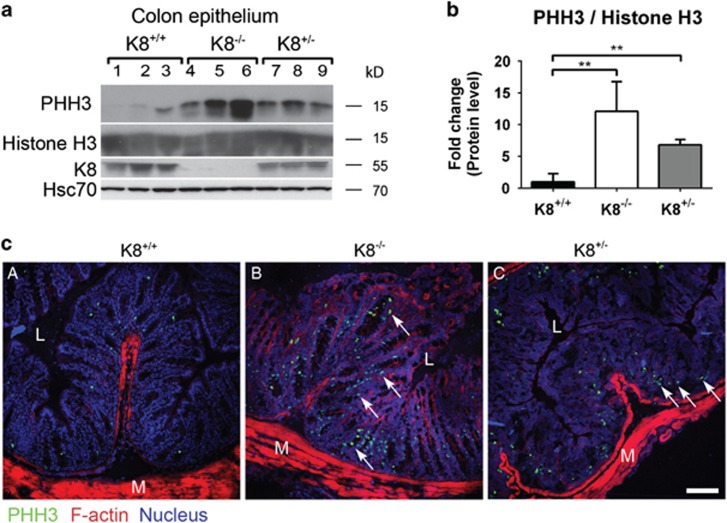
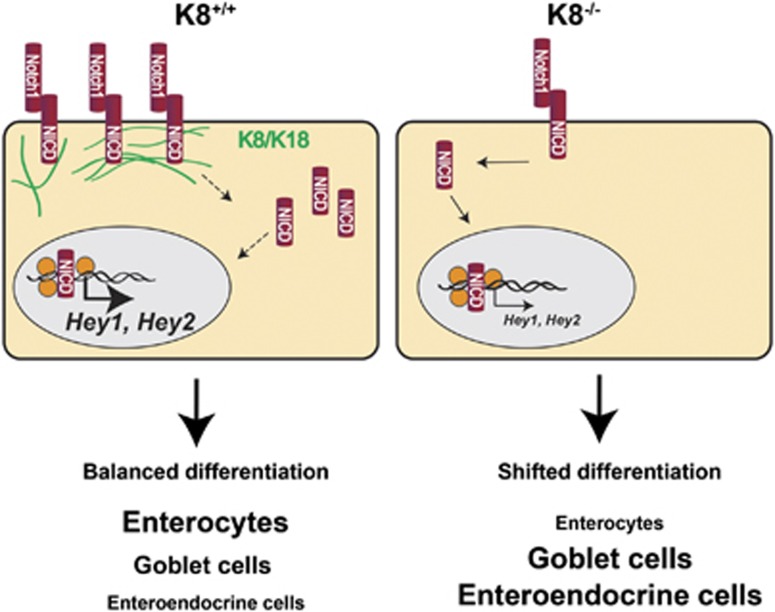
Keratins (K) are intermediate filament proteins important in stress protection and mechanical support of epithelial tissues. K8, K18 and K19 are the main colonic keratins, and K8-knockout (K8-/-) mice display a keratin dose-dependent hyperproliferation of colonic crypts and a colitis-phenotype. However, the impact of the loss of K8 on intestinal cell differentiation has so far been unknown. Here we show that K8 regulates Notch1 signalling activity and differentiation in the epithelium of the large intestine. Proximity ligation and immunoprecipitation assays demonstrate that K8 and Notch1 co-localize and interact in cell cultures, and in vivo in the colonic epithelial cells. K8 with its heteropolymeric partner K18 enhance Notch1 protein levels and activity in a dose dependent manner. The levels of the full-length Notch1 receptor (FLN), the Notch1 intracellular domain (NICD) and expression of Notch1 downstream target genes are reduced in the absence of K8, and the K8-dependent loss of Notch1 activity can be rescued with re-expression of K8/K18 in K8-knockout CRISPR/Cas9 Caco-2 cells protein levels. In vivo, K8 deletion with subsequent Notch1 downregulation leads to a shift in differentiation towards a goblet cell and enteroendocrine phenotype from an enterocyte cell fate. Furthermore, the K8-/- colonic hyperproliferation results from an increased number of transit amplifying progenitor cells in these mice. K8/K18 thus interact with Notch1 and regulate Notch1 signalling activity during differentiation of the colonic epithelium.


Conflict of interest statement

The authors declare no conflict of interest.

Figures

Figure 1
Figure 1
K8 binds to and co-localizes with Notch1 in immunoprecipitation and PLAs. (a) Proximal (PC) and distal (DC) parts of the colon epithelium were isolated by scraping and homogenized with immunoprecipitation lysis buffer. For K8/K18 immunoprecipitation, the lysates were precleared with protein-G/Sepharose beads and incubated overnight with beads and K8/K18 antibodies. The immunoprecipitates were analysed with SDS-PAGE and immunoblotting with the indicated antibodies. Input samples were collected before the immunoprecipitation. The black vertical line in the figure indicates that empty wells have been cut out from the immunoblot without affecting the horizontal level of the bands (full blots are presented in Supplementary Figure S1A). Separate negative control samples where no antibody was added (–antibody) were prepared from the same DC sample that was used for immunoprecipitation and treated the same way as the other samples except for the omission of antibody. The input results shown in the DC–antibody sample in lane 1 are the same input sample western blot result as in the DC sample, lane 2. n=4. (b) Cells were transfected with the indicated plasmids, and the samples were collected and lysed for Notch1 immunoprecipitation and input (Input) as described in (a) 24 h after transfection. The no antibody controls (lanes 1–4) and the precipitates (lanes 5–8) were precleared and incubated overnight with either beads alone or beads+goat anti-full length Notch1 c-20 antibody recognizing all Notch forms. The immunoprecipitates were analysed with SDS-PAGE and immunoblotting with the indicated antibodies (rabbit anti-full length Notch c-20 for Notch1), n=6. (c) K8 protein levels from immunoprecipitates (in (b)) were quantified and compared to the K8 input signals. The no antibody signal was subtracted from the immunoprecipitate signals and normalized to input levels. Negative values for PCDNA and NICD were set to 0. n=3. *P<0.05. (d) PLA was performed for Notch1 and K8 (dA, and which is zoomed from dB) in Caco-2 cells fixed with methanol and acetone at −20 °C. The PLA signal (red) for Notch1 and K8 was analysed using rabbit anti-full length Notch1 c-20 (FLN and NICD) and mouse anti-K8 antibody in the proximity ligation kit from Duolink. Negative controls used were PLA signals for Notch1 and Cox1 (C), and background signals for Notch1 (D) and K8 (E) alone. Nuclei are presented in blue. n=3. Scale, 20 μm. (e) Quantification of PLA spots per cell in (d) was performed using particle analysis in Fiji. n=5–13 cells/ analysis. ***P<0.001
Figure 2
Figure 2
Keratins enhance and stabilize Notch levels. (ad) MEFvim−/− cells were cultured and transfected by electroporation with the indicated plasmids. FLN, NICD and K8/K18 protein levels were analysed with SDS-PAGE and immunoblotting. Actin was used as a loading control. The endogenous protein amounts of FLN and NICD from (a) were quantified in (b), and from (c) were quantified in (d) by normalization to the loading control actin. Lanes 1–12 in (c) represent the different cell samples (n=3). Lane 1 in (a) and lanes 1–3 in (c) represent transfection with an empty plasmid (PCDNA3.1). *P<0.05, ** P<0.01. (e) MEFvim−/− cells were cultured and transfected by electroporation with 10 μg NICD and 5 (+) and 10 (++) μg of K8 and K18. NICD and K8/K18 protein levels were analysed by immunoblotting. Actin was used as a loading control. n=3. (f) MEFvim−/− cells were cultured and transfected and analysed by western blotting as in (c) with the addition of K19. Actin was used as a loading control. Lane 1 represents transfection with an empty plasmid (PCDNA3.1). n=4. (g) MEFvim−/− cells were cultured and transfected as indicated in (c) and Hey1 and Hey2 mRNA amounts were analysed with RT-PCR, normalized to β-Actin and presented as average fold change as related to NICD overexpressed control cell samples±SD. n=3. *P<0.05. **P<0.01. (h) MEFvim−/− cells were transfected by electroporation of the indicated plasmids. 24 h after transfection, cells were treated for 12 h with 20 μM MG132. Cell lysates were analysed with SDS-PAGE and immunoblotting using the indicated antibodies. Actin was used as a loading control. Lanes 1 and 5 represent transfection with an empty plasmid (PCDNA3.1), n=3. (i) The NICD levels in (h) were normalized to the loading control actin, whereafter the NICD levels in MG132 treated cells were normalized to control cells to obtain average fold change proteosomal degradation. Data are presented as average fold change and related to NICD-overexpressed control cell samples±S.D. n=3. (j) Colon from K8+/+, K8−/− and K8+/+ mice were subjected to high salt extraction, and the cytoskeletal fraction was analysed by SDS-PAGE and immunoblotting for FLN and K8
Figure 3
Figure 3
FLN and NICD are decreased in K8−/− mouse colon. (a) Colonic epithelium isolated by scraping was used for analysis of FLN and NICD protein amounts with SDS-PAGE and immunoblotting. The genotypes (K8+/+, K8−/− and K8+/−) were confirmed by K8 immunoblotting, and Hsc70 was used as a loading control. Lanes 1–9 represent individual mice. n=3. (b and c) The protein amount of FLN and NICD from (a) was quantified and normalized to the loading control Hsc70. n=3. The results are presented as average fold change as related to K8+/+ control mice±SD. *P<0.05. (d) Immunohistochemical staining for NICD was performed on paraffin-embedded colon sections using rabbit anti-cleaved Notch1 antibody as indicated. n=3. Scale, 50 μm. Arrows point to positive signal in the crypt regions. (e) Mice were treated with broad-spectrum antibiotics (ABX) for 8 weeks after which the protein levels of FLN and K8 were analysed with SDS-PAGE and immunoblotting in colonic epithelial scraping samples. Hsc70 was used as a loading control. n=3. (f) FLN protein levels from (e) were quantified, normalized against the loading control Hsc70 and presented as average fold change as related to K8+/+ control mice±SD. ***P<0.001.*) K8+/− mice did not show a significant difference in FLN levels compared to K8+/+ by one-way Anova, whereas with Student's t-test the P value was 0.05. (g) Notch1 mRNA levels were analysed with RT-PCR in the indicated mouse genotypes, normalized to β-Actin mRNA and presented as average fold change±SD. n=3. (h) mRNA levels of Notch target genes Hey1 and Hey2 were analysed with RT-PCR in the indicated mouse genotypes, were normalized to β-Actin and presented as average fold change as related to K8+/+ control mice±SD. n=3. *P<0.05, **P<0.01
Figure 4
Figure 4
K8 deletion with the CRISPR/Cas9 method in Caco-2 cells downregulates Notch1 levels, which are rescued by re-expression of K8/K18 or K8 S74A/K18. (a) Caco-2 CRISPR/Cas9 K8+/+ and K8−/− cells were cultured, lysed for protein analysis and analysed with the indicated antibodies. Actin was used as a loading control. n=5. (b and c) The FLN and NICD protein levels in (a) were quantified and normalized to the loading control actin. n=3. The results are presented as average fold change as related to K8+/+ control cells±SD. * P<0.05. (d) Notch target gene Hey1 was analyzed in Caco-2 CRISPR/Cas9 K8+/+ and K8−/− cells with RT-PCR, normalized to β-Actin mRNA and presented as average fold change ± S.D. n = 3. (e) Caco-2 CRISPR/Cas9 K8+/+ (A–C, M–O) and Caco-2 CRISPR/Cas9 K8−/− (D–L) cells were cultured on cover slips, and K8/K18 or K8 S74A/K18 were overexpressed in Caco-2 CRISPR/Cas9 K8−/− (G–L), and K8/K18 in Caco-2 CRISPR/Cas9 K8+/+ (M–O) cells with Lipofectamine 2000. Cells were fixed with methanol and acetone in −20 °C and immunostained for Notch1 (A, D, G, J, M) and K8 (B, E, H, K, N) and showed separately, or merged (C, F, I, L, O). Nuclei are presented in blue. n=3–6. Scale, 20 μm
Figure 5
Figure 5
K8 deletion with the CRISPR/Cas9 method in Caco-2 cells downregulates Hey1 levels, which are rescued by re-expression of K8/K18. Caco-2 CRISPR/Cas9 K8+/+ (ac) and Caco-2 CRISPR/Cas9 K8−/− (dl) cells were cultured on cover slips, and K8/K18 or K8 S74A/K18 were overexpressed in Caco-2 CRISPR/Cas9 K8−/− (gl) cells with Lipofectamine 2000. Cells were fixed with methanol and acetone in −20 °C and immunostained for Hey1 (Hrt1, Santa Cruz; a, d, g, j) and K8 (b, e, h, k) and showed separately, or merged (c, f, i, l). Nuclei are presented in blue. n=3. Scale, 20 μm
Figure 6
Figure 6
The colonic differentiation phenotype in K8−/− colonic epithelium is shifted towards increased goblet cells and EEC. (a) Colon epithelium was isolated by scraping and the protein levels of villin were analysed with SDS-PAGE and immunoblotting. Hsc70 was used as a loading control. Lanes 1–9 represent individual mice. n=3. (b) The villin protein levels in (a) were normalized to the loading control Hsc70. n=3. The results are presented as average fold change as related to K8+/+ control mice±SD. *P<0.05. (c) CA2 mRNA was analysed in mouse colonic epithelium with RT-PCR in the indicated mouse genotypes and normalized to β-Actin. The results are presented as average fold change as related to K8+/+ control mice±SD. n=3. **P<0.01. (d) Mucus, marking the intestinal goblet cells, was stained with Alcian blue (Supplementary Figure S4), and the mucus positive (mucus+) goblet cells were quantified by dividing the number of goblet cells with the total number of epithelial cells per colon crypt. n[DC]= 3 mice (10 crypts/mouse), n[PC]= 3 mice (10 crypts/mouse). ***P<0.001. (e) Goblet cell mRNA products Mucin1 (Muc1) and Mucin2 (Muc2) were analysed with RT-PCR in the indicated mouse genotypes and were normalized to β-Actin. n[Mucin1]= 5, n[Mucin2]= 4. The results are presented as average fold change as related to K8+/+ control mice±SD. *P<0.05. **P<0.01. (f) Colon lysates were analysed for the EEC marker synaptophysin using SDS-PAGE and immunoblotting. Hsc70 was used as a loading control. Lanes 1–6 represent individual mice. n=3. (g) The protein amount of synaptophysin from (f) was quantified and normalized to the loading control Hsc70. The results are presented as average fold change as related to K8+/+ control mice±SD. n=3. ***P<0.001. (h) Frozen colonic sections were fixed with 4% PFA and immunostained for synaptophysin. A heat map of the positive synaptophysin staining was constructed using BioImage XD. The dark colour represents no signal intensity and the light signal represents high signal intensity. The arrows point to examples of EEC. The border between the lumen (L) and the top of the epithelium is indicated with a dotted line and the base of the epithelial crypts by a solid line. Scale, 100 μm
Figure 7
Figure 7
Deletion of K8 leads to an increased amount of transit amplifying cells in the colonic epithelium. (a) Colonic epithelium isolated by scraping was analysed with SDS-PAGE and immunoblotting for the indicated proteins. PHH3 was used as a marker of colonic epithelial transit amplifying cells. The genotypes were confirmed by K8 immunoblotting, and Hsc70 was used as a loading control. Lanes 1–9 represent individual mice. n=3. (b) The protein amount of PHH3 from (a) was normalized to histone H3 levels (a) in order to quantify the transit amplifying cell marker of each genotype. Each column represents three genotypes presented as average fold change as related to K8+/+ control mice±SD, **P<0.01. (c) Frozen colonic sections were fixed with 4% PFA and immunostained with rabbit anti-PHH3 (green) and phalloidin recognizing F-Actin (red). Nuclei are presented in blue. The arrows point to examples of transit amplifying cells and representative images of n=3 mice are shown. L=lumen, M=muscle. Scale, 100 μm
Figure 8
Figure 8
Summary of the impact of keratins on the Notch1 signalling pathway. K8/K18 bind Notch1, which increases NICD levels and enhances transcription of Notch1 target genes Hey1 and Hey2. Therefore, the lack of K8 in the K8−/− colon leads to decreased levels of FLN and NICD, and thus decreased target gene transcription. The lack of keratins leads to a Notch1-dependent shift in colonic epithelial cell differentiation with elevated number of goblet cells and EEC and a decreased number of enterocytes

Similar articles

Cited by

References

    1. Toivola DM, Strnad P, Habtezion A, Omary MB. Intermediate filaments take the heat as stress proteins. Trends Cell Biol 2010; 20: 79–91. - PMC - PubMed
    1. Garrod DR. Desmosomes and hemidesmosomes. Curr Opin Cell Biol 1993; 5: 30–40. - PubMed
    1. Styers ML, Salazar G, Love R, Peden AA, Kowalczyk AP, Faundez V. The endo-lysosomal sorting machinery interacts with the intermediate filament cytoskeleton. Mol Biol Cell 2004; 15: 5369–5382. - PMC - PubMed
    1. Toivola DM, Krishnan S, Binder HJ, Singh SK, Omary MB. Keratins modulate colonocyte electrolyte transport via protein mistargeting. J Cell Biol 2004; 164: 911–921. - PMC - PubMed
    1. Loschke F, Seltmann K, Bouameur JE, Magin TM. Regulation of keratin network organization. Curr Opin Cell Biol 2015; 32C: 56–64. - PubMed