

Sarcoidosis in an Italian province. Prevalence and environmental risk factors
- PMID: 28475583
- PMCID: PMC5419555
- DOI: 10.1371/journal.pone.0176859
Sarcoidosis in an Italian province. Prevalence and environmental risk factors
Abstract
Background and aim: Sarcoidosis is a systemic granulomatous inflammatory disease whose causes are still unknown and for which epidemiological data are often discordant. The aim of our study is to investigate prevalence and spatial distribution of cases, and identify environmental exposures associated with sarcoidosis in an Italian province.
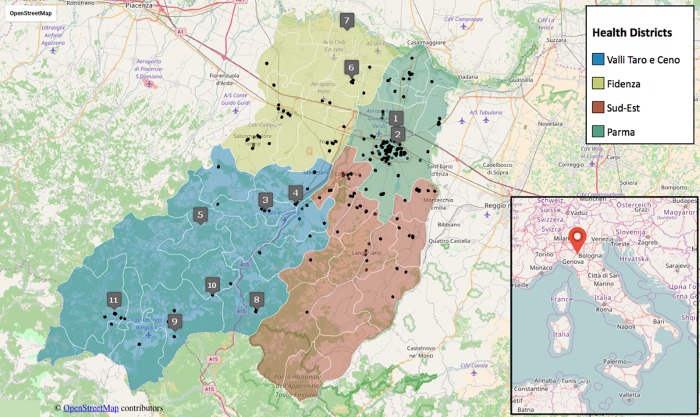
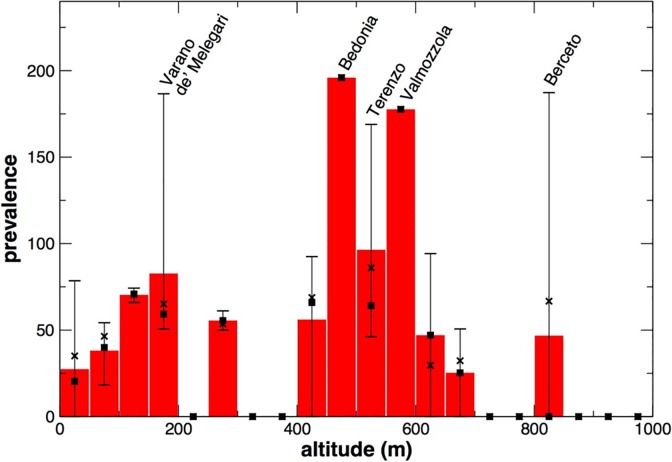
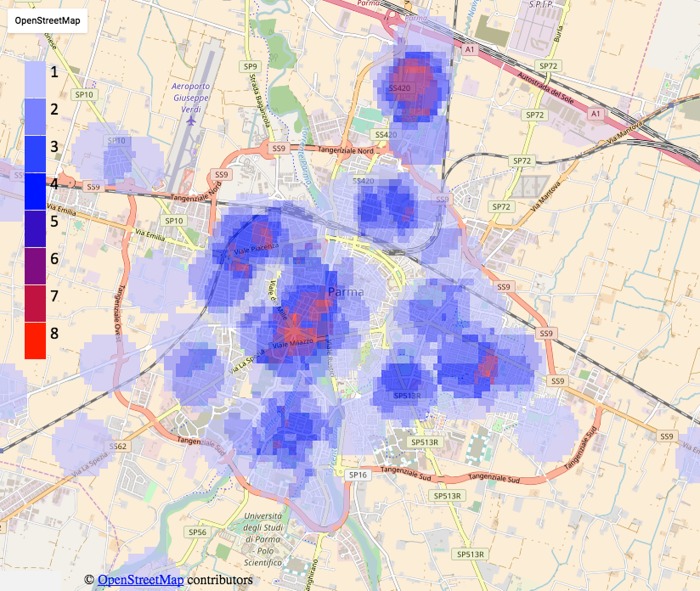
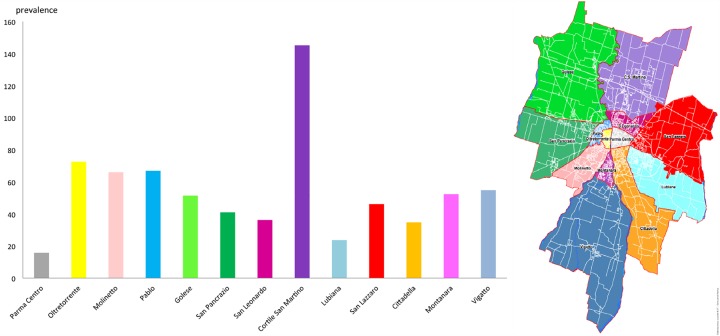
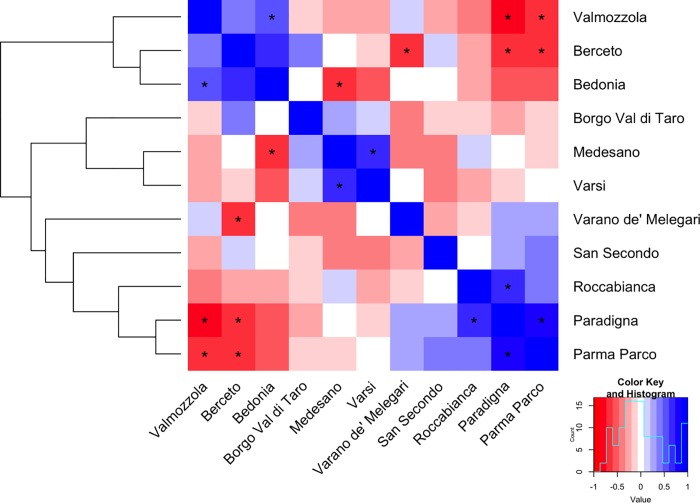
Methods: After georeferentiation of cases, the area under study was subdivided with respect to Municipality and Health Districts and to the altitude in order to identify zonal differences in prevalence. The bioaccumulation levels of 12 metals in lichen tissues were analyzed, in order to determine sources of air pollution. Finally, the analysis of the correlation between metals and between pickup stations was performed.
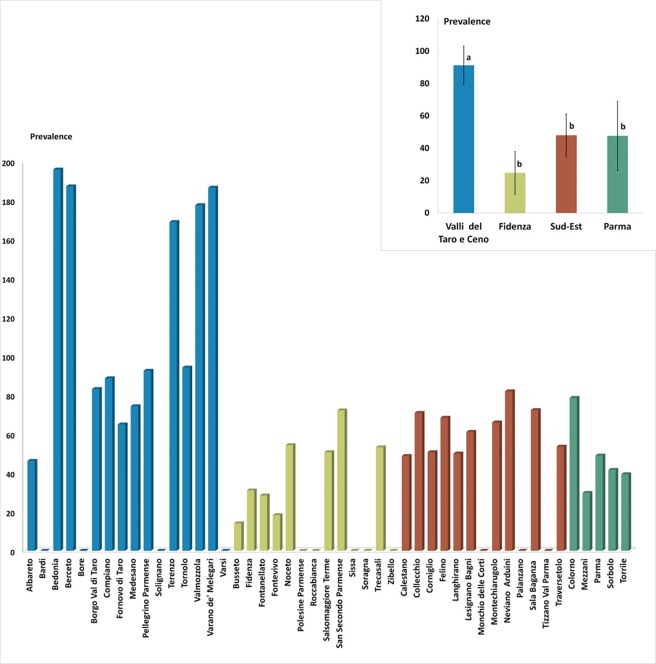
Results: 223 patients were identified (58.3% female and 41.7% male of total) and the mean age was 50.6±15.4 years (53.5±15.5 years for the females and 46.5±14.4 for the males). The mean prevalence was 49 per 100.000 individuals. However, we observed very heterogeneous prevalence in the area under study. The correlations among metals revealed different deposition patterns in lowland area respect to hilly and mountain areas.
Conclusions: The study highlights a high prevalence of sarcoidosis cases, characterized by a very inhomogeneous and patchy distribution with phenomena of local aggregation. Moreover, the bioaccumulation analysis was an effective method to identify the mineral particles that mostly contribute to air pollution in the different areas, but it was not sufficient to establish a clear correlation between the onset of sarcoidosis and environmental risk factors.
Conflict of interest statement
Figures
References
-
- Hunninghake GW, Crystal RG. Pulmonary sarcoidosis: a disorder mediated by excess helper T-lymphocyte activity at sites of disease activity. N Engl J Med 1981;305(8):429–434. doi: 10.1056/NEJM198108203050804 - DOI - PubMed
-
- Valeyre D, Nunes H, Bernaudin JF. Advanced pulmonary sarcoidosis. Curr Opin Pulm Med 2014;20(5):488–495. doi: 10.1097/MCP.0000000000000075 - DOI - PubMed
-
- Agrawal R, Kee AR, Ang L, Hang YT, Gupta V, Kon OM et al. Tuberculosis or sarcoidosis: Opposite ends of the same disease spectrum? Tuberculosis (Edinb) 2016;98:21–6. - PubMed
MeSH terms
LinkOut - more resources
Full Text Sources
Other Literature Sources
Medical
