. 2017 May 5;13(5):e1006348.
doi: 10.1371/journal.ppat.1006348. eCollection 2017 May.

HIV-1 competition experiments in humanized mice show that APOBEC3H imposes selective pressure and promotes virus adaptation

Affiliations

HIV-1 competition experiments in humanized mice show that APOBEC3H imposes selective pressure and promotes virus adaptation

Yusuke Nakano et al. PLoS Pathog. .

Erratum in

Abstract

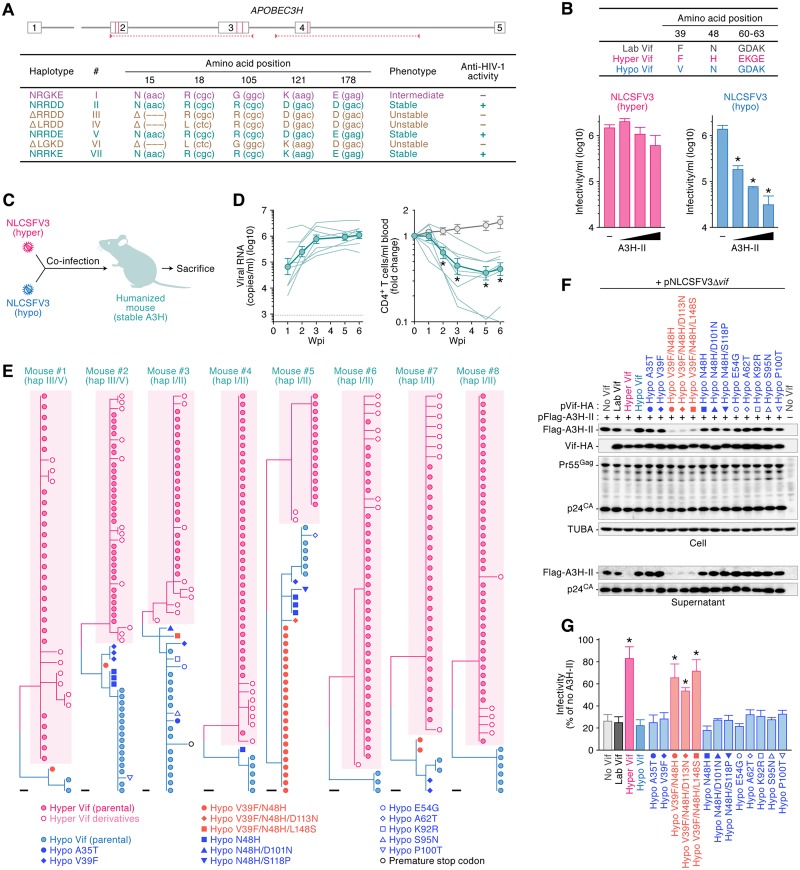
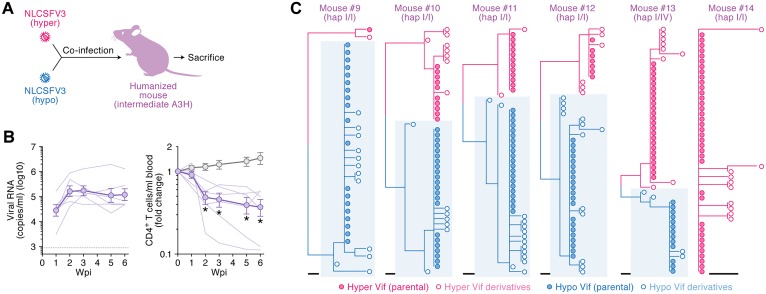
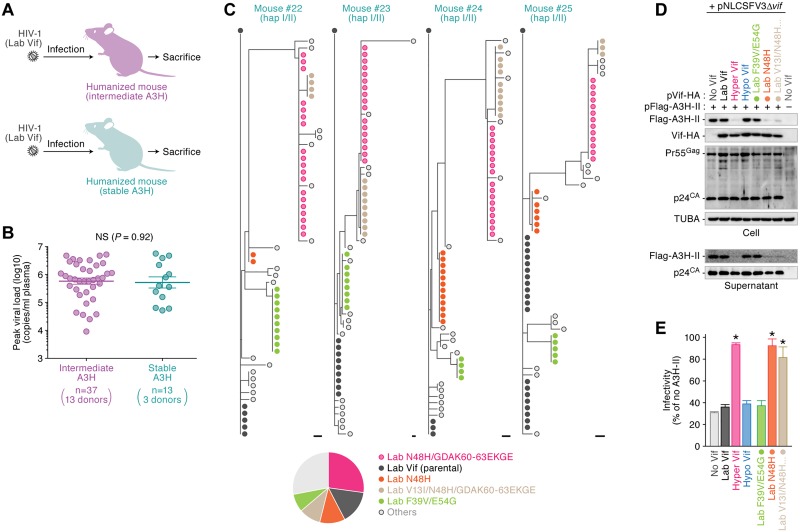
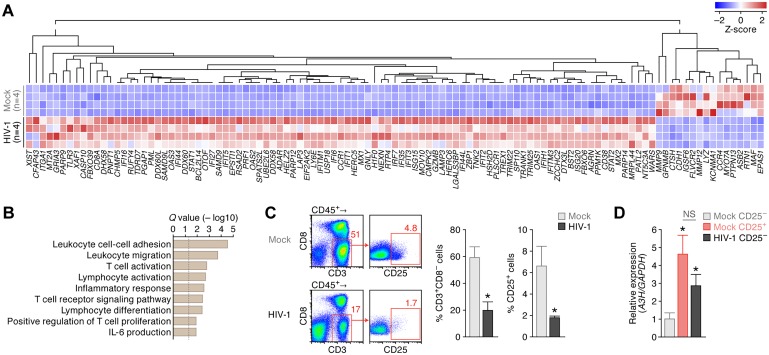
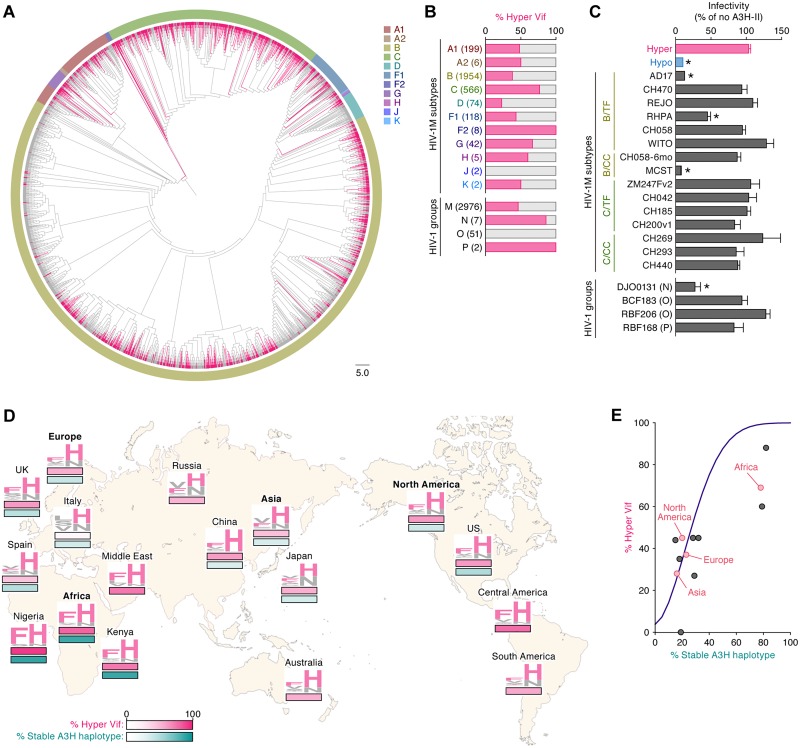
APOBEC3 (A3) family proteins are DNA cytosine deaminases recognized for contributing to HIV-1 restriction and mutation. Prior studies have demonstrated that A3D, A3F, and A3G enzymes elicit a robust anti-HIV-1 effect in cell cultures and in humanized mouse models. Human A3H is polymorphic and can be categorized into three phenotypes: stable, intermediate, and unstable. However, the anti-viral effect of endogenous A3H in vivo has yet to be examined. Here we utilize a hematopoietic stem cell-transplanted humanized mouse model and demonstrate that stable A3H robustly affects HIV-1 fitness in vivo. In contrast, the selection pressure mediated by intermediate A3H is relaxed. Intriguingly, viral genomic RNA sequencing reveled that HIV-1 frequently adapts to better counteract stable A3H during replication in humanized mice. Molecular phylogenetic analyses and mathematical modeling suggest that stable A3H may be a critical factor in human-to-human viral transmission. Taken together, this study provides evidence that stable variants of A3H impose selective pressure on HIV-1.


Conflict of interest statement

RSH is a co-founder, shareholder, and consultant for ApoGen Biotechnologies, Inc. The other authors have no conflicts of interest to declare.

Figures

Fig 1
Fig 1. Dynamics of hyper/hypo HIV-1 infection in stable A3H humanized mice.
(A) A schematic of the A3H gene locus and the 5 polymorphisms in A3H exons 2, 3, and 4 (indicated by red vertical lines) that combine to produce 7 different haplotypes. Red arrowheads with horizontal broken lines indicate the region amplified by genotyping PCR. In the bottom panel, the 7 different A3H haplotypes based on observed protein stability or instability in previous studies [14,15,20] are summarized. (B) (top) A schematic of the Vif protein encoded by HIV-1 used in this study. This panel shows the amino acid differences responsible for the degradation of stable A3H. (bottom) TZM-bl assay. The infectivity of released virions was determined by using TZM-bl cells. *P < 0.05 versus no A3H-II by Student's t test. The assay was performed in triplicate. The data represents average with SD. (C, D) HIV-1 infection in humanized mice. (C) A schematic of co-inoculation of hyper and hypo HIV-1s into stable A3H humanized mice. (D) Hyper and hypo viruses containing 2.5 ng of p24 antigen each (5 ng in total; n = 8) or RPMI1640 (n = 12; for mock infection) were inoculated into humanized mice. the amount of viral RNA in plasma (left) and the level of peripheral CD4+ T cells (CD45+ CD3+ CD4+ cells) (right) were analyzed at 0, 1, 2, 3, 5, and 6 wpi as described in Materials and Methods. The averages are shown in circles with SEMs, and the values from each mouse are shown by line. X-axes, wpi. In the left panel, horizontal broken line indicates detection limit (800 copies/ml plasma). In the right panel, *P < 0.05 versus mock-infected mice by Mann-Whitney U test. (E) Phylogenetic trees of vif sequence. Viral vif sequences in the plasma of infected mice at 6 wpi were analyzed as described in Materials and Methods. Results of each infected mouse (mice #1–8) are respectively shown. Each symbol represents identical sequence. Pink shadow indicates hyper vif derivatives. Scale bar represents one nucleotide substitution. Note that the 3 hypo vif-related sequences with the ability to counteract A3H-II (shown in Fig 1F & 1G) are indicated with red symbols. (F, G) Evaluation of anti-stable A3H activity of Vif derivatives detected in infected humanized mice. (F) Western blotting. The input of cell lysate was standardized to α-Tubulin (TUBA), and representative results are shown. (G) TZM-bl assay. The expression plasmids of the Vif derivatives were cotransfected with pNLCSFV3Δvif and either with or without Flag-tagged A3H-II expression plasmid into HEK293T cells. The infectivity of released virus was determined by using TZM-bl cells, and the percentage of the value of "no A3H-II" is shown. *P < 0.05 versus "no Vif" by Student's t test. The assay was performed in triplicate. The data represents average with SD. In panels F and G, the symbols are identical to those in Fig 1E.
Fig 2
Fig 2. Dynamics of hyper/hypo HIV-1 infection in intermediate A3H humanized mice.
(A, B) HIV-1 infection in humanized mice. (A) A schematic of co-inoculation of hyper and hypo HIV-1s into intermediate A3H humanized mice. (B) Hyper and hypo viruses containing 2.5 ng of p24 antigen each (5 ng in total; n = 6) or RPMI1640 (n = 12; for mock infection) were inoculated into humanized mice. The amount of viral RNA in plasma (left) and the level of peripheral CD4+ T cells (CD45+ CD3+ CD4+ cells) (right) were analyzed at 0, 1, 2, 3, 5, and 6 wpi as described in Materials and Methods. The averages are shown in circles with SEMs, and the values from each mouse are shown by line. X-axes, wpi. In the left panel, horizontal broken line indicates detection limit (800 copies/ml plasma). In the right panel, *P < 0.05 versus mock-infected mice by Mann-Whitney U test. (C) Phylogenetic trees of vif sequence. Viral vif sequences in the plasma of infected mice at 6 wpi were analyzed as described in Materials and Methods. Results of each infected mouse (mice #9–14) are respectively shown. Blue shadow indicates hypo vif derivatives. Scale bar represents one nucleotide substitution.
Fig 3
Fig 3. De novo emergence of hyper Vif in infected humanized mice with stable A3H.
(A, B) HIV-1 infection in humanized mice. (C) A schematic of HIV-1 infection (strains AD8, JRCSF, NLCSFV3 and NL4-3) into the humanized mice with stable or intermediate A3H. (b) Peak VL of infected mice with intermediate or stable A3H. The values of peak VLs of the infected mice with intermediate A3H (n = 37 with 13 individual donors) and stable A3H (n = 13 with 3 individual donors) are summarized. Each dot represents the result from each mouse, and horizontal bars represent the averages with SEMs. NS, no statistic difference. (C) Phylogenetic trees of vif sequence. Viral vif sequences in the plasma of infected mice at 6 wpi were analyzed as described in Materials and Methods. Results of 4 infected mice with stable A3H (mice #22–25) are respectively shown. Each symbol represent identical sequence. Scale bar represents one nucleotide substitution. In the bottom panel, a pie chart represents the proportion of Vif derivatives detected in these infected mice. Raw data is shown in S4 Fig. (D, E) Evaluation of anti-stable A3H activity of Vif derivatives detected in infected mice. (D) Western blotting. The input of cell lysate was standardized to α-Tubulin (TUBA), and representative results are shown. (E) TZM-bl assay. The expression plasmids of the Vif derivatives were cotransfected with pNLCSFV3Δvif and either with or without Flag-tagged A3H-II expression plasmid into HEK293T cells. The infectivity of released virus was determined by using TZM-bl cells, and the percentage of the value of "no A3H-II" is shown. *P < 0.05 versus "no Vif" by Student's t test. The assay was performed in triplicate. The data represents average with SD. In panels C-E, "Lab Vif" indicates NLCSFV3 Vif. In panels D and E, the symbols are identical to those in Fig 3C.
Fig 4
Fig 4. Immune activation and up-regulation of endogenous A3H expression in the human CD4+ T cells of infected humanized mice.
(A, B) RNA-seq of the splenic human MNCs of infected humanized mice. (A) RNA-seq. Results of differentially expressed gene analysis from the splenic human MNCs of HIV-1-infected (n = 4) and mock-infected (n = 4) humanized mice are shown as a heatmap. (B) GSEA analysis. The procedure is described in Material and Method, and the top 50 annotations are listed in S8 Table. The vertical broken line indicates Q value = 0.05. (C, D) A3H expression in the human CD4+ T cells of infected mice. (C) Flow cytometry. Human MNCs were isolated from the spleen of HIV-1-infected (n = 6) and mock-infected (n = 6) humanized mice and analyzed the proportion of CD4+ T cells (CD45+ CD3+ CD8 cells) and activated CD4+ T cells (CD45+ CD3+ CD8 CD25+ cells) by flow cytometry. Representative dot plots (left), the percentage of CD3+ CD8 cells in CD45+ cells (middle) and the percentage of CD25+ cells in CD3+ CD8 cells (right) are respectively shown. *P < 0.05 versus mock-infected mice by Mann-Whitney U test. In panel C, the numbers on each dot plot indicates the percentage of gated cells. (D) Real-time RT-PCR of A3H. Activated CD4+ T cells (CD45+ CD3+ CD8 CD25+ cells) and non-activated CD4+ T cells (CD45+ CD3+ CD8 CD25 cells) of mock-infected mice (n = 6 each) and CD25 CD4+ T cells (CD45+ CD3+ CD8 CD25 cells) of HIV-1-infected mice (n = 6) were sorted using FACSJazz (see also S7 Fig). The mRNA expression level of A3H in each population was analyzed by real-time RT-PCR as described in Materials and Methods. The value of CD25 CD4+ T cells of mock-infected mice is set as 1. *P < 0.05 versus CD25 CD4+ T cells of mock-infected mice by Mann-Whitney U test. NS, no statistic difference. Note that CD25+ CD4+ T cells of infected mice were not available because this fraction was severely depleted (panel C).
Fig 5
Fig 5. Dynamics of hyper/hypo HIV-1 dissemination in human population.
(A) A phylogenetic tree of Vif. The Vif sequences were extracted from HIV-1 sequence database (https://www.hiv.lanl.gov/components/sequence/HIV/search/search.html) and the phylogenetic tree was constructed as described in Materials and Methods. The branches of hyper Vif sequences (i.e., F or Y in position 39 and H in position 48) are indicated with pink. Each color surrounding the phylogenetic tree represents viral subtype (A1-K). Scale bar indicates 5.0 amino acid substitutions per site. (B) The percentage of hyper Vif sequences in each subtype and group. The sequences of HIV-1 Vif is classified into hyper and hypo Vif based on the amino acids positioned at 39 and 48 and the result is summarized. The numbers in parentheses represents the number of Vif sequences used. See also S10 Table. (C) TZM-bl assay. The IMCs (1,000 ng) were cotransfected either with or without Flag-tagged A3H-II expression plasmid (50 ng) into HEK293T cells. The infectivity of released virus was determined by using TZM-bl cells, and the percentage of the value of "no A3H-II" is shown. *P < 0.05 versus "hyper HIV-1" by Student's t test. The assay was performed in triplicate. The data represents average with SD. TF, transmitted/founder; CC, chronic control. See also S9 Table. (D) Distribution of hyper HIV-1 and individuals with stable A3H in the world. The percentages of hyper HIV-1 (pink, top) and stable A3H haplotype (green, bottom) in each region (Europe, Africa, Asia and North America; represented in bold) and country were obtained as described in Materials and Methods, and these two values are indicated by heatmap. The Vif amino acids at positions 39 and 48 are shown in logoplot, and the residues associated with hyper Vif (i.e., F or Y in position 39 and H in position 48) are represented in pink. Note that the information of the proportion of A3H haplotype is not available in Russia, Australia, Central America and South America. See also S11 Table. (E) Mathematical modeling of the dissemination of hyper HIV-1 in human population. The prevalence of hyper HIV-1 in the human population with different stable A3H proportion was simulated by the mathematical model (for the detail, see Materials and methods). The simulated prediction is shown with purple line. Red and Black dots indicate the results from respective regions and countries (see also S9 Fig & S12 Table).

Similar articles

Cited by

References

    1. LaRue RS, Andresdottir V, Blanchard Y, Conticello SG, Derse D, et al. (2009) Guidelines for naming nonprimate APOBEC3 genes and proteins. J Virol 83: 494–497. 10.1128/JVI.01976-08 - DOI - PMC - PubMed
    1. Harris RS, Dudley JP (2015) APOBECs and virus restriction. Virology 479–480: 131–145. 10.1016/j.virol.2015.03.012 - DOI - PMC - PubMed
    1. Zhang J (2003) Evolution by gene duplication: an update. Trends Ecol Evol 18: 292–298.
    1. Sawyer SL, Emerman M, Malik HS (2004) Ancient adaptive evolution of the primate antiviral DNA-editing enzyme APOBEC3G. PLOS Biol 2: E275 10.1371/journal.pbio.0020275 - DOI - PMC - PubMed
    1. Sheehy AM, Gaddis NC, Choi JD, Malim MH (2002) Isolation of a human gene that inhibits HIV-1 infection and is suppressed by the viral Vif protein. Nature 418: 646–650. - PubMed

MeSH terms