

doi: 10.1093/neuonc/now207.
CBTRUS Statistical Report: Primary Brain and Other Central Nervous System Tumors Diagnosed in the United States in 2009-2013
Affiliations
- PMID: 28475809
- PMCID: PMC8483569
- DOI: 10.1093/neuonc/now207
Item in Clipboard
CBTRUS Statistical Report: Primary Brain and Other Central Nervous System Tumors Diagnosed in the United States in 2009-2013
Neuro Oncol.
.
No abstract available
Figures
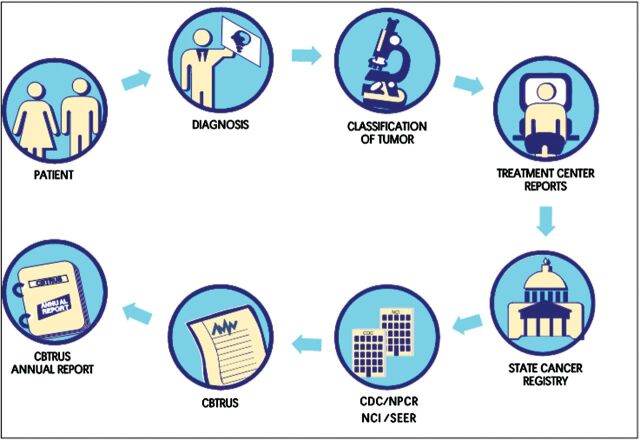
Schematic of Cancer Registration Process for CBTRUS Reporting.
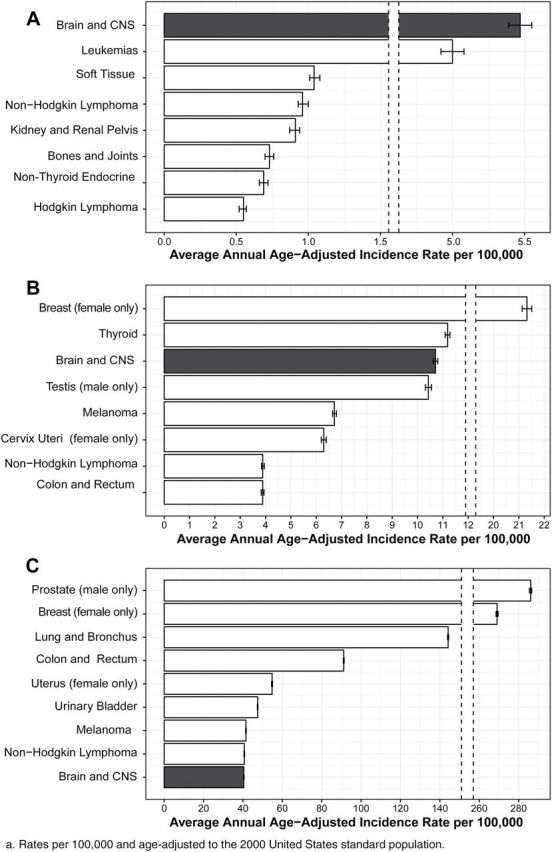
Average Annual Age-Adjusted Incidence Ratesa of All Primary Brain and Other CNS Tumors in Comparison to Other Common Cancers for A) Children Age 0-14 Years, B) Adolescents and Young Adults Age 15-39 Years, and C) Older Adults Age 40+ Years, CBTRUS Statistical Report: NPCR and SEER 2009-2013, USCS, 2009-2013.
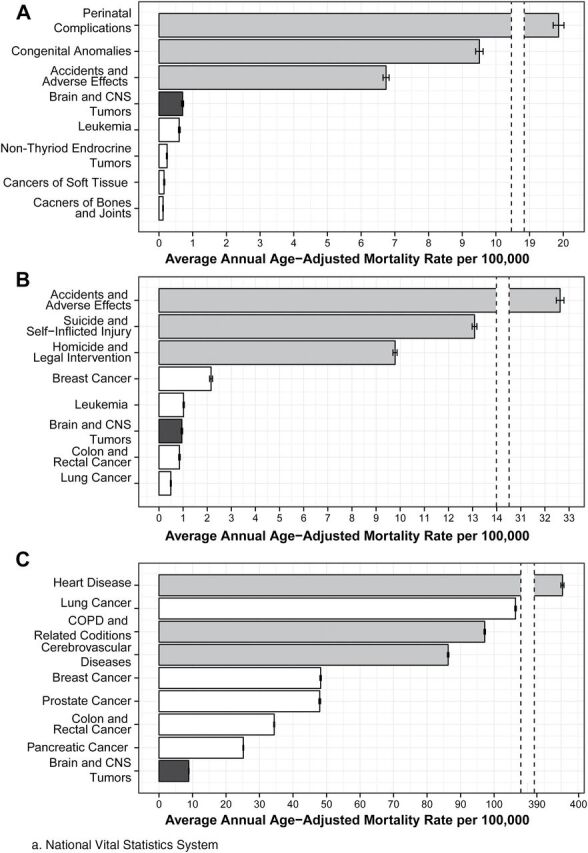
Average Annual Age-Adjusted Mortality Rates of All Primary Brain and Other CNS Tumors in Comparison to Other Common Cancers and Top Three Non-Cancer Causes of Death for A) Children Age 0-14 Years, B) Adolescents and Young Adults Age 15-39 Years, and C) Older Adults Age 40+ Years, CBTRUS Statistical Report: NVSSa, 2009-2013.
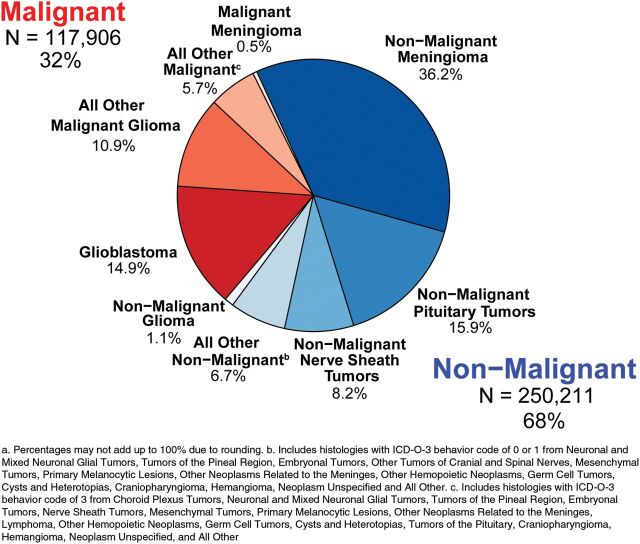
Distributiona of Primary Brain and Other CNS Tumors by Behavior (N=368,117), CBTRUS Statistical Report: NPCR and SEER, 2009-2013.
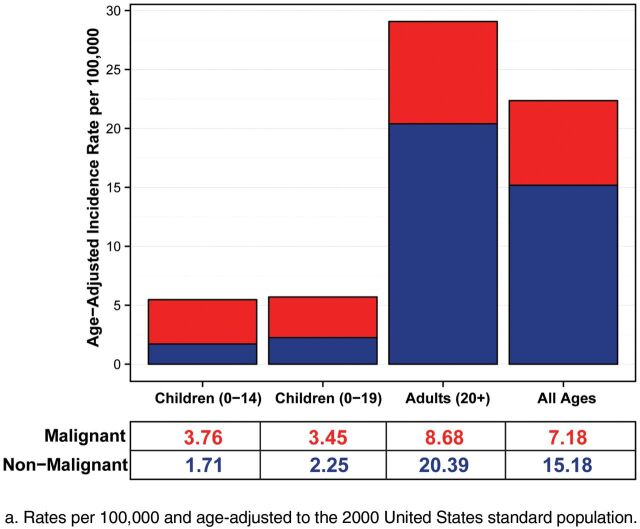
Average Annual Age-Adjusted Incidence Ratesa of Primary Brain and Other CNS Tumors by Age and Behavior, CBTRUS Statistical Report: NPCR and SEER, 2009-2013.
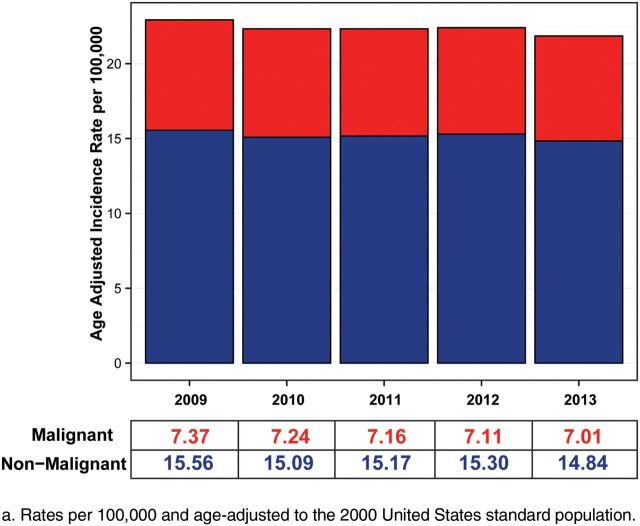
Annual Age-Adjusted Incidence Ratesa of Primary Brain and Other CNS Tumors by Year and Behavior, CBTRUS Statistical Report: NPCR and SEER, 2009-2013.
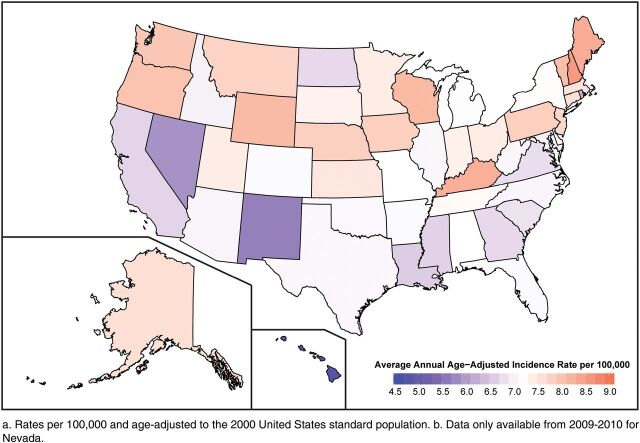
Average Annual Age-Adjusted Incidence Ratesa of Malignant Primary Brain and Other CNS Tumors by Central Cancer Registry, CBTRUS Statistical Report: NPCR and SEER, 2009-2013b.
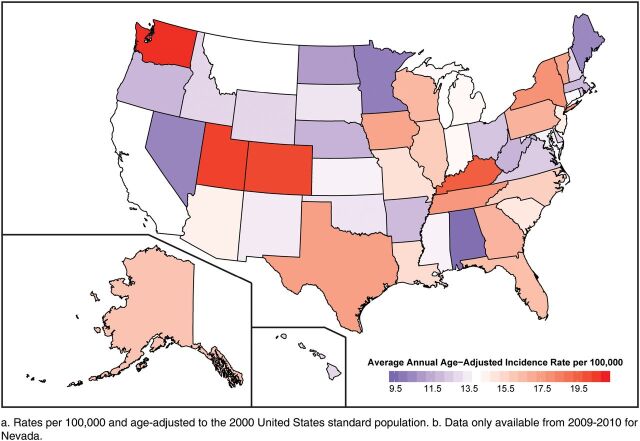
Average Annual Age-Adjusted Incidence Ratesa of Non-Malignant Primary Brain and Other CNS Tumors by Central Cancer Registry, CBTRUS Statistical Report: NPCR and SEER, 2009-2013b.
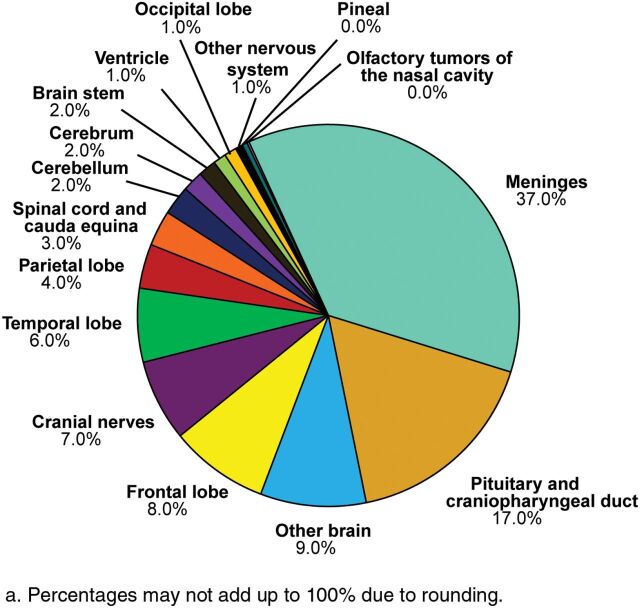
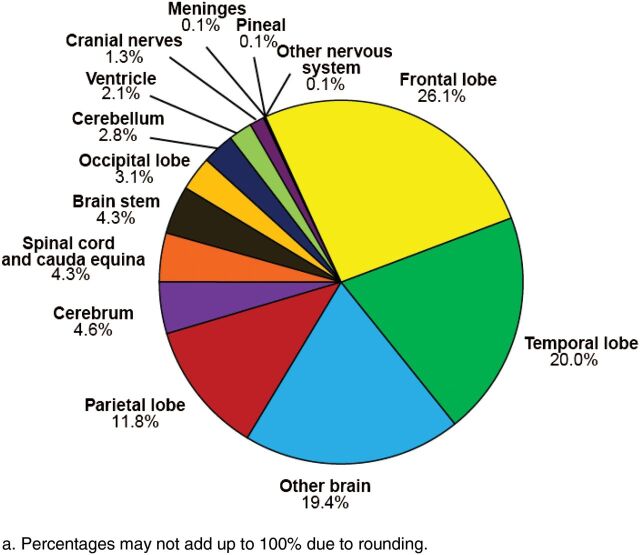
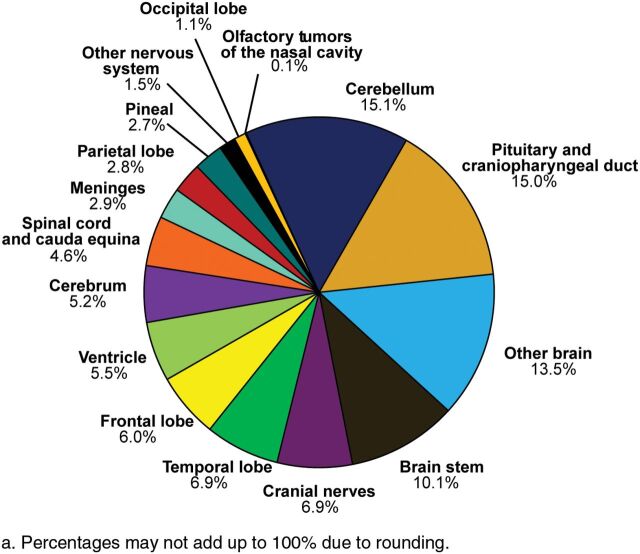
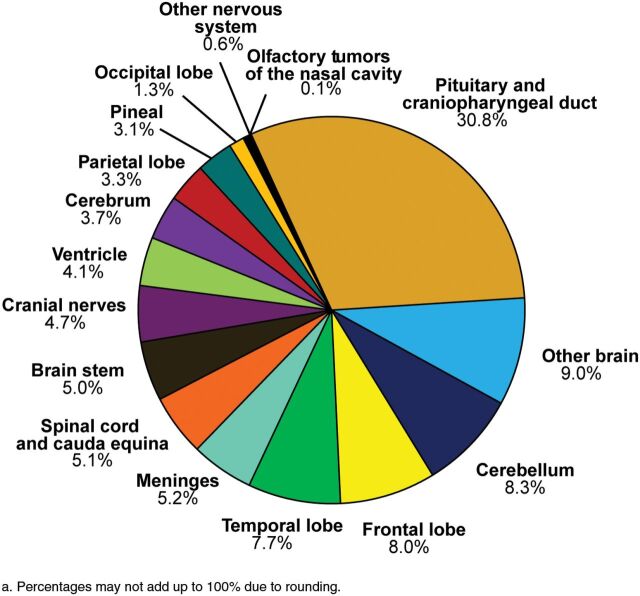
Distributiona of All Primary Brain and Other CNS Tumors by Site (N=368,117), CBTRUS Statistical Report: NPCR and SEER, 2009-2013.
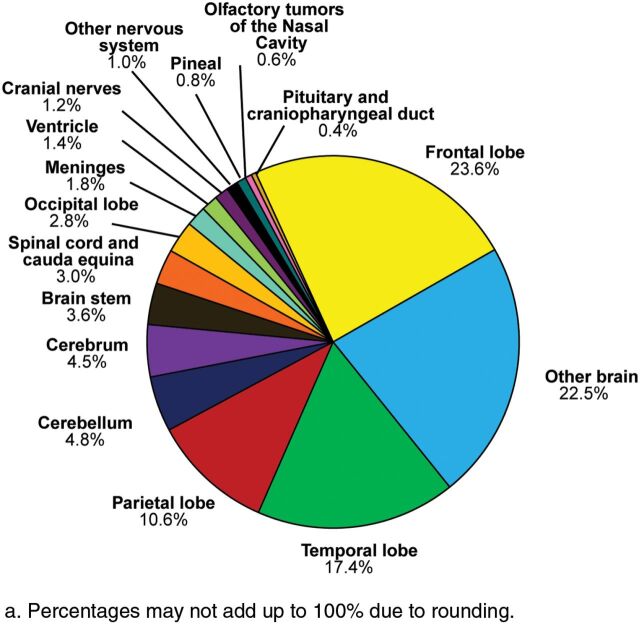
Distributiona of Malignant Primary Brain and Other CNS Tumors by Site (N=117,906), CBTRUS Statistical Report: NPCR and SEER, 2009-2013.
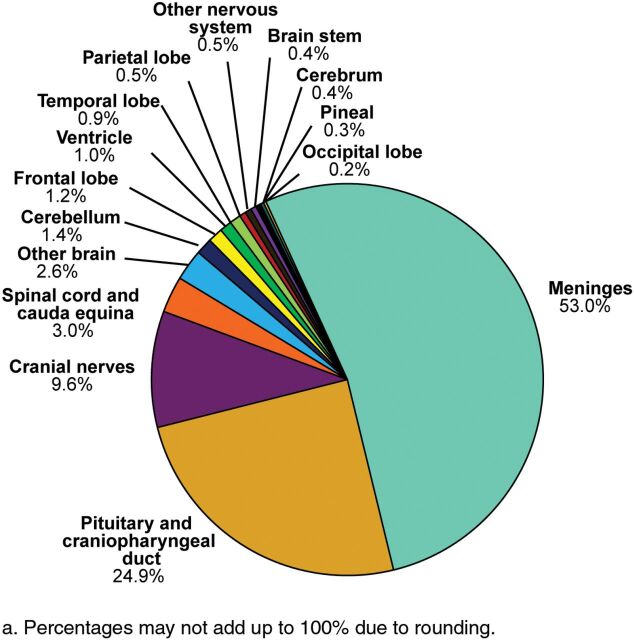
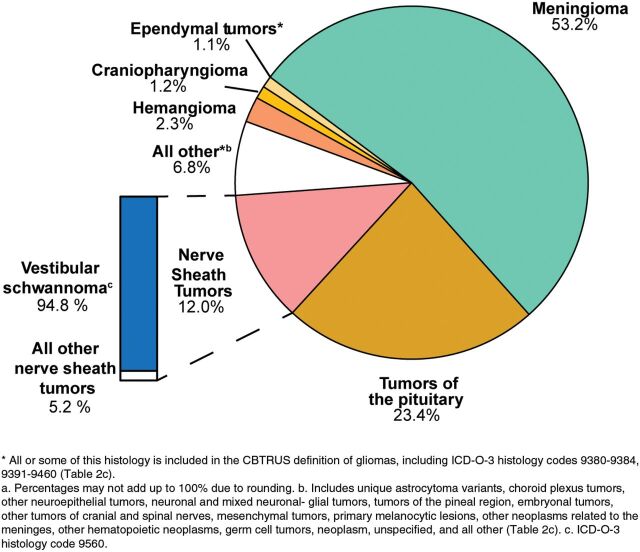
Distributiona of Non-Malignant Primary Brain and Other CNS Tumors by Site (N=250,211), CBTRUS Statistical Report: NPCR and SEER, 2009-2013.
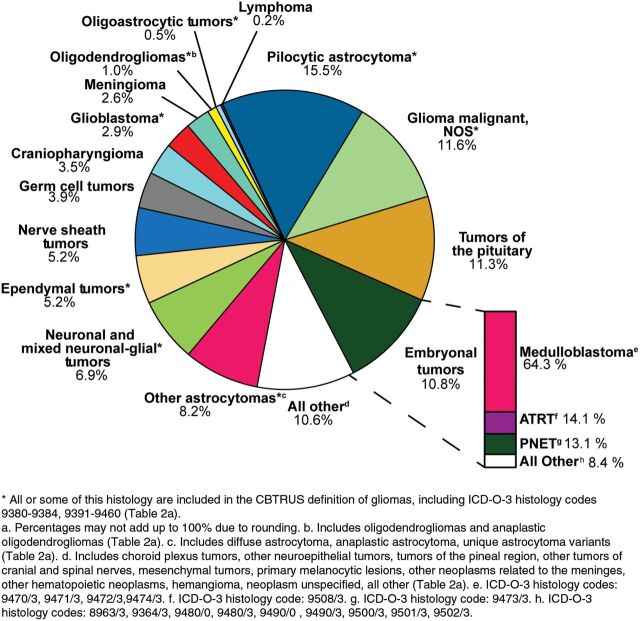
Distributiona of All Primary Brain and Other CNS Tumors by CBTRUS Histology Groupings and Histology (N=368,117), CBTRUS Statistical Report: NPCR and SEER, 2009-2013.
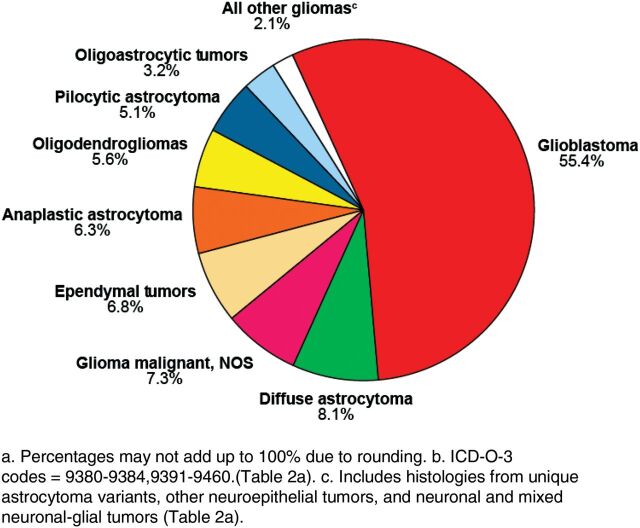
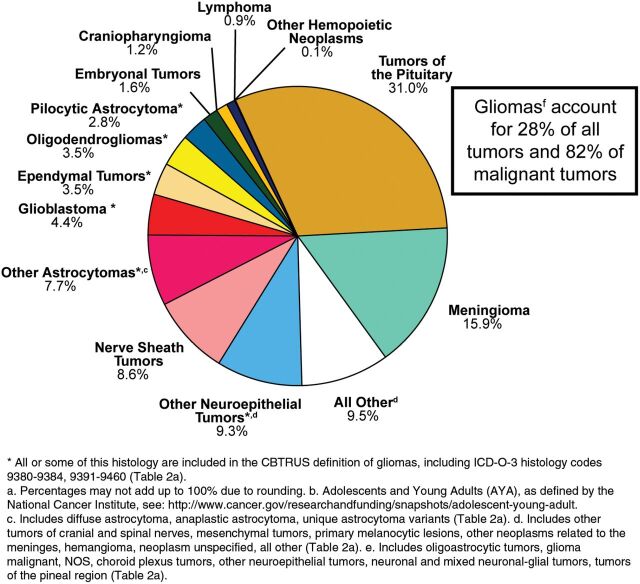
Distributiona of Malignant Primary Brain and Other CNS Tumors by CBTRUS Histology Groupings and Histology (N=117,906), CBTRUS Statistical Report: NPCR and SEER, 2009-2013.
Distributiona of Non-Malignant Primary Brain and Other CNS Tumors by CBTRUS Histology Groupings and Histology (N=250,211), CBTRUS Statistical Report: NPCR and SEER, 2009-2013.
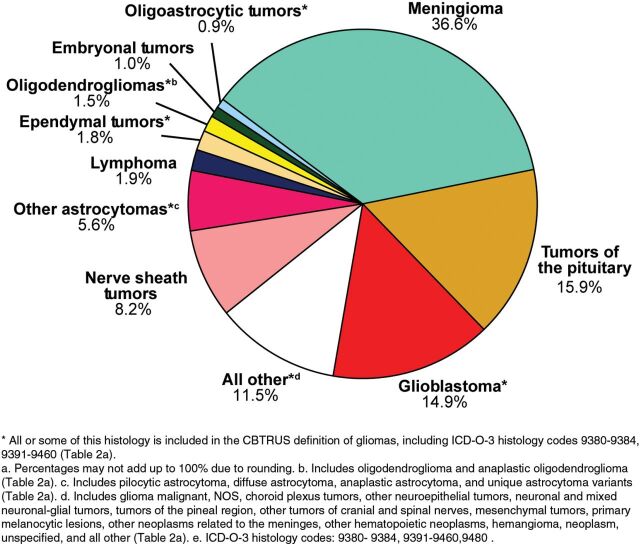
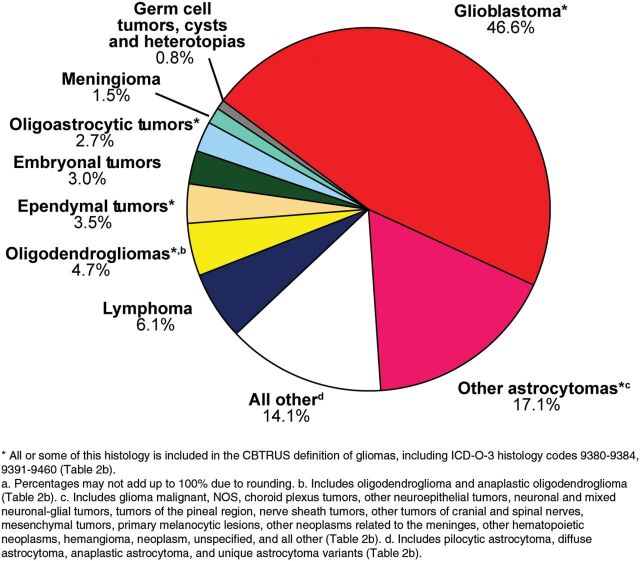
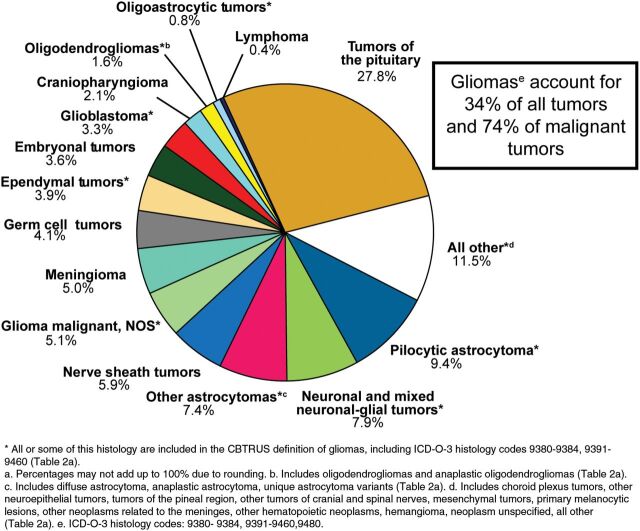
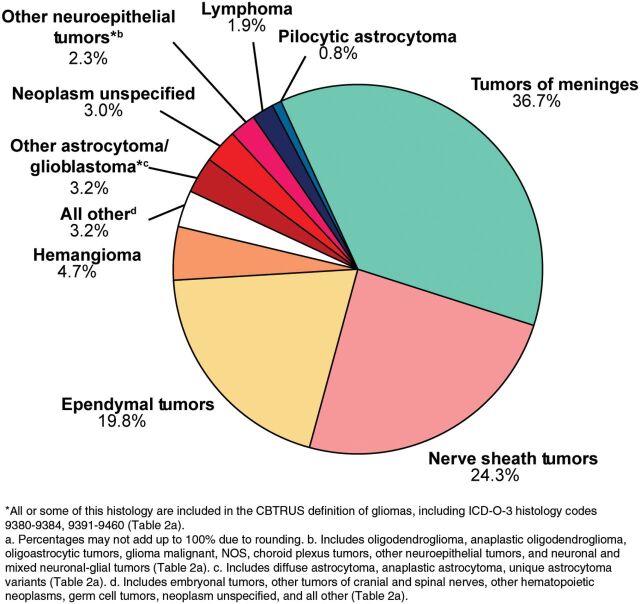
Distributiona of Primary Brain and Other CNS Gliomasb by Histology Subtypes (N=99,165), CBTRUS Statistical Report: NPCR and SEER, 2009-2013.
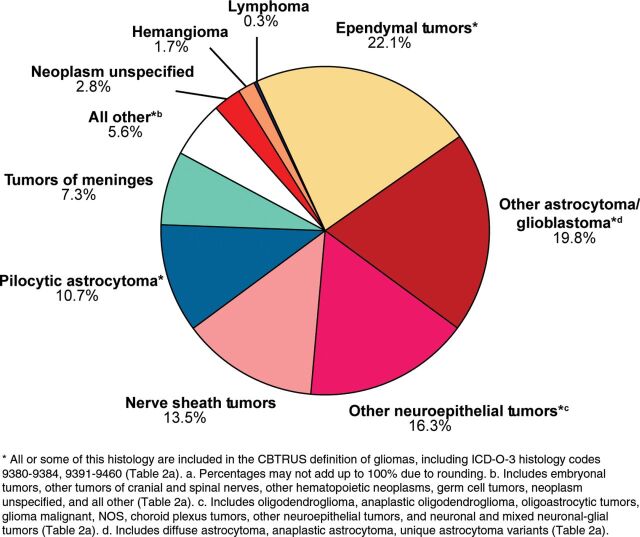
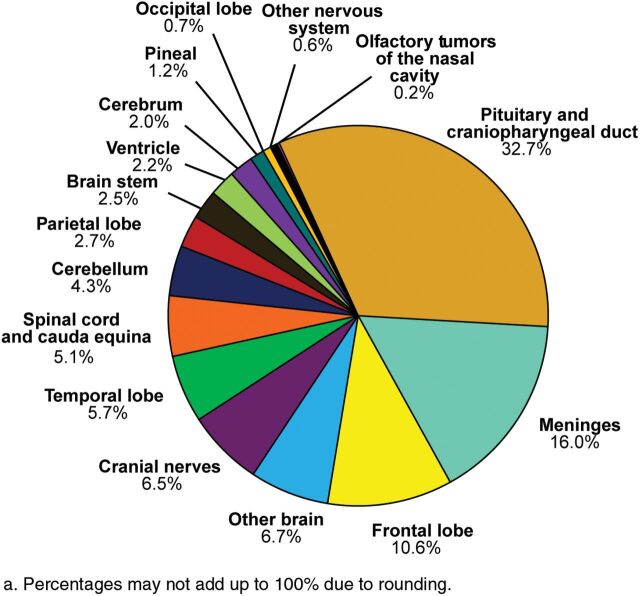
Distribution of Primary Brain and Other CNS Gliomasa by Site (N=99,165), CBTRUS Statistical Report: NPCR and SEER, 2009-2013.
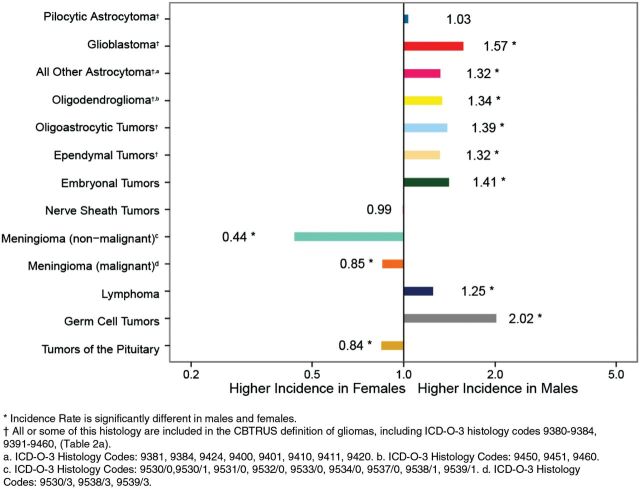
Incidence Rate Ratios by Sex (Males:Females) for Selected CBTRUS Histology Groupings and Histology, CBTRUS Statistical Report: NPCR and SEER, 2009-2013.
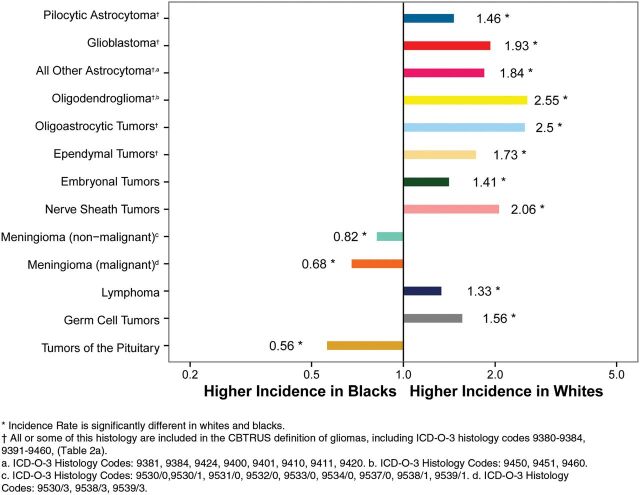
Incidence Rate Ratios by Race (Whites:Blacks) for Selected CBTRUS Histology Groupings and Histologies, CBTRUS Statistical Report: NPCR and SEER, 2009-2013.
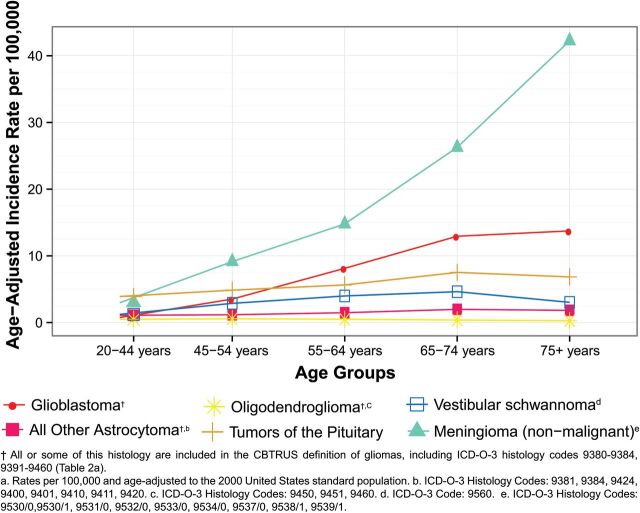
Age-Adjusted Incidence Ratesa of Brain and Other CNS Tumors by Selected Histologies and Age Groups (Age 20+ Years), CBTRUS Statistical Report: NPCR and SEER, 2009-2013.
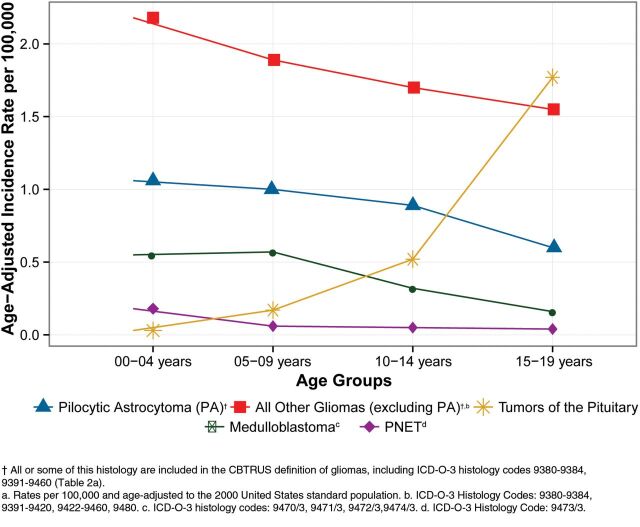
Age-Adjusted Incidence Ratesa in Children and Adolescents of Brain and Other CNS Tumors by Selected Histologies and Age Groups (Age 0-19 Years), CBTRUS Statistical Report: NPCR and SEER, 2009-2013.
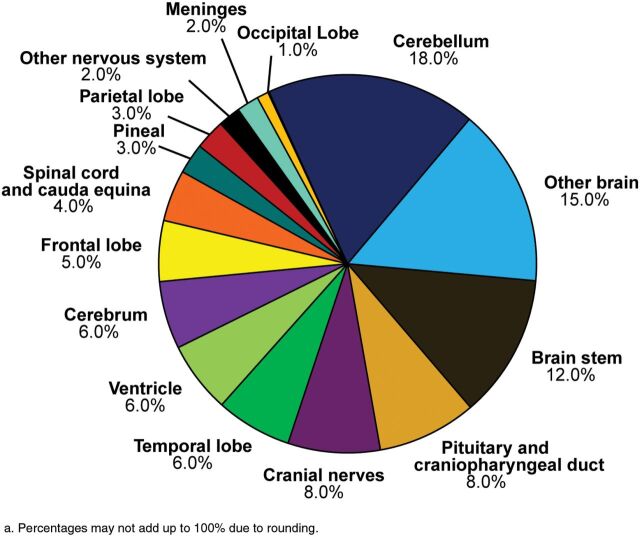
Distributiona in Children and Adolescents (Age 0-19 Years) of Primary Brain and CNS Tumors by Site (N=23,522), CBTRUS Statistical Report: NPCR and SEER, 2009-2013.
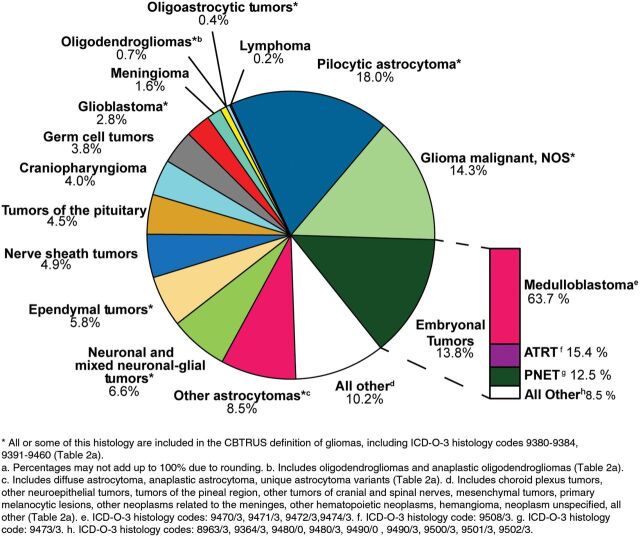
Distributiona in Children and Adolescents (Age 0-19 Years) of Primary Brain and Other CNS Tumors by CBTRUS Histology Groupings and Histology (N=23,522), CBTRUS Statistical Report: NPCR and SEER, 2009-2013.
Distributiona in Children (Age 0-14 Years) of Primary Brain and Other CNS Tumors by Site (N=16,653), CBTRUS Statistical Report: NPCR and SEER, 2009-2013.
Distributiona in Children (Age 0-14 Years) of Primary Brain and Other CNS Tumors by CBTRUS Histology Groupings and Histology (N=16,653), CBTRUS Statistical Report: NPCR and SEER, 2009-2013.
Distributiona in Adolescentsb (Age 15-19 Years) of Primary Brain and Other CNS Tumors by Site (N=6,869), CBTRUS Statistical Report: NPCR and SEER, 2009-2013.
Distributiona in Adolescents (Age 15-19 Years) of Primary Brain and Other CNS Tumors by Histology (N=6,869), CBTRUS Statistical Report: NPCR and SEER, 2009-2013.
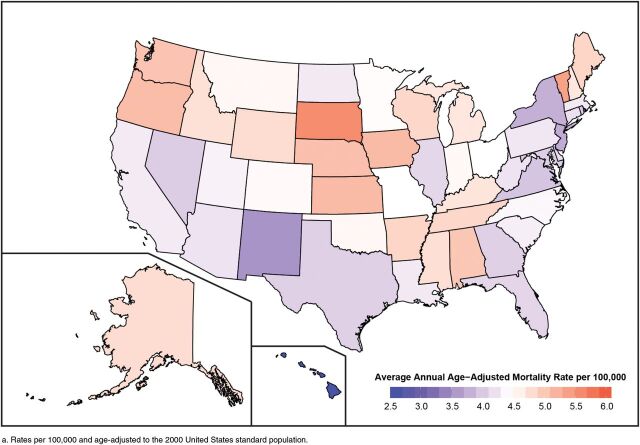
Average Annual Age-Adjusted Mortality Ratesa for Malignant Primary Brain and Other CNS Tumors by Central Cancer Registry, CBTRUS Statistical Report: NCHS, 2009-2013.
Distributiona of Primary Spinal Cord, Spinal Meninges, and Cauda Equina Tumors in Children and Adolescents (Age 0-19 Years), CBTRUS Histology Groupings and Histology (N=1,307), CBTRUS Statistical Report: NPCR and SEER, 2009-2013.
Distributiona of Primary Spinal Cord, Spinal Meninges, and Cauda Equina Tumors in Adults (Age 20+ Years), CBTRUS Histology Groupings and Histology (N=16,014) CBTRUS Statistical Report: NPCR and SEER, 2009-2013.
Distributiona in Adolescents and Young Adultsb (Age 15-39 Years) of Primary Brain and Other CNS Tumors by Site (N=54,388), CBTRUS Statistical Report: NPCR and SEER, 2009-2013.
Distributiona in Adolescents and Young Adultsb (Age 15-39 Years) of Primary Brain and Other CNS Tumors by Histology (N=54,388), CBTRUS Statistical Report: NPCR and SEER, 2009-2013.
References
-
- Centers for Disease Control and Prevention (CDC). National Program of Cancer Registries Cancer Surveillance System Rationale and Approach. 1999; http://www.cdc.gov/cancer/npcr/pdf/npcr_css.pdf.
-
- Cancer Registries Amendment Act, 102nd Cong. § 5151992; http://www.gpo.gov/fdsys/pkg/STATUTE-106/pdf/STATUTE-106-Pg3372.pdf.
-
- Benign Brain Tumor Cancer Registries Amendment Act, 107th Cong. § 2602002; http://www.gpo.gov/fdsys/pkg/PLAW-107publ260/pdf/PLAW-107publ260.pdf.
-
- National Cancer Institute. Overview of the SEER Program. http://seer.cancer.gov/about/overview.html.
-
- Wohrer A, Waldhor T, Heinzl H, et al. The Austrian brain tumour registry: a cooperative way to establish a population-based brain tumour registry. J Neurooncol. 2009;95(3):401–411 - PubMed
Publication types
MeSH terms
LinkOut - more resources
Full Text Sources
Other Literature Sources
Medical
