Comparative Study
. 2017 Oct 15;196(8):1050-1059.
doi: 10.1164/rccm.201702-0377OC.

Comparing Drivers and Dynamics of Tuberculosis in California, Florida, New York, and Texas

Affiliations
Comparative Study

Comparing Drivers and Dynamics of Tuberculosis in California, Florida, New York, and Texas

Sourya Shrestha et al. Am J Respir Crit Care Med. .

Abstract

Rationale: There is substantial state-to-state heterogeneity in tuberculosis (TB) in the United States; better understanding this heterogeneity can inform effective response to TB at the state level, the level at which most TB control efforts are coordinated.

Objectives: To characterize drivers of state-level heterogeneity in TB epidemiology in the four U.S. states that bear half the country's TB burden: California, Florida, New York, and Texas.

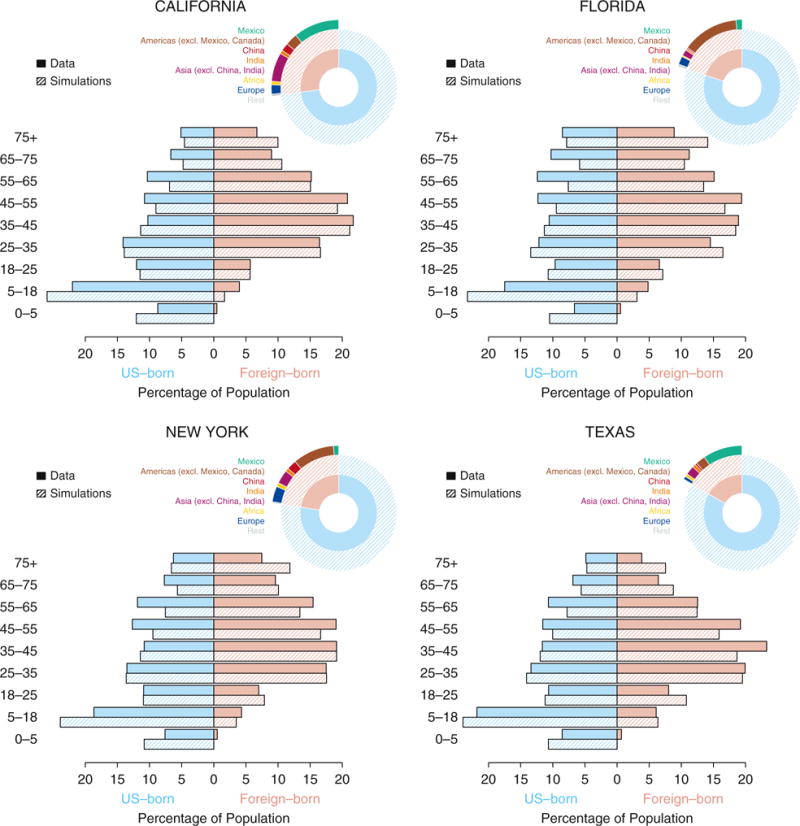
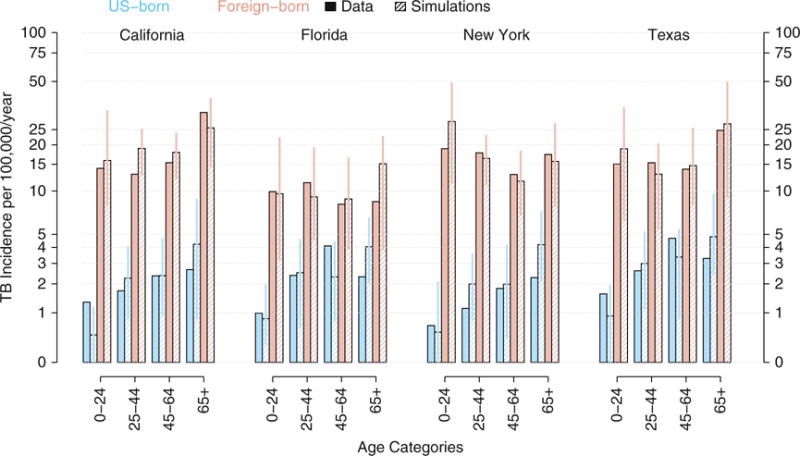
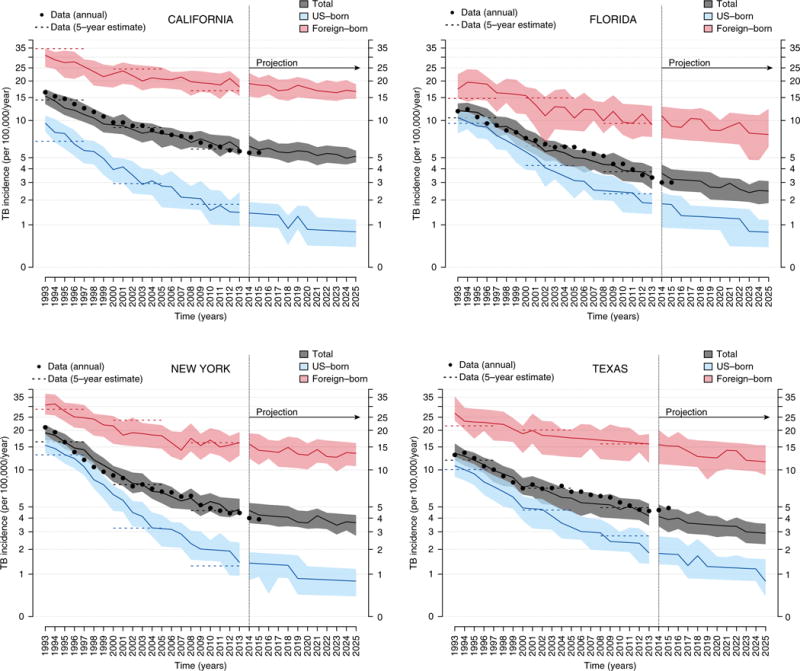
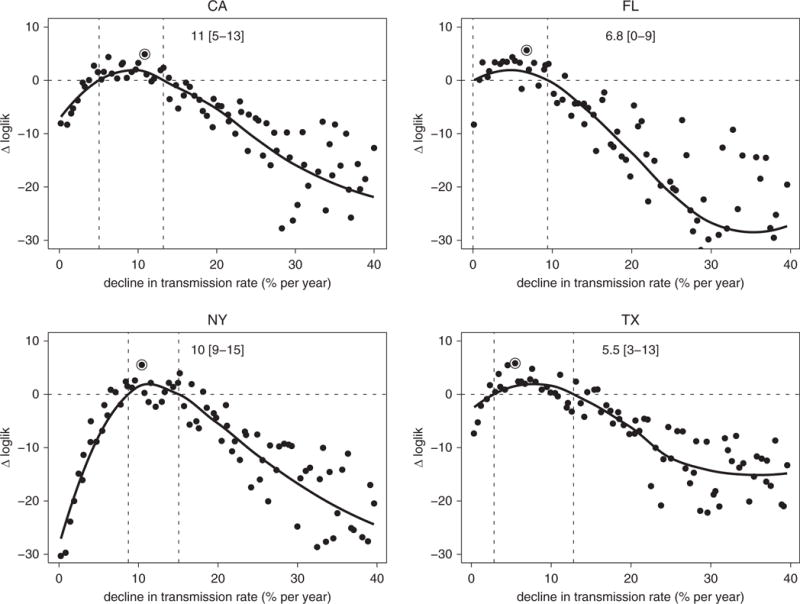
Methods: We constructed an individual-based model of TB in the four U.S. states and calibrated the model to state-specific demographic and age- and nativity-stratified TB incidence data. We used the model to infer differences in natural history of TB and in future projections of TB.

Measurements and main results: We found that differences in both demographic makeup (particularly the size and composition of the foreign-born population) and TB transmission dynamics contribute to state-level differences in TB epidemiology. The projected median annual rate of decline in TB incidence in the next decade was substantially higher in Texas (3.3%; 95% range, -5.6 to 10.9) than in California (1.7%; 95% range, -3.8 to 7.1), Florida (1.5%; 95% range, -7.4 to 14), and New York (1.9%; 95% range, -6.4 to 9.8). All scenarios projected a flattening of the decline in TB incidence by 2025 without additional resources or interventions.

Conclusions: There is substantial state-level heterogeneity in TB epidemiology in the four states, which reflect both demographic factors and potential differences in the natural history of TB. These differences may inform resource allocation decisions in these states.

Keywords: geographical heterogeneity in tuberculosis; mathematical modeling of tuberculosis; tuberculosis; tuberculosis in the United States.


Figures

Figure 1
Figure 1
Schematic representation of the modeling framework. (A) Natural history of tuberculosis (TB) was captured in this framework by individual transitions between the four stages: uninfected, latent TB infection (LTBI), active TB, and after treatment. Individuals are born uninfected and acquire LTBI at a rate commensurate with the local force of infection. Individuals with LTBI reactivate to develop active TB disease, at a rate reflecting both age and time since infection. On receiving successful treatment, an individual progresses to the post-treatment stage. Both individuals with LTBI and treated individuals can be reinfected; individuals with previous history of TB are modeled to have partial protection against reinfection. (B) The reactivation rate among individuals with LTBI was modeled to decline continuously over time: the further away an individual is from the time of infection, the smaller the rate. Reactivation rates are also assumed to increase with age (not shown in this illustration; see online supplement for details). (C) Immigration was modeled as importation of individuals from one of the eight regions as described in METHODS. The region-specific size of the immigrant population varied by state. Individuals arriving to the United States were apportioned as uninfected, LTBI, or TB at arrival according to the TB prevalence in the region of origin.
Figure 2
Figure 2
Comparisons of state-level demographic data and model simulations. For each of the four states (California, Florida, New York, and Texas), the pie charts show the size of the population that are U.S. (in light blue) and foreign (in pink) born, and their further subdivisions by eight regions: (1) Mexico, (2) Americas excluding Mexico and Canada, (3) China, (4) India, (5) Asia excluding China and India, (6) Africa, (7) Europe, and (8) rest of the world. The horizontal bars show the distribution of the population (light blue showing U.S. born, and pink showing foreign born) by age categories indicated on the side. The data (solid bars) are obtained from 5-year estimates (2009–2014) of the American Community Survey. Shown in hatched bars are the distributions in simulations of the calibrated models for each of the states.
Figure 3
Figure 3
Reported and model-based estimates of annual tuberculosis (TB) incidence from 2009 to 2013, by age and origin (U.S. vs. foreign born) for each of the four states. The bar charts show TB incidence in California, Florida, New York, and Texas (from left to right), for the 5-year time period spanning 2009 to 2013. TB incidence is categorized by age in four categories (labeled at the bottom) and country of origin (U.S. born in light blue and foreign born in pink). The solid bars show reported data: TB case report data were obtained from Online Tuberculosis Information System (OTIS) data repository (9), and data on demographics were obtained from the American Community Survey (8). The hatched bars show model-based estimates: shown are medians (and 95% range) in 100 replicated simulations of the model, with maximum-likelihood estimates for each of the four states.
Figure 4
Figure 4
Model-based simulations and projections of trends in tuberculosis (TB) incidence in four states. Shown are model-based simulations in trends of TB incidence between 1993 and 2013 followed by projections up to 2025 for each of four states: California (top left), Florida (top right), New York (bottom left), and Texas (bottom right). The simulations are based on the state-specific maximum likelihood estimate (MLE) models, and projections are the continuation of model simulations (with continued decline in the transmission rates at the post-1993 estimate). For each panel, shown are medians (solid lines) and interquartile range (shaded area) of 100 replicate simulations of the MLE models. Shown in black dots are data for annual TB incidence between 1993 and 2015. Shown in dashed lines is the estimated mean annual TB incidence (based on data) in each state in three 5-year periods of 1993 to 1997, 2001 to 2005, and 2009 to 2013. The foreign-born population is represented in pink, U.S.-born population in light blue, and the total population in gray.
Figure 5
Figure 5
Estimated annual declines in tuberculosis transmission rates. Likelihood profiles (shown in a log scale as a difference with Δloglik = 0 representing the estimated 95% threshold) for the annual rates of decline in the transmission rate (in %/yr) in the four states: California (top left), Florida (top right), New York (bottom left), and Texas (bottom right). Each point on the profile represents the log-likelihood of each estimate (on the y-axis) maximized over all parameters with the decline in transmission held at the level on the x-axis. The point marked with an open circle shows the maximum likelihood estimate (MLE), and the two dashed vertical lines show the estimated 95% confidence interval (smoothed estimate of log-likelihood no lower than 1.92 less than the MLE). loglik = log-likelihood.
Figure 6
Figure 6
Estimated annual declines in tuberculosis reactivation rates. Likelihood profiles (shown in a log scale as a difference with Δloglik = 0 representing the estimated 95% threshold) for reactivation rate in the four states: California (top left), Florida (top right), New York (bottom left), and Texas (bottom right). The point marked with an open circle shows the maximum likelihood estimate, and the two dashed vertical lines show the estimated 95% confidence interval. loglik = log-likelihood.

Comment in

References

    1. Centers for Disease Control and Prevention. Reported tuberculosis in the United States, 2015. Atlanta, GA: U.S. Department of Health and Human Services, CDC; 2016.
    1. Salinas JL, Mindra G, Haddad MB, Pratt R, Price SF, Langer AJ. Leveling of tuberculosis incidence - United States, 2013-2015. MMWR Morb Mortal Wkly Rep. 2016;65:273–278. - PubMed
    1. Pew Research Center. Statistical portrait of the foreign-born population in the United States. 2016 Apr 19; [accessed 2017 Aug 2]. Available from: http://www.pewhispanic.org/2016/04/19/statistical-portrait-of-the-foreig...
    1. Hill AN, Becerra J, Castro KG. Modelling tuberculosis trends in the USA. Epidemiol Infect. 2012;140:1862–1872. - PubMed
    1. Moonan PK, Ghosh S, Oeltmann JE, Kammerer JS, Cowan LS, Navin TR. Using genotyping and geospatial scanning to estimate recent Mycobaterium tuberculosis transmission, United States. Emerg Infect Dis. 2012;18:458–465. - PMC - PubMed

Publication types