. 2017 May 4;169(4):693-707.e14.
doi: 10.1016/j.cell.2017.04.013.

The Cohesin Release Factor WAPL Restricts Chromatin Loop Extension

Affiliations

The Cohesin Release Factor WAPL Restricts Chromatin Loop Extension

Judith H I Haarhuis et al. Cell. .

Abstract

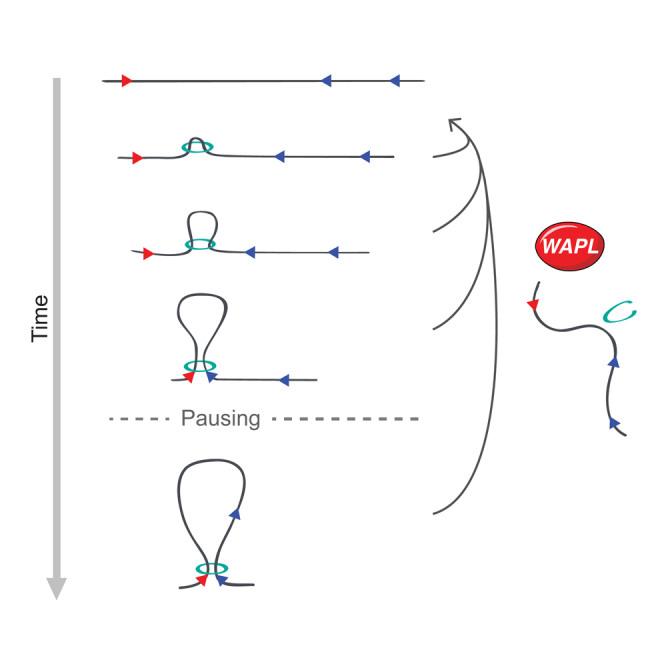
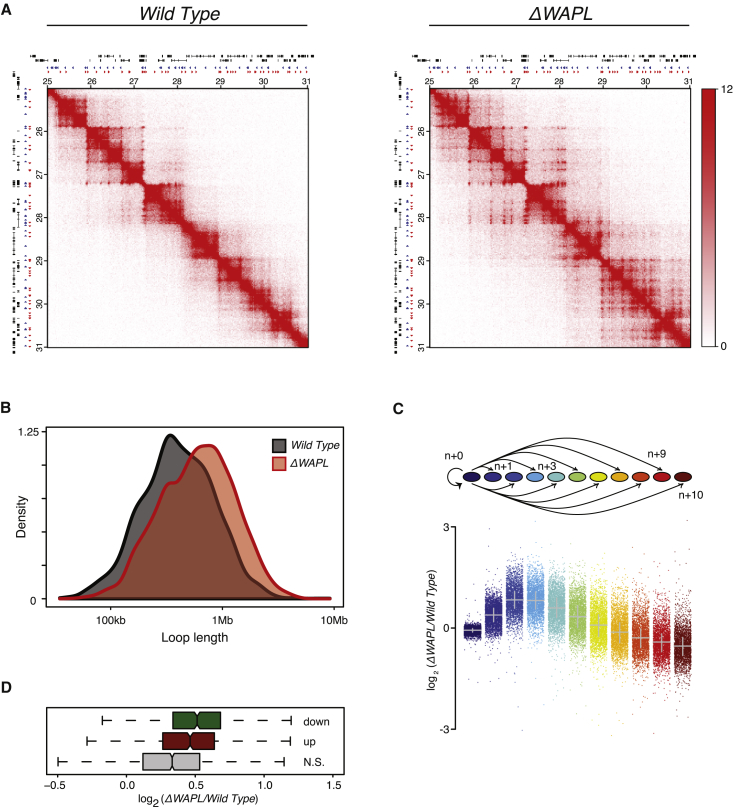
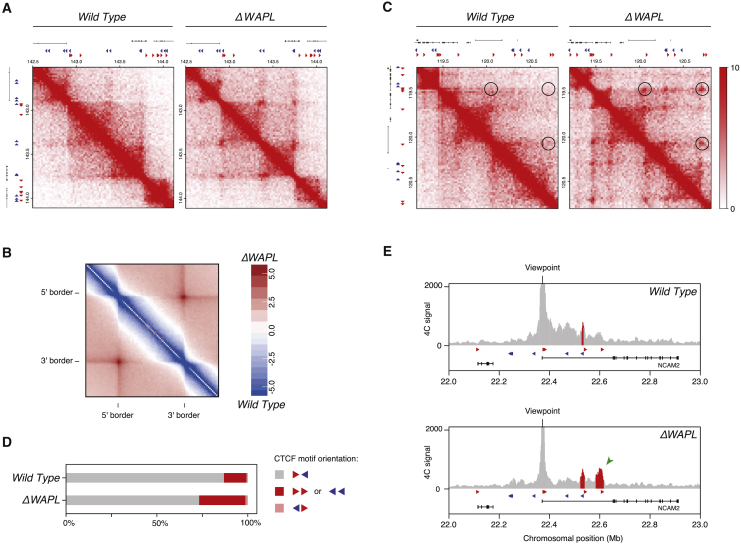
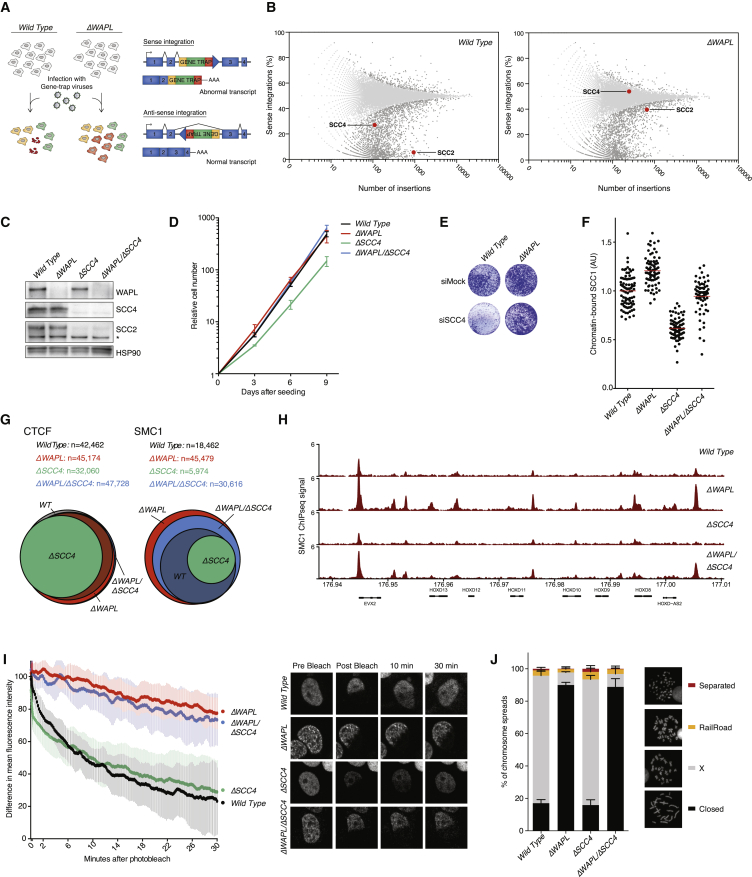
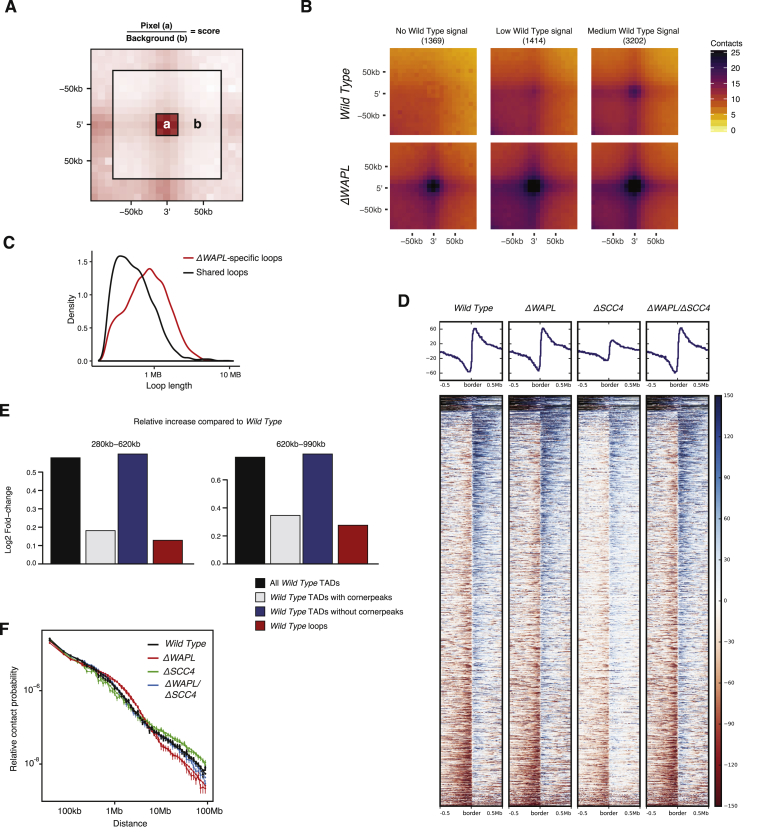
The spatial organization of chromosomes influences many nuclear processes including gene expression. The cohesin complex shapes the 3D genome by looping together CTCF sites along chromosomes. We show here that chromatin loop size can be increased and that the duration with which cohesin embraces DNA determines the degree to which loops are enlarged. Cohesin's DNA release factor WAPL restricts this loop extension and also prevents looping between incorrectly oriented CTCF sites. We reveal that the SCC2/SCC4 complex promotes the extension of chromatin loops and the formation of topologically associated domains (TADs). Our data support the model that cohesin structures chromosomes through the processive enlargement of loops and that TADs reflect polyclonal collections of loops in the making. Finally, we find that whereas cohesin promotes chromosomal looping, it rather limits nuclear compartmentalization. We conclude that the balanced activity of SCC2/SCC4 and WAPL enables cohesin to correctly structure chromosomes.

Keywords: CTCF; MAU2; NIPBL; SCC2; SCC4; TADs; WAPL; chromatin looping; cohesin; loop extrusion.


Figures

None
Graphical abstract
Figure 1
Figure 1
WAPL Restricts Chromatin Loop Extension (A) Hi-C contact matrices for a zoomed in region on chromosome 7. Contact matrices are normalized to 100 million contacts, shown resolution is 20 kb. Above and to the left of the contact matrices the union of CTCF sites identified in wild-type and ΔWAPL are shown. Red and blue triangles denote forward and reverse CTCF sites, respectively. (B) Density plot showing the length distribution of the loops called by HICCUPS (Rao et al., 2014) in wild-type and ΔWAPL cells. (C) Contact frequency analysis of a given TAD and its ten flanking TADs. The log2-ratio of the contact frequency between two TADs in ΔWAPL over wild-type is plotted. (D) Quantification of the difference in contact frequency of directly neighboring TADs (n+1) between wild-type and ΔWAPL. TADs are stratified into those that contain downregulated promoters or upregulated promoters, or TADs containing promoters that show no significant (N.S.) difference in expression. Wilcoxon rank-sum test shows a significant increase in contact frequency between TADs that contain an upregulated or downregulated promoter and TADs that do not contain a significantly affected promoter (p value upregulated genes = 8.40 × 10e−23, downregulated genes = 3.90 × 10e−44). See also Figures S1 and S2.
Figure 2
Figure 2
WAPL-Deficient Cells Accumulate Contacts at TAD Corners (A) Hi-C contact matrices for a zoomed in region on chromosome 2 similar to Figure 1A. Forward and reverse CTCF sites are depicted as red and blue triangles, respectively. (B) Aggregate TAD analysis (ATA) calculates the average Hi-C signal across a selected set of TADs. The differential ATA signal between ΔWAPL and wild-type is visualized for all TADs in the size range 500 kb–1 Mb. Blue indicates a higher signal in the wild-type, red indicates a higher signal in ΔWAPL cells. (C) Examples of illegally oriented chromosomal loops. Contact matrices similar to Figure 1A. Red and blue triangles denote forward and reverse CTCF sites, respectively. (D) Quantification of the unique orientation of CTCF sites that could be associated with Hi-C loops called by HICCUPs. (E) 4C-seq analysis for a CTCF site in the NCAM2 locus. Viewpoint is indicated above graph. Red bars highlight regions identified significantly above background (“peaks”). Peak calling was performed with peakC. Green arrowhead depicts a specific interaction in ΔWAPL cells. Red and blue triangles show forward and reverse CTCF sites. See also Figures S2 and S7.
Figure 3
Figure 3
WAPL Deficiency Compensates for Impaired SCC2/SCC4 Function (A) Schematic overview of the haploid genetic screening set-up as used in (B). (B) The ratio of sense and antisense orientation insertions (y axis) in individual genes in wild-type and ΔWAPL cells. SCC2 and SCC4 are highlighted in red. The total number of insertions in the respective gene is plotted on the x axis. (C) Western blot analyses of the indicated cell lines. (D) 3T3-like proliferation curves of the indicated cell lines. Line shows the average and SDs of three experiments. (E) Colony formation assays of wild-type and ΔWAPL cells on transfection with small interfering RNAs (siRNAs) targeting SCC4 or a control siRNA. (F) Quantitative immunofluorescence of chromatin-bound cohesin. Cells are pre-extracted to remove the unbound cohesin fraction. Intensity of remaining SCC1 is measured. Each dot depicts the signal per cell, red line indicates the mean and n is at least 75 cells per sample. (G) Venn diagram showing the overlap of CTCF and cohesin (SMC1) bound sites, assessed by chromatin immunoprecipitation (ChIP). (H) Examples of ChIP profiles as used in (G). (I) FRAP analysis of G1 cells expressing SCC1-GFP. Difference between non-bleached and bleached regions is plotted, including representative images of the FRAP movies (wild-type n = 7, ΔWAPL n = 6, ΔSCC4 n = 10, ΔWAPL/ΔSCC4 n = 6). The FRAP plots in Figure S1 include the same data for wild-type and ΔWAPL cells and Figure S5B shows the bleaching control. (J) Chromosome spreads of the indicated cell lines, including examples of each scoring category. Average of three experiments, n is at least 100 spreads, error bar depicts SD. See also Figures S1, S3, and S5.
Figure 4
Figure 4
The C Terminus of SCC2 Drives the Formation of Vermicelli Chromosomes (A) Immunofluorescence after pre-extraction of DNA-bound SCC1. The vermicelli phenotype is clearly visible in ΔWAPL cells. (B) Gene-trap insertion patterns in sense (red) or anti-sense (blue) orientation in wild-type and ΔWAPL cells. (C) Schematic depiction of SCC2-truncation mutants. “SCC2 inA” cells harbor a frameshift mutation due to the insertion of an A after 31 nucleotides. “SCC2 Δ2-10” cells lack exons 2–10. (D) Western blot depicting expression of the indicated proteins. The SCC2 blot was generated using a C-terminal antibody with actin as a loading control. CDK4 is the loading control for the SCC4 and WAPL blots. (E) Quantitative immunofluorescence of chromatin-bound cohesin. Performed as in Figure 3F. n is at least 50, and the red line indicates the mean. (F) Chromosome spreads of the indicated cell lines. Scoring was performed as in Figure 3J. Average of three experiments, n is at least 100 spreads, error bar depicts SD. (G) Immunofluorescence after pre-extraction of DNA-bound SCC1. The vermicelli phenotype is clearly visible in ΔWAPL/SCC2 Δ2-10 cells.
Figure 5
Figure 5
The SCC2/SCC4 Complex Promotes Loop Extension (A) Hi-C contact matrices for a zoomed in region on chromosome 5 similar to Figure 1A. Forward and reverse CTCF sites are depicted as red and blue triangles, respectively. (B) Top: schematic explaining the difference between primary and extended loops (see the STAR Methods for exact definition). Bottom: schematic explaining aggregate peak analysis (APA). (C) APA for primary and extended loops. (D) Heatmaps horizontally visualizing the Hi-C matrix along a zoomed in region on chromosome 1 for wild-type, ΔWAPL, ΔSCC4, and ΔWAPL/ΔSCC4 cells (left). The four panels on the right plot the Directionality Index (Dixon et al., 2012) for the same region. (E) Directionality Index (DI) is calculated for the 100 kb up- and downstream of all 5′ TAD borders identified in wild-type HAP1 cells. Average profiles of the aligned directionality indices are plotted for the four cell lines. (F) Differential profiles of the aligned directionality indices (ΔDI) are plotted as the wild-type signal subtracted from the three knockout cell lines. See also Figures S2 and S6.
Figure 6
Figure 6
Vermicelli Chromosomes Harbor Reduced Far-cis Contacts (A) Whole-chromosome contact matrices for chromosome 10. Matrices are normalized to 100 million contacts, resolution shown is 150 kb. (B) Relative contact probability plot shows the likelihood of a contact at increasing length scales. (C) Compartment scores (see the STAR Methods) show the segregation of chromosome 10 into A and B compartments. Regions that switch from A to B or from B to A are highlighted below the graph (see the STAR Methods for definition of switching regions). (D) Density plots showing length distribution of LADs. For more detailed information, see Figure S4A. (E) Quantification of LaminB1 DamID signal (as a proxy for association of DNA to the nuclear periphery) for regions that switch compartment and regions that do not switch compartment. See also Figures S4 and S6.
Figure 7
Figure 7
A Model Depicting the Role of WAPL in Chromosome Organization (A) WAPL restricts the extension of chromatin loops. We propose that CTCF sites are pausing sites for cohesin during the loop enlargement process. Cohesin complexes are depicted as green rings. Red and blue triangles denote forward and reverse CTCF sites, respectively. (B) Our data support the model that TADs in essence reflect populations of loops in the making between two given CTCF sites. WAPL through the constant disassembly of loops then allows TADs to be dynamic.
Figure S1
Figure S1
Characterization of ΔWAPL Cells, Related to Figures 1 and 3 (A) Genotype analysis of wild-type and ΔWAPL cells. (B) Western blot analysis of wild-type and ΔWAPL cells. WAPL siRNA-transfected cells are included as a control. (C) Immunofluorescence after pre-extraction of DNA-bound SCC1. (D) FRAP analysis of G1 cells expressing SCC1-GFP. Difference between non-bleached and bleached regions is plotted, including representative images of the FRAP movies (wild-type n = 7, ΔWAPL n = 6). The FRAP plots in Figure 3I include the same data and Figure S5B shows the bleaching control.
Figure S2
Figure S2
The ΔWAPL Phenotype Is Also Observed in the Biological Replicate, Related to Figures 1, 2, and 5 (A) Hi-C contact matrices for a zoomed in region on chromosome 7 for wild-type, ΔWAPL clone 1 and ΔWAPL clone 2. Contact matrices are normalized to 100 million contacts, shown resolution is 20kb. Above and to the left of the contact matrices the union of CTCF sites identified in wild-type and ΔWAPL are shown. Red en blue triangles denote forward and reverse CTCF sites, respectively. (B) Density plot showing the length distribution of the loops called by HICCUPS (Rao et al., 2014) in wild-type and ΔWAPL clone 1 and ΔWAPL clone 2. (C) The differential ATA signal between both biological replicates of ΔWAPL and wild-type is visualized for all TADs. Blue indicates a higher signal in the wild-type, red indicates a higher signal in ΔWAPL cells. (D) Quantification of the unique orientation of CTCF sites that could be associated with Hi-C loops called by HICCUPs. (E) APA for primary and extended loops. (F) Relative contact probability plot shows the likelihood of a contact at increasing length scales. Error bars depict the standard error of the mean.
Figure S3
Figure S3
Genomic Regions Unaffected in Gene Expression Also Display Increased Loop Length, Related to Figure 3 (A) Comparative heatmap of a genomic region that does not contain any differentially regulated genes. Bottom triangle is the wild-type Hi-C data, the top triangle is the ΔWAPL data. (B) Density plot of the loop length in genomic blocks (at least 4Mb) without differentially expressed genes. (C) ChIPseq heatmap of CTCF and SMC1 (cohesin) in WT, ΔWAPL, ΔSCC4 and ΔWAPL/ΔSCC4 for SMC1 binding sites in ΔWAPL cells. (D) Annotation of ChIP peaks of CTCF (top panel), all SMC1 peaks (middle panel) and non-CTCF SMC1 peaks (bottom panel).
Figure S4
Figure S4
WAPL Deletion Restricts Nuclear Compartmentalization, Related to Figure 6 (A) Chromosomal map of DamID of LaminB1 and compartment scores for the wild-type and ΔWAPL cells for chromosome 3. (B) Density plot showing the distribution of compartment scores for chromosome 3. (C) Idem, but for the LaminB1 DamID signal, the solid and dotted line denote different ΔWAPL clones. (D) The Hartigan’s dip statistic, measuring bimodality of the LaminB1 DamID signal, is shown for all chromosomes. Black squares show the wild-type scores, red triangles and dots show the scores for the ΔWAPL cells. denotes multiple hypothesis corrected p value < 0.01, ∗∗p < 0.001. (E) Expression comparison for all genes that switch from A to B compartment and vice versa in ΔWAPL cells. (F) Idem, but for genes that switch from iLAD to LAD (dark red) and from LAD to iLAD (light red) in ΔWAPL cells. (1) and (2) denote different ΔWAPL clones. (G) Cartoon depicting shifts to and from the nuclear lamina as scored in the expression comparison in (F). (H) Density plot showing length distribution of LADs in wild-type and two ΔWAPL clones.
Figure S5
Figure S5
Genotype Analyses, Related to Figure 3 (A) Genotype analysis of the indicated cell lines. (B) Bleaching control for FRAP analyses. To control for bleaching during acquisition, a neighboring cell with similar SCC1-GFP expression was monitored (wild-type n = 7, ΔWAPL n = 6, ΔSCC4 n = 10, ΔWAPL/ΔSCC4 n = 6). (C) Raw intensity measurements of cells used for FRAP in Figure 3I. Each dot depicts the average intensity of 5 measurements before bleaching and corrected for the background signal. Line indicates the mean and the error bars indicate standard deviations.
Figure S6
Figure S6
Extended Analysis of Hi-C Data, Related to Figures 5 and 6 (A) Loop-scores are computed by dividing the mean interaction score of the site (i.e., pixel) by the mean interaction score of the surrounding region. (B) ΔWAPL-specific loops are found by intersecting the ΔWAPL and wild-type loops. We determined the loop-scores of these sites in the wild-type data and stratified on relative enrichment of the pixel into three groups: no, weak and medium signal. (C) Length distribution of loops. Aspecific loops have a shorter mean length than ΔWAPL-specific loops. (D) Profile-plots and heatmaps of the DI-score alignment on wild-type TAD-borders, as depicted in Figure 5E. (E) TADs with cornerpeaks have a similar increase in signal to primary loops between wild-type and ΔWAPL. TADs without these cornerpeaks show a significant increase in signal at their peaks compared to primary loops of similar length (p = 5.5e-07). (F) Relative contact probability (RCP) plot of template replicates. Error bars depict the standard error of the mean.
Figure S7
Figure S7
Nested 4C PCR Strategy for the Addition of Illumina Indexes and Hi-C Statistics, Related to Figure 2 (A) We have developed a nested PCR strategy for the generation of 4C libraries. The first round of PCR is an inverse PCR to amplify the fragments (red) ligated to the viewpoint (blue). The forward primer contains a viewpoint-specific sequence (which is used after sequencing to identify the viewpoint) and the Illumina P5 adaptor sequence. The reverse primer contains a viewpoint-specific sequence and a partial Illumina P7 adaptor. In the second round of PCR, the forward primer from the first round is reused and a universal reverse primer is used containing an Illumina index sequence. After amplification and clean-up this library is ready for sequencing. (B) Statistics on the number of read pairs, valid read pairs and percentage cis pairs. See also Table S1.

Similar articles

Cited by

References

    1. Alipour E., Marko J.F. Self-organization of domain structures by DNA-loop-extruding enzymes. Nucleic Acids Res. 2012;40:11202–11212. - PMC - PubMed
    1. Anders S., Pyl P.T., Huber W. HTSeq--a Python framework to work with high-throughput sequencing data. Bioinformatics. 2015;31:166–169. - PMC - PubMed
    1. Beckouët F., Srinivasan M., Roig M.B., Chan K.L., Scheinost J.C., Batty P., Hu B., Petela N., Gligoris T., Smith A.C. Releasing activity disengages cohesin’s Smc3/Scc1 interface in a process blocked by acetylation. Mol. Cell. 2016;61:563–574. - PMC - PubMed
    1. Blackwood E.M., Kadonaga J.T. Going the distance: a current view of enhancer action. Science. 1998;281:60–63. - PubMed
    1. Blomen V.A., Májek P., Jae L.T., Bigenzahn J.W., Nieuwenhuis J., Staring J., Sacco R., van Diemen F.R., Olk N., Stukalov A. Gene essentiality and synthetic lethality in haploid human cells. Science. 2015;350:1092–1096. - PubMed