. 2017 May 4;169(4):750-765.e17.
doi: 10.1016/j.cell.2017.04.014.

Innate Immune Landscape in Early Lung Adenocarcinoma by Paired Single-Cell Analyses

Affiliations

Innate Immune Landscape in Early Lung Adenocarcinoma by Paired Single-Cell Analyses

Yonit Lavin et al. Cell. .

Abstract

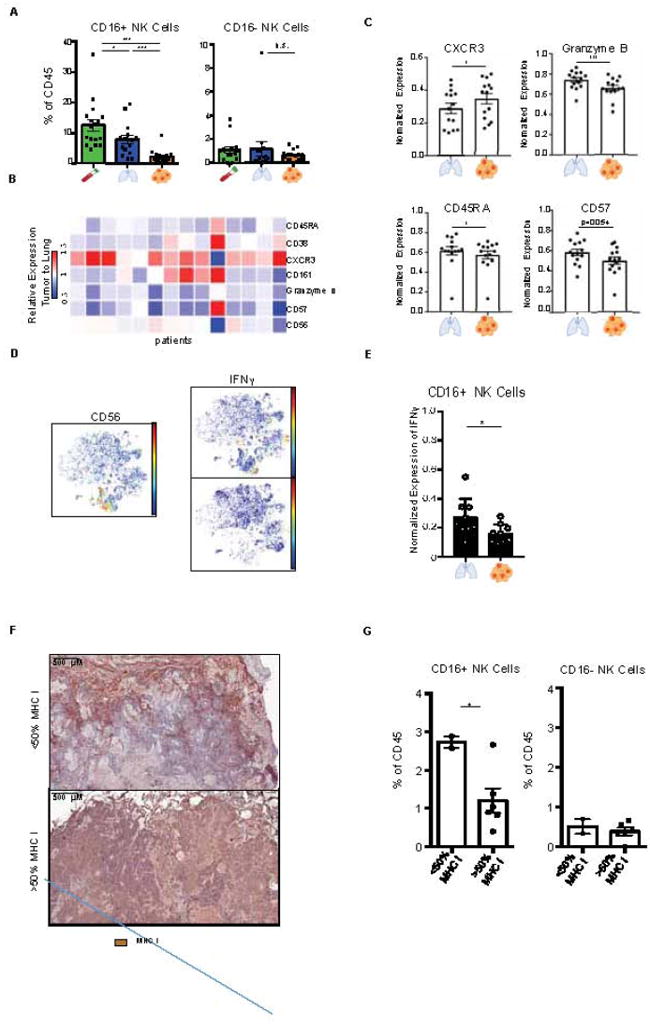
To guide the design of immunotherapy strategies for patients with early stage lung tumors, we developed a multiscale immune profiling strategy to map the immune landscape of early lung adenocarcinoma lesions to search for tumor-driven immune changes. Utilizing a barcoding method that allows a simultaneous single-cell analysis of the tumor, non-involved lung, and blood cells, we provide a detailed immune cell atlas of early lung tumors. We show that stage I lung adenocarcinoma lesions already harbor significantly altered T cell and NK cell compartments. Moreover, we identified changes in tumor-infiltrating myeloid cell (TIM) subsets that likely compromise anti-tumor T cell immunity. Paired single-cell analyses thus offer valuable knowledge of tumor-driven immune changes, providing a powerful tool for the rational design of immune therapies. VIDEO ABSTRACT.

Keywords: CD141+ DC; CD1c+ DC; NK Cell; T Cell; TIM; TLS; human non-small cell lung cancer (NSCLC); immune cell atlas; lung adenocarcinoma; tumor macrophage.


Figures

Figure 1
Figure 1. Robust immune response to early lung adenocarcinoma tumor lesions
(A) Schematic for defining the immune composition of lung tumors. Blood, non-involved lung (nLung), and tumor tissue were collected from patients undergoing surgical resection of primary tumors, processed, barcoded, pooled, and stained with antibodies conjugated to metal isotopes. Mass cytometry (CyTOF) single cell data was clustered using Phenograph to identify common populations across patients. (B) viSNE analysis of immune cells from tumor colored by relative expression of CyTOF markers, with populations indicated (top). (C, D) Frequency of immune lineages based on summation of Phenograph metaclusters (STAR methods; n=18). Composition of the CD45+ compartment showing average frequencies of major immune lineages for each tissue (C; n=18) across patients and bar plots showing frequencies for each patient (D; *p<0.05, **p<0.01, ***p<0.001 by paired t-test). Bar plots show mean ± SEM. (E, F) MICSSS for CD3, CD68, and CD20 of immune infiltrate (E) and a tertiary lymphoid structure (TLS; F) at the tumor invasive margin and non-involved lung from representative patients. See also Figure S1
Figure 2
Figure 2. Lymphoid function is dysregulated at the tumor site
(A) viSNE analysis of CD3+ immune cells colored and labeled by Phenograph metacluster (left) and tissue (right) for a representative patient. (B) Heatmap of Phenograph clusters of CD3+ cells. Rows represent clusters of single cells within individual patients grouped by metacluster across patients. (C) Bar plots of frequencies of metaclusters from (B) across tissue for 18 lung adenocarcinoma patients (*p<0.05, **p<0.01 and ***p<0.001 by paired t-test). (D) Normalized expression of PD-1, CTLA-4, and CD39 on tumor CD3+ cells shown by viSNE plot for a representative patient (left) and bar pots of normalized expression across patients for indicated metaclusters (n=18; right). (E) Heatmap showing relative normalized protein expression on tumor Tregs as ratio to nLung Tregs for 15 patients (left) and average expression of indicated markers across patients on tumor Tregs, PD-1+ CD4+ and CD8+ T cells (right). (F) MICSSS for CD8 and CD20 showing a TLS in tumor of a representative patient. (G) Clonality of T cell receptor (TCR) repertoire across tissues (n=16; left), and frequency of CD8+ PD-1+ T cells in tumor correlated to overall TCR clonality (Spearman’s rank-based correlation; right). Bar plots show mean ± SEM. See also Figure S2
Figure 3
Figure 3. Cytolytic NK Cells are excluded from tumor and produce less granzyme B and IFNγ
(A) Bar plots of frequencies of CD16+ and CD16- NK cell metaclusters across tissue for 17 lung adenocarcinoma patients (see Figure 4C). (B) Heatmap showing relative normalized protein expression on tumor NK cell as ratio to those from nLung for 14 patients (see STAR Methods). (C) Bar plots of normalized expression of indicated proteins on NK cells from nLung and tumor (n=14). (D) viSNE plots showing CD56 expression (left), and IFNγ expression in tumor and nLung upon stimulation in a representative patient. (E) Bar plot showing normalized IFNγ expression upon stimulation (n=9). (F) Immunohistochemical staining from representative patients depicting greater (>50%) or less than 50% (<50%) of tumor cells staining for MHC I in the tumor. (G) Bar plot stratifying the frequency of CD16+ NK cells and CD16- NK cells in patients by tumor cells staining for MHC I (n=8; *p<0.05, by unpaired t-test). Bar plots show mean ± SEM; *p<0.05, **p<0.01 and ***p<0.001 by paired t-test. See also Figure S3
Figure 4
Figure 4. Unbiased characterization of the mononuclear phagocyte compartment
(A) MARS-seq of 1473 cells pooled from tumor and nLung of a Stage IA adenocarcinoma patient. Cells were gated in silico and clustering on 770 mononuclear phagocytes is shown (see STAR methods). Columns represent single cells, with most variable genes from low (white) to high (purple). Normalized frequency of each cluster in tumor or nLung (top). Macrophages (MΦ), monocytes (Mono). (B) viSNE analysis of CD3- immune cells colored and labeled by Phenograph metaclusters (left) and tissue (right), for a representative patient. (C) Heatmap of Phenograph clusters of CD3- cells; rows represent clusters of single cells within individual patients grouped by metacluster across multiple patients. (D) Bar plots of metacluster frequencies from 18 lung adenocarcinoma patients across tissue (*p<0.05, **p<0.01 and ***p<0.001 by paired t-test). (E, F) Expression of corresponding transcript and protein by MARS-seq and CyTOF, respectively. Normalized transcript expression of MARS-seq clusters (left) and normalized protein expression of select Phenograph metaclusters in the tumor (right) for phenotypic markers (E; n=18), and cytokines (F; n=10) with corresponding viSNE plots. (G) Bar plot of normalized IL-8 expression by CD14+ monocytes across tissue (n=10; *p<0.05, **p<0.01 and ***p<0.001 by paired t-test). Bar plots show mean ± SEM. See also Figure S4
Figure 5
Figure 5. The TME contains macrophages with a distinct phenotype
(A) Bar plot of macrophage metacluster frequency from 18 lung adenocarcinoma patients across tissue (see Figure 4C). (B) Comparison of average transcript expression between macrophage clusters enriched in tumor (cluster 7) or lung (weighted average of clusters 5 and 6; Figure 4A), showing highly expressed transcripts, genes with FC > 2 colored red (left), bar plots of indicated transcript expression (right). (C) viSNE plots showing single-cell expression of CD68, CD163, PD-L1, and PPARγ across tissues in a representative patient. (D) Heatmap showing relative normalized protein expression of tumor macrophages as ratio to those from nLung for 16 patients (left) and average expression across patients of indicated markers on mononuclear phagocyte metaclusters in tumor (right). Bar plots of normalized expression of indicated proteins by macrophages in tumor and nLung (n =18) (E) Bar plot of normalized PD-L1 expression across metaclusters in tumor (n=18; top). MICSSS for CD3, CD68, and PD-L1 showing a macrophage-dense region at the tumor invasive margin (bottom). (F) IL-6 expression in nLung and tumor macrophages. viSNE plots showing IL-6 expression of a representative patient (top). Bar plot showing expression of IL-6 transcripts (left) and normalized protein expression across macrophages in nLung and tumor (right; n=10). Bar plots show mean ± SEM; *p<0.05, **p<0.01 and ***p<0.001 by paired t-test. Fold-change (FC). See also Figure S5
Figure 6
Figure 6. CD141+ DC are excluded from lung tumors and immune signature of lung adenocarcinoma tumors
(A, B) Comparison of the average transcript expression between DC clusters (Figure 4A, clusters 2 and 4), showing highly expressed transcripts in these clusters, genes with FC > 2 colored red (A), and bar plots showing expression of indicated transcripts (B). (C) Bar plots of DC metacluster frequencies across tissue (Figure 4C; n=18; *p<0.05, **p<0.01 and ***p<0.001 by paired t-test). (D) MICSSS for CD3 and DC-LAMP showing a TLS at the tumor margin in a representative patient. (E) MARS-seq transcript levels normalized across mononuclear phagocyte clusters (Figure 4A). (F) Heatmap showing the relative differences in metacluster frequency between tumor and nLung across 16 patients, grouped by stage. (G) Bar plots showing neutrophil metacluster frequency and secreted soluble TNFα (pg/ml) at thetumor, stratified by stage (*p<0.05 by unpaired t-test). Bar plots show mean ± SEM. See also Figure S6.

Comment in

Similar articles

Cited by

References

    1. Aberle DR, Adams AM, Berg CD, Black WC, Clapp JD, Fagerstrom RM, Gareen IF, Gatsonis C, Marcus PM, Sicks JD, et al. Reduced lung-cancer mortality with low-dose computed tomographic screening. N Engl J Med. 2011;365:395–409. - PMC - PubMed
    1. Amir E-A, Davis KL, Tadmor MD, Simonds EF, Levine JH, Bendall SC, Shenfeld DK, Krishnaswamy S, Nolan GP, Pe’er D. viSNE enables visualization of high dimensional single-cell data and reveals phenotypic heterogeneity of leukemia. Nat Biotechnol. 2013;31:545–552. - PMC - PubMed
    1. Besse B, Johnson M, Janne PA, Janne PA, Garassino MC, Eberhardt WE, Peters S, Toh CK, Kurata T, Li Z, et al. 16LBA Phase II, single-arm trial (BIRCH) of atezolizumab as first-line or subsequent therapy for locally advanced or metastatic PD-L1-selected non-small cell lung cancer (NSCLC) European Journal of Cancer. 2015;51
    1. Black WC, Keeler EB, Soneji SS. Cost-effectiveness of CT screening in the National Lung Screening Trial. N Engl J Med. 2015;372:388. - PubMed
    1. Blondel VD, Guillaume J-L, Lambiotte R, Lefebvre E. Fast unfolding of communities in large networks. Journal of statistical mechanics: theory and experiment. 2008;2008:P10008.