. 2017 Jun 27;8(26):42901-42916.
doi: 10.18632/oncotarget.17160.

Biglycan expression in the melanoma microenvironment promotes invasiveness via increased tissue stiffness inducing integrin-β1 expression

Affiliations

Biglycan expression in the melanoma microenvironment promotes invasiveness via increased tissue stiffness inducing integrin-β1 expression

Hana Andrlová et al. Oncotarget. .

Abstract

Novel targeted and immunotherapeutic approaches have revolutionized the treatment of metastatic melanoma. A better understanding of the melanoma-microenvironment, in particular the interaction of cells with extracellular matrix molecules, may help to further improve these new therapeutic strategies.We observed that the extracellular matrix molecule biglycan (Bgn) was expressed in certain human melanoma cells and primary fibroblasts when evaluated by microarray-based gene expression analysis. Bgn expression in the melanoma tissues correlated with low overall-survival and low progression-free-survival in patients. To understand the functional role of Bgn we used gene-targeted mice lacking functional Bgn. Here we observed that melanoma growth, metastasis-formation and tumor-related death were reduced in Bgn-/- mice compared to Bgn+/+ mice. In vitro invasion of melanoma cells into organotypic-matrices derived from Bgn-/- fibroblasts was reduced compared to melanoma invasion into Bgn-proficient matrices. Tissue stiffness as determined by atomic-force-microscopy was reduced in Bgn-/- matrices. Isolation of melanoma cells and fibroblasts from the stiffer Bgn+/+ matrices revealed an increase in integrin-β1 expression compared to the Bgn-/- fibroblast matrices. Overexpression of integrin-β1 in B16-melanoma cells abolished the survival benefit seen in Bgn-/- mice. Consistent with the studies performed in mice, the abundance of Bgn-expression in human melanoma samples positively correlated with the expression of integrin-β1, which is in agreement with results from the organotypic invasion-assay and the in vivo mouse studies.This study describes a novel role for Bgn-related tissue stiffness in the melanoma-microenvironment via regulation of integrin-β1 expression by melanoma cells in both mice and humans.

Keywords: biglycan; integrin-β1; melanoma; microenvironment; tissue stiffness.


Conflict of interest statement

CONFLICTS OF INTEREST

The authors have no conflicts of interest to disclose in relation to manuscript.

Figures

Figure 1
Figure 1. Bgn is highly expressed in melanoma cells and its expression in human melanoma tissue correlates with tumor invasiveness, overall survival and progression-free survival
(A) Expression of proteoglycans in fibroblast and melanoma cell lines. The heatmap shows the absolute log2 transformed expression of proteoglycans genes as defined in Naba et al. [48] for human dermal fibroblasts (HDF), Normal human keratinocytes (NHK) and 4 melanoma cells lines (detailed in the methods). The expression values have been derived from triplicates. Rows and columns have been hierarchically clustered by a complete linkage method according to their Euclidean distances. (B) Representative pictures of human healthy skin, Bgn positive tumor stroma or tumor cells in dermatotropic melanoma metastasis are shown. Immunohistochemical staining for Bgn (red staining, positive cells/areas are indicated by black arrows). (C) Quantitative comparison of Bgn staining in normal skin, melanoma primary tumors with good prognosis, melanoma primary tumors with unfavorable prognosis and melanoma lymph node metastases. Patients characteristics are given in Supplementary Table 1. (D) Overall survival of the two groups stratified according to Bgn expression levels in the melanoma cells. Characteristics of the patients reported in (D-G) are given in Supplementary Table 1. The Bgn level in the melanoma tissue was determined at initial diagnosis in patients with histology-proven malignant melanoma. OS was calculated from the time point of diagnosis until death or last hospital visit. (E) Progression free survival of the two groups stratified according to Bgn expression levels in melanoma cells. (F) Overall survival of the two groups stratified according to Bgn expression levels in tumor stroma. (G) Progression free survival of the two groups stratified according to Bgn expression levels in tumor stroma.
Figure 2
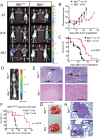
Figure 2. Bgn deficiency of tumor stroma inhibits metastasis formation in vivo
(A) Bgn+/+ and Bgn−/− mice were injected with 1×10⁴ B16 F10 luciferase transgenic cells intravenously. Distribution of tumor cells was followed by means of bioluminescence imaging on consecutive days. Representative images of tumor bearing mice taken over a period of 21 days. (B) The total photon flux over each mouse was quantified in photons/s/mouse as an indicator for the expansion of B16 cells (n=13 or n=8 as indicated). (C) Survival was monitored in the groups described under (A). Data are pooled from three independent experiments (n=17 mice/group, Bgn+/+ versus Bgn−/−: p<0.0001). (D) Bioluminescence imaging of Bgn+/+ or Bgn−/− mice that had received melanoma cells as described under (A). Representative images show BLI signal projection over the head of the mouse. (E) The brain of the mice described in (D) was isolated on after tumor cell injection and representative images are shown for both groups (H&E stain, black arrows: melanin). (F) Survival of Bgn+/+ and Bgn−/− mice injected intravenously with 2×10⁶ BRAFV600E melanoma (4434) cells (n=9 or n=10 mice/group, Bgn+/+ versus Bgn−/−: p=0.0019). (G) The lung was isolated from the groups described under (F) on after tumor cell injection and representative lungs with macroscopically visible metastases are shown for both groups (white arrows point to macroscopically visible metastases). (H) The lungs were isolated as described under (G) and representative sections of lungs are shown for both groups (H&E stain, black arrows point to melanoma metastases).
Figure 3
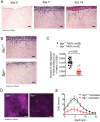
Figure 3. Invasion of melanoma cells is reduced in the absence of Bgn in fibroblasts
(A) Cells were seeded on the organotypic membranes at 10000 cells/membrane and allowed to adhere for three days. They were allowed to invade into the membranes and histological sections were made on consecutive days. (B) Representative images of histological slides of invasive cell migration in Bgn+/+ matrices (top) versus Bgn−/− matrices (bottom) on day 7 of invasion. (C) Quantification of migrated cells per optical field (OF) related to 10 000 cells seeded on the top of the matrix. For each sample, cells in three different optical fields were counted and the average was calculated (n=20/group, Bgn+/+ versus Bgn−/−: p<0.0001). (D) Maximum intensity projection of Second Harmonic Generation (SHG) signal derived from type I collagen in Bgn+/+ and Bgn−/− organotypic matrices at multiple time points. (E) z-stack quantification (0-15 μm) of SHG signal in organotypic Bgn+/+ and Bgn−/− matrices.
Figure 4
Figure 4. Tissue stiffness is reduced in the absence of Bgn in fibroblasts
(A) Contraction of collagen matrices containing Bgn+/+ or Bgn−/− MEFs as indicated for the respective groups. One representative collagen matrix per group is shown. (B) Measurement of the diameter of multiple collagen matrices containing Bgn+/+ or Bgn−/− MEFs on days 5 and 8 after start of contraction. Quantification was determined as the percentage of the initial membrane that contracted, where 0% was the size of a 35 mm Petri dish at the beginning of contraction on day 0. (C) Images of picrosirius red staining on sections of collagen matrices containing Bgn+/+ or Bgn−/− MEFs. Dense, rigid collagen bundles appear orange-red. (D) The scatter plot shows quantification of picrosirius red positive areas (in pixels), n ≥ 9 images quantified per condition, values represent mean ± SD. p<0.0001 for Bgn+/+ vs. Bgn−/− membranes. (E) Fibroblast derived matrices (FDMs) were fixed and fibronectin fibres stained. (F) Statistical analysis of fibronectin fibres orientation using the Mann-Whitney-Test (p<0.0001). Data from 16 samples out of 2 individual experiments were analysed. (G) Atomic force microscopy measurements of matrix stiffness of collagen matrices containing Bgn+/+ or Bgn−/− MEFs. The data were measured on numerous positions on three independent matrices on day 13 of contraction. The Young's moduli of the accepted curves are shown as scatter plots and notched boxplots for all measurements. A two-sample Kolmogorov-Smirnov test indicates a significant difference between the two distributions with a p-value < 0.0001.
Figure 5
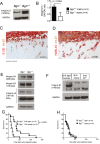
Figure 5. Stiffness mediated cell invasion is integrin-β1 dependent
(A) A representative western blot analysis for integrin-β1 in cells isolated from Bgn+/+ matrices vs. Bgn−/− matrices is shown. The cells had been allowed to invade the matrix for 7 days. Membranes were digested with collagenase 1, cells were isolated and western blot was performed. GAPDH was used as control. (B) The bar diagram shows the quantification of integrin-β1 in cells isolated from Bgn+/+ vs. Bgn−/− collagen matrices, normalized to GAPDH. Data are pooled from four independent experiments. p=0.004 for Bgn+/+ vs. Bgn−/− membranes. (C) Double immunohistochemistry staining for S100 and integrin-β1 of matrices containing melanoma cells is shown. (D) Double immunohistochemistry staining for HMB-45 and integrin-β1 of matrices containing melanoma cells is shown. (E) Western blot analysis of different integrins in cells isolated from Bgn+/+ vs. Bgn−/− collagen matrices. Representative results are shown. GAPDH was used as control. (F) Expression of integrin-β1 in B16 WT cells or cells containing the integrin-β1 overexpression vector as shown by western blot analysis. (G) Survival of Bgn−/− mice injected with either 1×10⁴ B16 integrin-β1 overexpressing cells or with 1×10⁴ B16 cells bearing the empty vector (n=14 or n=13 mice/group, integrin-β1 overexpressing cells versus cells bearing the empty vector: p=0.0002). (H) Survival of Bgn+/+ mice injected with 1×10⁴ B16 integrin-β1 overexpressing cells or with 1×10⁴ B16 cells bearing the empty vector (n=14 or n=13 mice/group, integrin-β1 overexpressing cells versus cells bearing the empty vector: not significant).
Figure 6
Figure 6. The levels of Bgn and integrin-β1 in melanoma tissue correlate
(A) Immunohistochemical staining of Bgn (left image) and integrin-β1 (right image) in a representative human melanoma sample with high Bgn and integrin-β1 expression levels (black arrows point to red staining of Bgn and integrin-β1). (B) Low staining intensity of integrin-β1 in a patient sample with low biglycan staining intensity (black arrows point to red staining of Bgn and integrin-β1). (C) Quantification of integrin-β1 in the primary tumors of patients stratified according to low/absent, intermediate and high Bgn expression. Patients characteristics are given in Supplementary Table 1.

References

    1. Bhowmick NA, Neilson EG, Moses HL. Stromal fibroblasts in cancer initiation and progression. Nature. 2004;432:332–37. - PMC - PubMed
    1. Paszek MJ, Zahir N, Johnson KR, Lakins JN, Rozenberg GI, Gefen A, Reinhart-King CA, Margulies SS, Dembo M, Boettiger D, Hammer DA, Weaver VM. Tensional homeostasis and the malignant phenotype. Cancer Cell. 2005;8:241–54. - PubMed
    1. Lo CM, Wang HB, Dembo M, Wang YL. Cell movement is guided by the rigidity of the substrate. Biophys J. 2000;79:144–52. - PMC - PubMed
    1. Egeblad M, Rasch MG, Weaver VM. Dynamic interplay between the collagen scaffold and tumor evolution. Curr Opin Cell Biol. 2010;22:697–706. - PMC - PubMed
    1. Levental KR, Yu H, Kass L, Lakins JN, Egeblad M, Erler JT, Fong SF, Csiszar K, Giaccia A, Weninger W, Yamauchi M, Gasser DL, Weaver VM. Matrix crosslinking forces tumor progression by enhancing integrin signaling. Cell. 2009;139:891–906. - PMC - PubMed

MeSH terms