. 2017 Jun 20;8(25):41211-41226.
doi: 10.18632/oncotarget.17162.

New tumor suppressor microRNAs target glypican-3 in human liver cancer

Affiliations

New tumor suppressor microRNAs target glypican-3 in human liver cancer

Flora Cartier et al. Oncotarget. .

Abstract

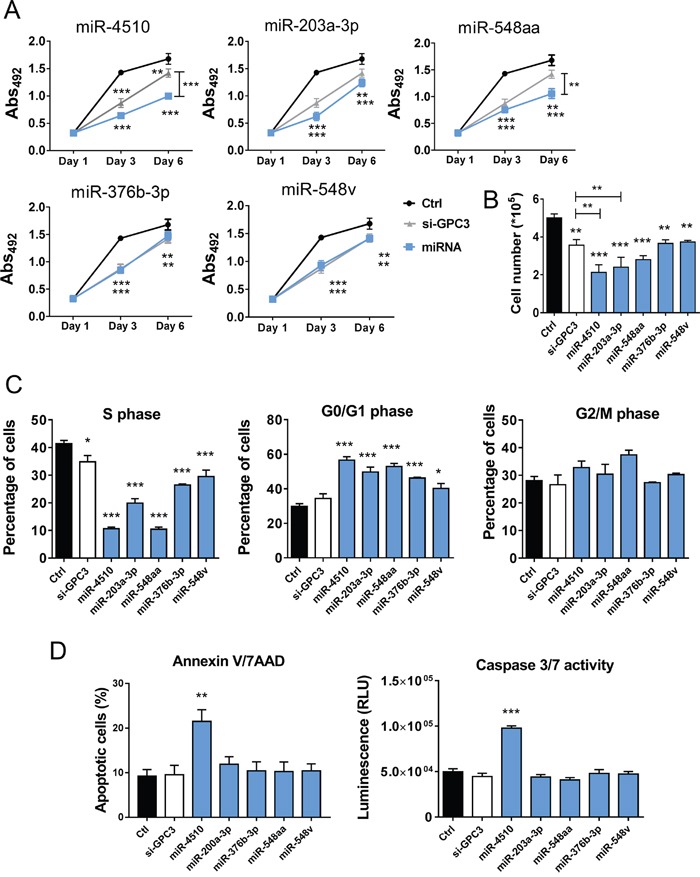
Glypican-3 (GPC3) is an oncogene, frequently upregulated in liver malignancies such as hepatocellular carcinoma (HCC) and hepatoblastoma and constitutes a potential molecular target for therapy in liver cancer. Using a functional screening system, we identified 10 new microRNAs controlling GPC3 expression in malignant liver cells, five of them e.g. miR-4510, miR-203a-3p, miR-548aa, miR-376b-3p and miR-548v reduce GPC3 expression. These 5 microRNAs were significantly downregulated in tumoral compared to non-tumoral liver and inhibited tumor cell proliferation. Interestingly, miR-4510 inversely correlated with GPC3 mRNA and protein in HCC samples. This microRNA also induced apoptosis of hepatoma cells and blocked tumor growth in vivo in the chick chorioallantoic membrane model. We further show that the tumor suppressive effect of miR-4510 is mediated through direct targeting of GPC3 mRNA and inactivation of Wnt/β-catenin transcriptional activity and signaling pathway. Moreover, miR-4510 up-regulated the expression of several tumor suppressor genes while reducing the expression of other pro-oncogenes. In summary, we uncovered several new microRNAs targeting the oncogenic functions of GPC3. We provided strong molecular, cellular and in vivo evidences for the tumor suppressive activities of miR-4510 bringing to the fore the potential value of this microRNA in HCC therapy.

Keywords: cancer; glypican-3; hepatocellular carcinoma; liver; microRNA.


Conflict of interest statement

CONFLICTS OF INTEREST

The authors disclose no potential conflicts of interest.

Figures

Figure 1
Figure 1. The DF-FunREG screening identifies fourteen potential GPC3-regulating miRNAs
Huh7 cells co-expressing the Tomato and GFP-5’+3’UTR-GPC3 transgenes were transfected by each miRNA mimic of a library comprising 1712 human miRNAs or by control RNA (Ctrl). MiRNAs decreasing the GFP/Tomato ratio compared to Ctrl were selected as candidates. (A) First step of DF-FunREG screening. The graph shows GFP/Tomato ratio fold change variations for the 1712 tested miRNAs. Dots represent means +/- standard deviation (SD) (n=3). (B-C) Second step of DF-FunREG screening. Fourteen miRNAs down-regulate the GFP/Tomato ratio fold change through GPC3 3’-UTR (B), 5’-UTR or both (C). Bars represent means + SD (n=3, ANOVA p<0.01). (D) The fourteen miRNAs retained following the DF-FunREG screening are shown with their names in the V17.0 and V21.0 versions of miRBase. In this Figure and the following, the ANOVA test was followed by a multiple comparison post-test (see Statistical analyses section for details), *: p < 0.05, **: p < 0.01, ***: p < 0.001.
Figure 2
Figure 2. Ten miRNAs regulate GPC3 expression
(A) The relative expression of total GPC3 protein was measured by western blot in Huh7 cells following transfection with small RNAs (left panel). The amount of GPC3 protein was normalized to the total amount of loaded proteins (see Materials and Methods section). Bars represent means + standard error of the mean (SEM) (n=5, ANOVA p<0.0001). The negative control is shown as a black bar. The si-GPC3 and previously reported GPC3-regulating miRNAs are shown as white bars and the fourteen retained miRNAs as blue bars. Representative western blots of 5 independent experiments are shown on the right panel. The top blots show results obtained with control RNAs (left) and ineffective miRNAs (right). The bottom blots show miRNAs inhibiting (left) or increasing (right) the amount of GPC3. Protein size is shown in brackets on the left of the blot. All cropped blots retained at least 6 bandwidths above and below the bands. SYPRO Ruby-labeled proteins cropped blots correspond to the middle part of the labeled membrane. (B) The relative expression of membrane-anchored GPC3 protein was measured by FACS in Huh7 cells transfected with the indicated small RNAs using the anti-human GPC3-Allophycocianin (APC) monoclonal antibody. Results are shown as Mean Fluorescence Intensity ratios. Bars represent means + SEM (n=4, ANOVA p<0.0001). See panel A for legend of colored bars. (C) The relative expression of GPC3 mRNA was measured by real-time quantitative RT-PCR in Huh7 cells following small RNA transfection. Bars represent means + SEM (n=3, ANOVA p<0.0001). See panel A for legend of colored bars. *: p < 0.05, **: p < 0.01, ***: p < 0.001.
Figure 3
Figure 3. Five GPC3-regulating miRNAs are downregulated in HCC
(A) The relative expression of miR-4510, miR-203a-3p, miR-548aa, miR-376b-3p and miR-548v was measured by real-time quantitative RT-PCR in 19 NTL and 98 HCC. Data are presented as box and whiskers with minimal and maximal values (two-tailed unpaired t test). (B) The relative expression of miR-4510, miR-203a-3p, miR-548aa, miR-376b-3p and miR-548v was measured by real-time quantitative RT-PCR in 19 pairs of HCC and adjacent NTL. Results are presented as HCC/NTL expression ratios. The median is shown as a full line and the reference ratio value “1” is shown as a dotted line. The statistical analyses were done with the two-tailed Wilcoxon matched-pairs signed ranked test. *: p < 0.05, **: p < 0.01, ***: p < 0.001.
Figure 4
Figure 4. MiR-4510, miR-203a-3p, miR-548aa, miR-376b-3p and miR-548v exert an antitumor effect on HCC cells
(A-D) Huh7 cells were transfected with miRNAs (A, blue lines + symbols; B-D, blue bars), si-GPC3 (A, grey lines + symbols; B-D, white bars) or controls (Ctrl RNA; A, black lines + symbols; B-D, black bars) and different cell-based assays were performed. (A) Cell growth was measured at the indicated time points using the Sulforhodamine B colorimetric assay (Abs 492). Results are presented as mean +/- SEM (n=5, ANOVA p<0.0001). (B-C) Three days after transfection, cell proliferation was determined by cell counting (B) and cell cycle was measured by APC/BrdU staining (percentages of cells in S, G0/G1 and G2/M phases, C). (D) In parallel, the percentage of apoptotic cells was determined by annexin/7-ADD staining (left panel) and caspase 3/7 activity was measured by a luminescent assay (right panel). (B-D) Bars represent means + SEM (n=3, ANOVA p<0.01). *: p < 0.05, **: p < 0.01, ***: p < 0.001.
Figure 5
Figure 5. Expression of miR-4510 in HCC and HBL and correlation with GPC3 mRNA expression
(A) Inverse correlation between GPC3 mRNA and miR-4510 expressions measured by real-time quantitative RT-PCR in 98 HCC. Spearman r correlation = -0.3243, ***p<0.001. (B) Inverse correlation between GPC3 protein level and miR-4510 expression measured in 16 HCC samples by immunoblotting and real-time quantitative RT-PCR, respectively. Spearman correlation, r = -0.5412, *p<0.05. (C) Relative expression of miR-4510 in HCC subgroups. Data are presented as box and whiskers plots with minimal and maximal values (ANOVA p<0.0001). Dunnett's multiple comparisons test. (D) Relative expression of miR-4510 in 24 pairs of HBL and adjacent normal liver samples. Results are presented as HBL/NTL expression ratios. The median is shown as a full line and the reference ratio value “1” is shown as a dotted line. Two-tailed Wilcoxon matched-pairs signed ranked test. **: p < 0.01, ***: p < 0.001.
Figure 6
Figure 6. MiR-4510 acts as a tumor suppressor in vitro
(A) Six days after transfection, the effect of miR-4510 and miR-34a-5p on the growth of Huh7, Hep3B and Huh6 cells was compared using the Sulforhodamine B colorimetric assay (Abs 492nm). Bars represent means + SEM (n=4, ANOVA p<0.01). (B) Three days after transfection, the effects of miR-4510 and miR-34a-5p on the apoptosis of Huh7, Hep3B and Huh6 cells were compared by annexin/7-ADD staining. Bars represent means + SEM (n=3, ANOVA p<0.05). (C) Huh7 cells were transduced with lentiviruses containing the GPC3 transgene lacking the 5’- and 3’UTR (pL-hGPC3) or an empty transgene (Empty). Three days later, cells were transfected with miR-4510 or Ctrl. Finally, cell number was measured by cell counting and the amount of GPC3 protein was assessed by western blotting three days later. Top panel: bars represent means + SEM (n=3, ANOVA p<0.0001). Bottom panel: one representative immunoblot of 3 independent experiments is shown. *: p < 0.05, **: p < 0.01, ***: p < 0.001.
Figure 7
Figure 7. miR-4510 directly binds GPC3 3’UTR and inhibits Wnt/β-catenin signaling pathway
(A) Schematic representation of miR-4510:GPC3 mRNA interactions predicted by RNAhybrid. Through its seed sequence, miR-4510 (green sequence) interacts with GPC3 3’-UTR (red sequence) at position 308-315. Blue arrows correspond to the 2 mutated nucleotides (r.311C>G and r.313C>G). (B) Huh7 cells expressing the GFP and wild type GPC3-3’UTR transgene (WT cells) or the mutated GPC3-3’UTR transgene (Mut cells) were transfected with miR-4510 or Ctrl. The Mean Fluorescence Intensity (MFI) ratio was measured in each cell population using the FunREG method. Bars represent means + SEM (n=3, ANOVA p<0.0001). (C) Effect of miR-4510 on Wnt/β-catenin pathway. The expression of β-catenin and GAPDH was assessed by Western blotting in Huh7 cells 72hr after transfection (left panel; one representative blot of 3 independent experiments is shown). Protein size is shown in brackets on the left of the blot. All cropped blots retained at least 6 bandwidths above and below the bands. SYPRO Ruby-labeled proteins cropped blots correspond to the middle part of the labeled membrane. The transcriptional activity of β-catenin was measured by TOPflash/FOPflash assay 72hr after transfection with siRNA targeting β-catenin as positive control or miR-4510 (right panel). Bars represent means + SEM (n=3, ANOVA p<0.0001). (D) miR-4510 induces the up- or down-regulation of Wnt/β-catenin pathway-associated genes mRNA. Data are presented as Log2 fold-change ratio between miR-4510- and Ctrl-transfected Huh7 cells. Bars represent means + or - SEM (n=2). **: p < 0.01, ***: p < 0.001.
Figure 8
Figure 8. MiR-4510 inhibits HCC tumor development in vivo
(A) Twenty-four hours after transfection with miR-4510 or Ctrl miRNA, Huh7 cells were collected and grafted on the chicken CAM. Tumor growth was monitored from day 1 to day 6. Tissue fixation was done at day 3 and day 6. (B) Photographs of tumors (top panels) and hematoxylin and eosin (H&E) staining (bottom panels) were performed 3 and 6 days after cells implantation. (C) Hematoxylin and eosin (H&E), Ki67 and cleaved Caspase-3-staining was performed on sections of tumors treated with miR-4510 or Ctrl. Magnification scale bars are as indicated on each microscopic image. (D) The number of CAMs with tumor presenting or not bleeding in Ctrl versus miR-4510 at Day 3 (left panel) and Day 6 (right panel) is shown as bars. Two-sided Fisher's exact test, *: p < 0.05, **: p < 0.01.

Similar articles

Cited by

References

    1. Llovet JM, Villanueva A, Lachenmayer A, Finn RS. Advances in targeted therapies for hepatocellular carcinoma in the genomic era. Nat Rev Clin Oncol. 2015;12:436. - PubMed
    1. von Schweinitz D. Hepatoblastoma: recent developments in research and treatment. Semin Pediatr Surg. 2012;21:21–30. - PubMed
    1. Grandhi MS, Kim AK, Ronnekleiv-Kelly SM, Kamel IR, Ghasebeh MA, Pawlik TM. Hepatocellular carcinoma: From diagnosis to treatment. Surg Oncol. 2016;25:74–85. - PubMed
    1. Zynger DL, Gupta A, Luan C, Chou PM, Yang GY, Yang XJ. Expression of glypican 3 in hepatoblastoma: an immunohistochemical study of 65 cases. Hum Pathol. 2008;39:224–230. - PubMed
    1. Capurro MI, Xiang YY, Lobe C, Filmus J. Glypican-3 promotes the growth of hepatocellular carcinoma by stimulating canonical Wnt signaling. Cancer Res. 2005;65:6245–6254. - PubMed

MeSH terms