Parameter identifiability analysis and visualization in large-scale kinetic models of biosystems
- PMID: 28476119
- PMCID: PMC5420165
- DOI: 10.1186/s12918-017-0428-y
Parameter identifiability analysis and visualization in large-scale kinetic models of biosystems
Abstract
Background: Kinetic models of biochemical systems usually consist of ordinary differential equations that have many unknown parameters. Some of these parameters are often practically unidentifiable, that is, their values cannot be uniquely determined from the available data. Possible causes are lack of influence on the measured outputs, interdependence among parameters, and poor data quality. Uncorrelated parameters can be seen as the key tuning knobs of a predictive model. Therefore, before attempting to perform parameter estimation (model calibration) it is important to characterize the subset(s) of identifiable parameters and their interplay. Once this is achieved, it is still necessary to perform parameter estimation, which poses additional challenges.
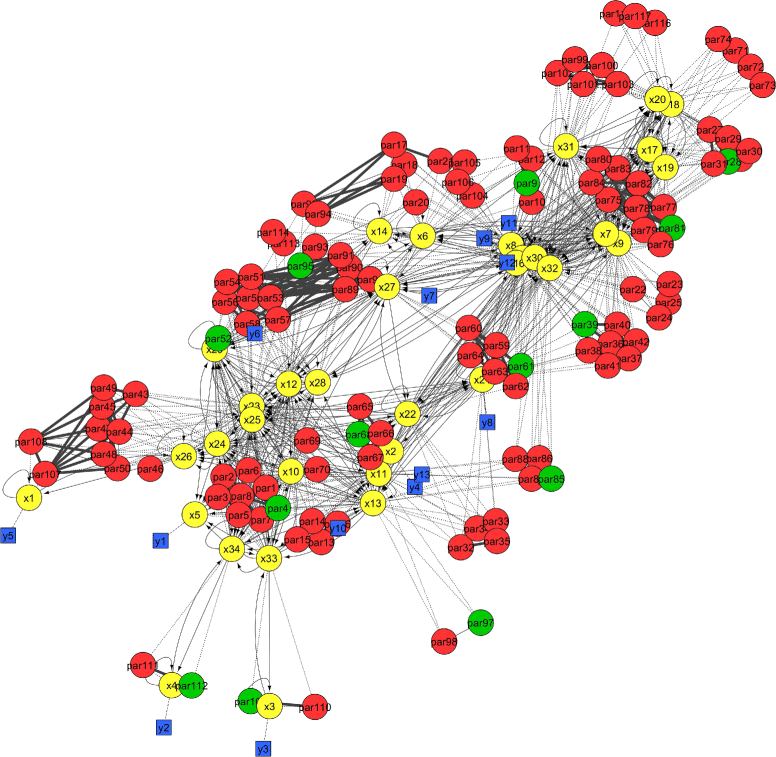
Methods: We present a methodology that (i) detects high-order relationships among parameters, and (ii) visualizes the results to facilitate further analysis. We use a collinearity index to quantify the correlation between parameters in a group in a computationally efficient way. Then we apply integer optimization to find the largest groups of uncorrelated parameters. We also use the collinearity index to identify small groups of highly correlated parameters. The results files can be visualized using Cytoscape, showing the identifiable and non-identifiable groups of parameters together with the model structure in the same graph.
Results: Our contributions alleviate the difficulties that appear at different stages of the identifiability analysis and parameter estimation process. We show how to combine global optimization and regularization techniques for calibrating medium and large scale biological models with moderate computation times. Then we evaluate the practical identifiability of the estimated parameters using the proposed methodology. The identifiability analysis techniques are implemented as a MATLAB toolbox called VisId, which is freely available as open source from GitHub ( https://github.com/gabora/visid ).
Conclusions: Our approach is geared towards scalability. It enables the practical identifiability analysis of dynamic models of large size, and accelerates their calibration. The visualization tool allows modellers to detect parts that are problematic and need refinement or reformulation, and provides experimentalists with information that can be helpful in the design of new experiments.
Keywords: Dynamic models; Global optimization; Identifiability; Overfitting; Parameter estimation; Regularization.
Figures


Similar articles
-
Structural Identifiability of Dynamic Systems Biology Models.PLoS Comput Biol. 2016 Oct 28;12(10):e1005153. doi: 10.1371/journal.pcbi.1005153. eCollection 2016 Oct. PLoS Comput Biol. 2016. PMID: 27792726 Free PMC article.
-
A simple method for identifying parameter correlations in partially observed linear dynamic models.BMC Syst Biol. 2015 Dec 14;9:92. doi: 10.1186/s12918-015-0234-3. BMC Syst Biol. 2015. PMID: 26666642 Free PMC article.
-
On the relationship between sloppiness and identifiability.Math Biosci. 2016 Dec;282:147-161. doi: 10.1016/j.mbs.2016.10.009. Epub 2016 Oct 24. Math Biosci. 2016. PMID: 27789352
-
Review: To be or not to be an identifiable model. Is this a relevant question in animal science modelling?Animal. 2018 Apr;12(4):701-712. doi: 10.1017/S1751731117002774. Epub 2017 Nov 3. Animal. 2018. PMID: 29096725 Review.
-
Analyzing and constraining signaling networks: parameter estimation for the user.Methods Mol Biol. 2012;880:23-39. doi: 10.1007/978-1-61779-833-7_2. Methods Mol Biol. 2012. PMID: 23361979 Review.
Cited by
-
Optimal enzyme utilization suggests that concentrations and thermodynamics determine binding mechanisms and enzyme saturations.Nat Commun. 2023 May 5;14(1):2618. doi: 10.1038/s41467-023-38159-4. Nat Commun. 2023. PMID: 37147292 Free PMC article.
-
Model reduction and analysis: A case study of a malaria control model.medRxiv [Preprint]. 2025 Aug 26:2025.08.21.25334195. doi: 10.1101/2025.08.21.25334195. medRxiv. 2025. PMID: 40909850 Free PMC article. Preprint.
-
Single-cell multi-omics and lineage tracing to dissect cell fate decision-making.Stem Cell Reports. 2023 Jan 10;18(1):13-25. doi: 10.1016/j.stemcr.2022.12.003. Stem Cell Reports. 2023. PMID: 36630900 Free PMC article. Review.
-
Parameter estimation and identifiability in a neural population model for electro-cortical activity.PLoS Comput Biol. 2019 May 30;15(5):e1006694. doi: 10.1371/journal.pcbi.1006694. eCollection 2019 May. PLoS Comput Biol. 2019. PMID: 31145724 Free PMC article.
-
Guidelines for mechanistic modeling and analysis in cardiovascular research.Am J Physiol Heart Circ Physiol. 2024 Aug 1;327(2):H473-H503. doi: 10.1152/ajpheart.00766.2023. Epub 2024 Jun 21. Am J Physiol Heart Circ Physiol. 2024. PMID: 38904851 Free PMC article. Review.
References
-
- Smallbone K, Mendes P. Large-scale metabolic models: From reconstruction to differential equations. Ind Biotechnol. 2013;9(4):179–84. doi: 10.1089/ind.2013.0003. - DOI
MeSH terms
Substances
LinkOut - more resources
Full Text Sources
Other Literature Sources

