

Review
doi: 10.1186/s13059-017-1215-1.
Multi-omics approaches to disease
Affiliations
- PMID: 28476144
- PMCID: PMC5418815
- DOI: 10.1186/s13059-017-1215-1
Item in Clipboard
Review
Multi-omics approaches to disease
Genome Biol.
.
Abstract
High-throughput technologies have revolutionized medical research. The advent of genotyping arrays enabled large-scale genome-wide association studies and methods for examining global transcript levels, which gave rise to the field of "integrative genetics". Other omics technologies, such as proteomics and metabolomics, are now often incorporated into the everyday methodology of biological researchers. In this review, we provide an overview of such omics technologies and focus on methods for their integration across multiple omics layers. As compared to studies of a single omics type, multi-omics offers the opportunity to understand the flow of information that underlies disease.
Figures

Multiple omics data types and approaches to disease research. Layers depict different types of omics data (Box 1). Omics data are collected on the entire pool of molecules, represented as circles. Except for the genome, all data layers reflect both genetic regulation and environment, which may affect each individual molecule to a different extent. The thin red arrows represent potential interactions or correlations detected between molecules in different layers—for example, the red transcript can be correlated to multiple proteins. Within layer interactions, although prevalent, are not depicted. Thicker arrows indicate different potential starting points or conceptual frameworks for consolidating multiple omics data to understand disease. The genome first approach implies that one starts from associated locus, while the phenotype first approach implies any other layer as the starting point. The environment first approach (not shown) examines environmental perturbations
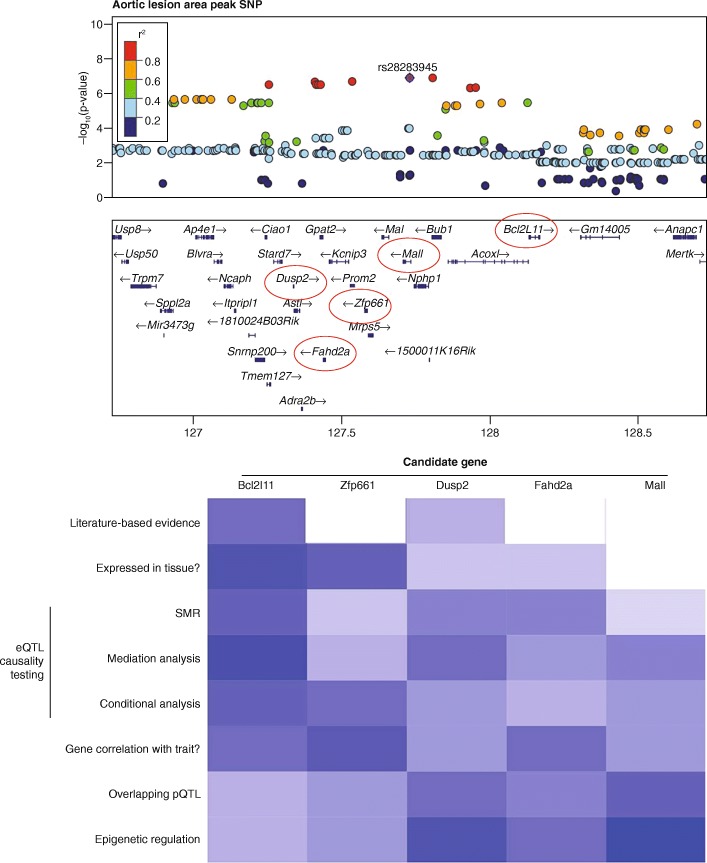
Usage of omics applications to prioritize GWAS variants. Locus zoom plot for a complex GWAS locus shows several candidate genes could be causal. Heatmap using various omics approaches for evidence supporting or refuting candidate causal genes. Beyond literature queries for candidates, various omics technologies and databases can be used to identify causal genes, including: searching for expression in relevant tissues [–175], summary data-based Mendelian randomization (SMR) [176], mediation analysis [177], conditional analysis [23], correlation analyses, searching for overlapping pQTLs [178, 179], and/or implementing epigenetic data to narrow candidates (discussed for FTO locus [16])

Genome first approach at FTO GWAS locus. Claussnitzer et al [16] combined genomics, epigenomics, transcriptomics, and phylogenetic analysis to identify the functional element, the causative SNP, and the downstream genes mediating the genetic effect at the FTO locus in obesity. Circles represent genes in the locus and yellow circles represent genes implicated by the respective omics data. a Genomics: the FTO locus, containing several genes (circles), harbors the most significant obesity-associated haplotype in humans. SNPs that are in linkage disequilibrium with the risk allele are color coded—blue represents the non-risk (normal) haplotype and red the risk haplotype. b Epigenomics: publically available epigenomic maps and functional assays were used to narrow down the original associated region to 10 kb containing an adipose-specific enhancer. Chromatin capturing (Hi-C) was used to identify genes interacting with this enhancer. c Transcriptomics: this technique was used to identify which of the candidate genes are differentially expressed between the risk and normal haplotypes, identifying IRX3 and IRX5 as the likely downstream targets. In addition, conservation analysis suggested that rs1421085 (SNP that disrupts an ARID5B binding motif) is the causative SNP at the FTO locus. CRISPR-Cas9 editing of rs1421085 from background (TT) to risk allele (CC) was sufficient to explain the observed differences in expression of IRX3 and IRX5. d Functional mechanism: correlation and enrichment analysis were then used to identify potentially altered pathways that were then confirmed by in vitro and in vivo studies

The flow of biologic information from liver DNA methylation to liver transcripts, proteins, metabolites, and clinical traits. A panel of 90 different inbred strains of mice were examined for DNA methylation levels in liver using bisulfite sequencing. CpGs with hypervariable methylation were then tested for association with clinical traits such as a obesity and diabetes, b liver metabolite levels, c liver protein levels, and d liver transcript levels. Each dot is a significant association at the corresponding Bonferroni thresholds across CpGs with the clinical traits and metabolite, protein, and transcript levels in liver. The genomic positions of hypervariable CpGs are plotted on the x-axis and the positions of genes encoding the proteins or transcripts are plotted on the y-axis. The positions of clinical traits and metabolites on the y-axis are arbitrary. The diagonal line of dots observed to be associated with methylation in the protein and transcript data represent local eQTL and pQTL. The vertical lines represent “hotspots” where many proteins or transcripts are associated with CpG methylation at a particular locus. Figure taken with permission from [180], Elsevier
References
-
- Gibson G. A primer of human genetics. 1. Sunderland (Massachusetts): Sinauer Associates, Inc.; 2015.
Publication types
MeSH terms
Grants and funding
LinkOut - more resources
Full Text Sources
Other Literature Sources
Medical
Research Materials
