. 2017 May 5;14(1):99.
doi: 10.1186/s12974-017-0871-0.

Microglia amplify inflammatory activation of astrocytes in manganese neurotoxicity

Affiliations

Microglia amplify inflammatory activation of astrocytes in manganese neurotoxicity

Kelly S Kirkley et al. J Neuroinflammation. .

Abstract

Background: As the primary immune response cell in the central nervous system, microglia constantly monitor the microenvironment and respond rapidly to stress, infection, and injury, making them important modulators of neuroinflammatory responses. In diseases such as Parkinson's disease, Alzheimer's disease, multiple sclerosis, and human immunodeficiency virus-induced dementia, activation of microglia precedes astrogliosis and overt neuronal loss. Although microgliosis is implicated in manganese (Mn) neurotoxicity, the role of microglia and glial crosstalk in Mn-induced neurodegeneration is poorly understood.

Methods: Experiments utilized immunopurified murine microglia and astrocytes using column-free magnetic separation. The effect of Mn on microglia was investigated using gene expression analysis, Mn uptake measurements, protein production, and changes in morphology. Additionally, gene expression analysis was used to determine the effect Mn-treated microglia had on inflammatory responses in Mn-exposed astrocytes.

Results: Immunofluorescence and flow cytometric analysis of immunopurified microglia and astrocytes indicated cultures were 97 and 90% pure, respectively. Mn treatment in microglia resulted in a dose-dependent increase in pro-inflammatory gene expression, transition to a mixed M1/M2 phenotype, and a de-ramified morphology. Conditioned media from Mn-exposed microglia (MCM) dramatically enhanced expression of mRNA for Tnf, Il-1β, Il-6, Ccl2, and Ccl5 in astrocytes, as did exposure to Mn in the presence of co-cultured microglia. MCM had increased levels of cytokines and chemokines including IL-6, TNF, CCL2, and CCL5. Pharmacological inhibition of NF-κB in microglia using Bay 11-7082 completely blocked microglial-induced astrocyte activation, whereas siRNA knockdown of Tnf in primary microglia only partially inhibited neuroinflammatory responses in astrocytes.

Conclusions: These results provide evidence that NF-κB signaling in microglia plays an essential role in inflammatory responses in Mn toxicity by regulating cytokines and chemokines that amplify the activation of astrocytes.

Keywords: Glial crosstalk; Manganism; NF-κB; Neuroinflammation; Tumor necrosis factor.


Figures

Fig. 1
Fig. 1
Column-free immunomagnetic separation generates highly pure cultures of microglia. Mixed glia (ac), microglial (df), and astrocyte (gi) cultures were assessed for total glia composition via immunofluorescence for GFAP-positive (red) and IBA-1-positive (green) cells or via flow cytometry for Cd11b and GLAST. Representative ×20 images of mixed glia (a), microglial (b), and astrocyte (c) cultures with a ×40 insert showing GFAP (red), IBA-1 (green), and DAPI (blue). Scale bars = 10 μm. Quantitative counts were determined for the number of glia present in mixed glia (b), microglia (e), and astrocyte (h) cultures both by positive immunoreactivity (colored) or by consistent morphology in the absence of positive staining (gray). Data are presented as mean percent of total cells per field ± SEM. Flow cytometry scatter plots showing the percentage of Cd11b- or GLAST-positive cells for mixed glia (c), microglia (f), or astrocyte (i) cultures
Fig. 2
Fig. 2
Manganese directly induces dose- and time-dependent expression of inflammatory genes in microglia. Purified primary microglia were treated with increasing doses of MnCl2 (0–100 μM) and over time (at 100 μM MnCl2) to determine dose-dependent (left panels) and time-dependent (right panels) effects of Mn on Nos2 (a), Tnf (b), Il-1β (c), Il-6 (d), and caspase 1 (e) expression. Data are presented as fold change in mRNA ± SEM (one-way ANOVA; asterisks indicate significance from control with *p < 0.05 and ***p < 0.001)
Fig. 3
Fig. 3
Manganese causes a mixed inflammatory phenotype in microglia. Microglial phenotype after 24-h treatment with 100 μM MnCl2 was assessed via qPCR measurement of M1 (ac, red) and M2 (df, blue) genes or by analyzing changes in morphology via immunofluorescence (gn). M1 genes analyzed included Cd86 (a), Cd32 (b), and Cd16 (c). M2 genes analyzed included Igf-1 (d), Bdnf (e), and Cd206 (f). Data are presented as the mean mRNA fold change ± SEM (Student’s t test; *p < 0.05, **p < 0.01, and ***p < 0.0001). Representative ×40 images used to assess morphology from control (g) and 100 μM MnCl2-treated (i) microglia with IBA-1 (green) and DAPI (blue). These images were converted to binary then skeletonized (hj) to assess changes in morphology including the number of end point voxels (k), average branch length (l), number of branches (m), and maximum branch length (n). Data is presented as indicated value ± SEM (Student’s t test; *p < 0.05 and ****p < 0.0001)
Fig. 4
Fig. 4
Microglia uptake 70% of Mn present in media. a Schematic diagram outlining the procedure for microglia-conditioned media (MCM) experiments. The amount of Mn remaining in MCM media was assessed via microglia cell uptake via cellular fura-2 manganese extraction assay (CFMEA) (b, c) or by measuring Mn levels in media (d). b Cell-free Mn-fura-2 saturation binding standard curve generated to calculate Mn uptake in microglia over a 24-h period. Data is represented as mean levels ± SD at %MAX (x-axis) and log10 scale of MnCl2 concentration (y-axis) with power curve (red line) used for %MAX less than 50% and logarithmic curve (blue line) used for %MAX greater than 50%. c The calculated amount of Mn uptake (y-axis) per MCM experiment measured via CFMEA in cultured microglia cells exposed to increasing doses of MnCl2 (0–100 μM; x-axis) over 24 h. Data is represented as mean Mn uptake per 2.5 × 105 cells ± SEM (one-way ANOVA; asterisk indicates significance from control; *p < 0.05). d The levels of Mn in MCM were measured via ICP-MS at time 0 and 24 h post treatment. Data are presented as the mean micromolar concentration of Mn ± SEM (one-way ANOVA; asterisks indicate significance from control; ****p < 0.0001). e Schematic diagraming procedure for microglia-astrocyte co-culture experiments
Fig. 5
Fig. 5
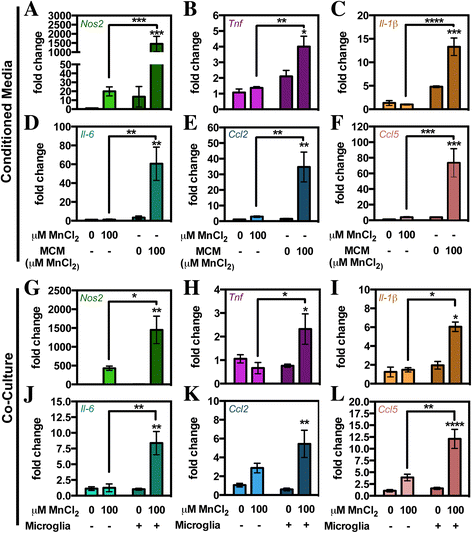
Presence of microglia or microglial-derived factors amplify Mn-dependent activation of astrocytes. Levels of inflammatory gene expression were determined by qPCR in astrocytes following direct treatment with 0 or 100 μM MnCl2 versus treatment with Mn from MCM (ac) or when co-cultured with microglia (df). a Upregulation of astrocyte inflammatory gene expression including Nos2 (a, d), Tnf (b, e), Il-1β (c, f), Il-6 (d, j), Ccl2 (e, k), and Ccl5 (f, l) required the presence of either microglia-derived factors (MCM) or the presence of microglia (co-culture) for significant induction. Data are presented as the mean mRNA fold change ± SEM (two-way ANOVA; asterisks above bars indicate significance from control within a group designated by different color shading; *p < 0.05, **p < 0.01, ***p < 0.001, and ****p < 0.0001)
Fig. 6
Fig. 6
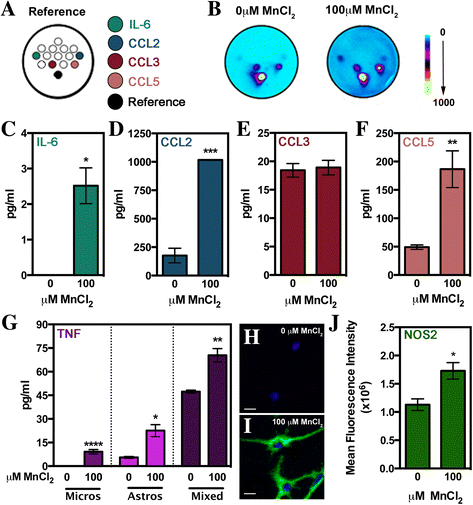
Mn-exposed microglia release a variety of proinflammatory mediators. Multi-plex or single-plex ELISA was utilized to assess the levels of cytokines/chemokines in sampled media from 0 or 100 μM MnCl2-treated microglia. a Representative image from the Quansys mouse 14-plex array indicating location of noted chemokines and cytokines. b Representative heat maps of Quansys multi-plex ELISA results of media from 0 or 100 μM MnCl2-treated microglia with dot locations correlating to a. Intensity is represented by no expression (blue) to increasing expression (yellow). Levels of IL-6 (c), CCL2 (d), CCL3 (e), CCL5 (f), and TNF (g) were calculated based on standard curves generated during experiments. Data is represented by mean concentration (pg/mL) ± SEM (Student’s t test; *p < 0.05, **p < 0.01, and ***p < 0.001). NOS2 levels (green) were assessed via immunofluorescence in 0 (h) or 100 μM (i) MnCl2-treated microglia and quantified by measuring the mean fluorescence intensity per cell (j). Data is represented by mean fluorescence per cell per field ± SEM (Student’s t test; *p < 0.05). Blue = DAPI; scale bar = 10 μm
Fig. 7
Fig. 7
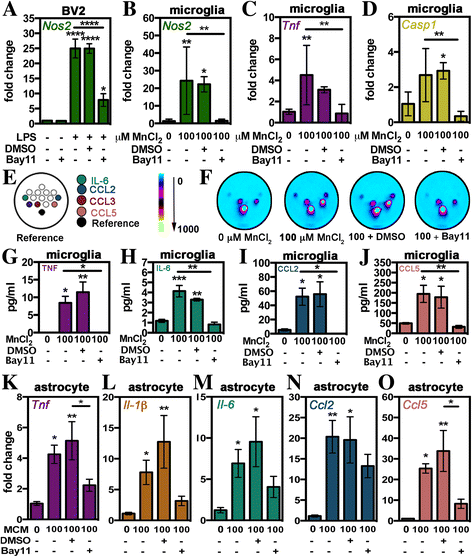
Glial crosstalk in Mn toxicity relies on NF-κB signaling in microglia. Prior to use in MCM experiments, microglia or BV2 microglia cells were pretreated with the NF-κB inhibitor Bay11 or DMSO. a Suppression of NF-κB-driven expression of Nos2 was assessed in BV2 microglial cells treated with lipopolysaccharide (1 μg/mL) for 24 h. Suppression of NF-κB-regulated inflammatory genes in microglia was measured via qPCR for Nos2 (b), Tnf (c), and caspase 1 (d). Representative image (e) from the Quansys mouse 14-plex array indicating location of noted chemokines and cytokines. (f) Representative heat maps of Quansys multi-plex ELISA results of media from 0 or 100 μM MnCl2-treated microglia in combination with DMSO or Bay11 with dot locations correlating to e. Intensity is represented by no expression (blue) to increasing expression (yellow). Levels of TNF (g), IL-6 (h), CCL2 (i), and CCL5 (j) were calculated based on standard curves generated during experiments. Levels of inflammatory gene expression in astrocytes treated with MCM versus MCM of microglia treated with DMSO or Bay11 were determined via qPCR for Tnf (K), Il-1β (l), Il-6 (m), Ccl2 (n), and Ccl5 (o). Expression data is represented by mRNA fold change ± SEM while ELISA data is represented by mean concentration (pg/mL) ± SEM (one-way ANOVA; asterisks above bars indicate significance from control; *p < 0.05, **p < 0.01, ***p < 0.001, ****p < 0.0001)
Fig. 8
Fig. 8
Release of TNF by Mn-activated microglia partly regulates inflammatory microglia-astrocyte crosstalk. Tnf knockdown in microglia was achieved through use of siRNA treatment 48 h prior to MCM experiments. a Successful knockdown of Tnf was assessed in BV2 microglial cells treated with lipopolysaccharide (1 μg/mL) for 24 h after 48 pretreatment with scrambled (Scr) siRNA or Tnf siRNA. b Knockdown of Tnf in primary microglia was assessed via qPCR. c TNF levels in MCM media prior to placement on astrocytes was assessed via single-plex TNF ELISA. d Representative image from the Quansys mouse 14-plex array indicating location of noted chemokines and cytokines. e Representative heat maps of Quansys multi-plex ELISA results of media from 0 or 100 μM MnCl2-treated microglia in combination with Scr siRNA or Tnf siRNA with dot locations correlating to d. Intensity is represented by no expression (blue) to increasing expression (yellow). Levels of inflammatory gene expression in astrocytes treated with MCM of microglia treated with Scr siRNA or Tnf siRNA were determined via qPCR for Tnf (i), Il-1β (j), Il-6 (k), Ccl2 (l), and Ccl5 (m). Expression data is represented by mRNA fold change ± SEM while ELISA data is represented as mean concentration (pg/mL) ± SEM (one-way ANOVA; asterisks above bars indicate significance from control; *p < 0.05, **p < 0.01, ***p < 0.001, and ****p < 0.0001)

References

    1. Guilarte TR. Manganese and Parkinson’s disease: a critical review and new findings. Environ Health Perspect. 2010;118:1071–80. doi: 10.1289/ehp.0901748. - DOI - PMC - PubMed
    1. Neal AP, Guilarte TR. Mechanisms of heavy metal neurotoxicity: lead and manganese. J Drug Metab Toxicol S. 2012;5:2.
    1. Huang C-C. Parkinsonism induced by chronic manganese intoxication—an experience in Taiwan. Chang Gung Med J. 2007;30:385–95. - PubMed
    1. Zhao F, Cai T, Liu M, Zheng G, Luo W, Chen J. Manganese induces dopaminergic neurodegeneration via microglial activation in a rat model of manganism. Toxicological Sciences. 2008;107:156–64. doi: 10.1093/toxsci/kfn213. - DOI - PubMed
    1. Verina T, Kiihl SF, Schneider JS, Guilarte TR. Manganese exposure induces microglia activation and dystrophy in the substantia nigra of non-human primates. NeuroToxicology. 2011;32:215–26. doi: 10.1016/j.neuro.2010.11.003. - DOI - PMC - PubMed

Publication types