. 2017 Oct;92(4):836-849.
doi: 10.1016/j.kint.2017.03.005. Epub 2017 May 3.

Podocytes regulate the glomerular basement membrane protein nephronectin by means of miR-378a-3p in glomerular diseases

Affiliations

Podocytes regulate the glomerular basement membrane protein nephronectin by means of miR-378a-3p in glomerular diseases

Janina Müller-Deile et al. Kidney Int. 2017 Oct.

Abstract

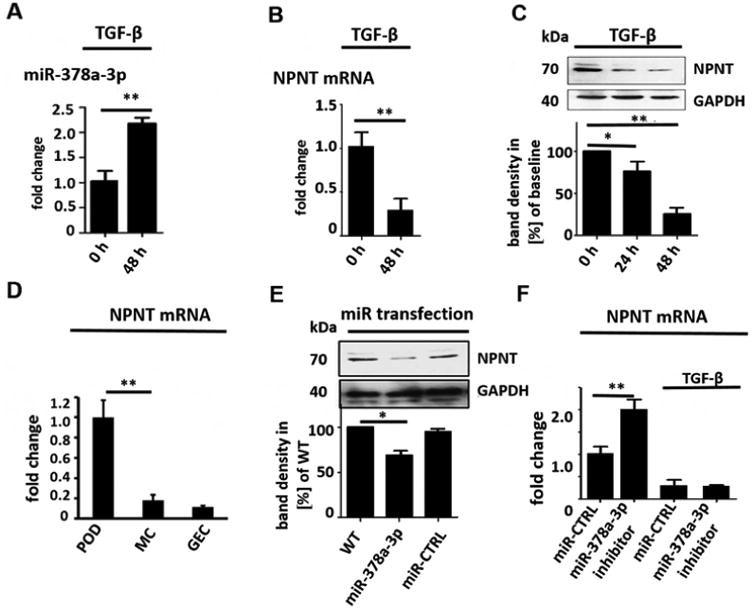
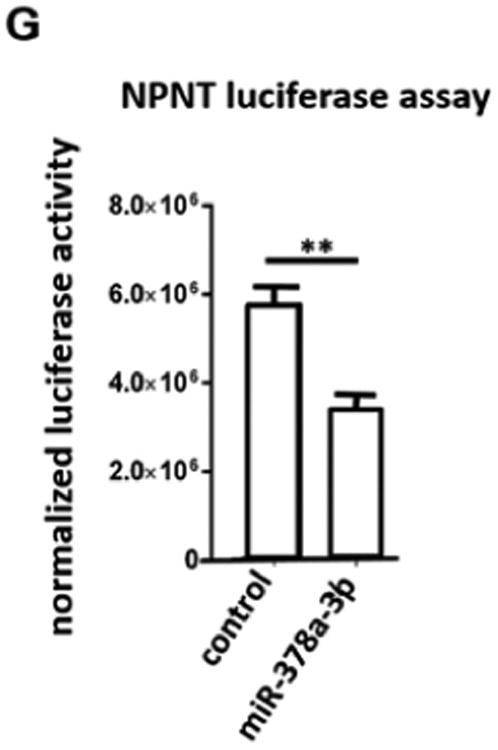
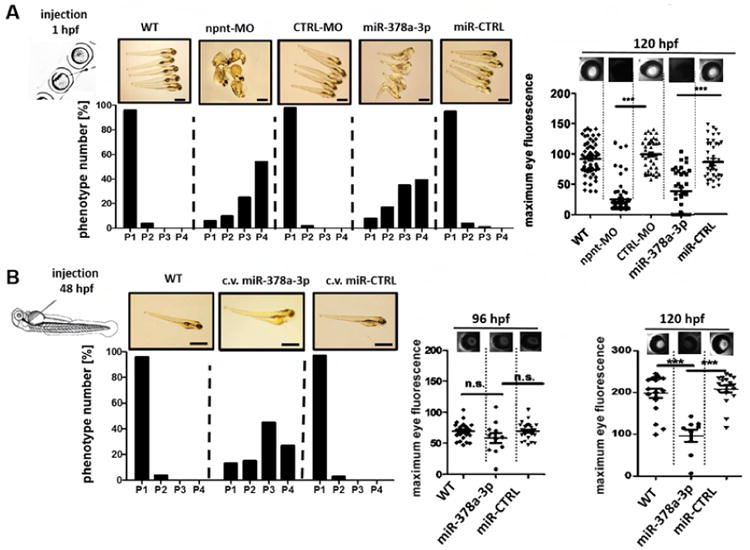
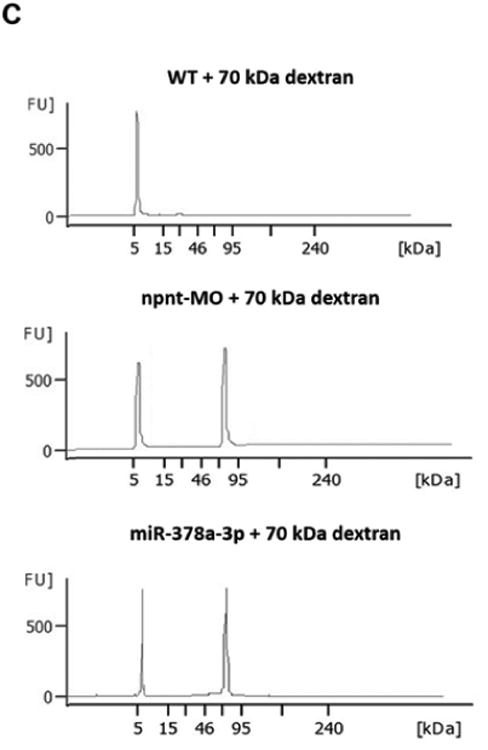
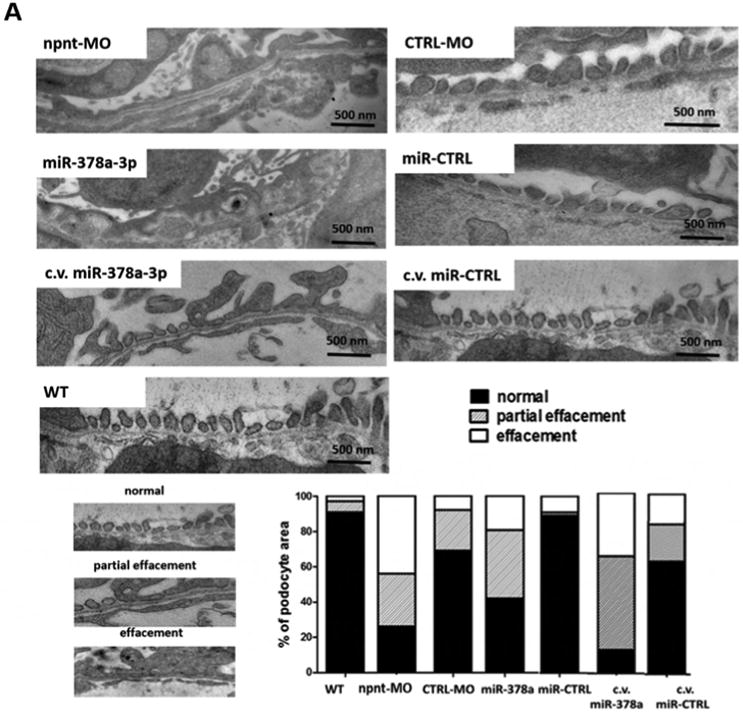
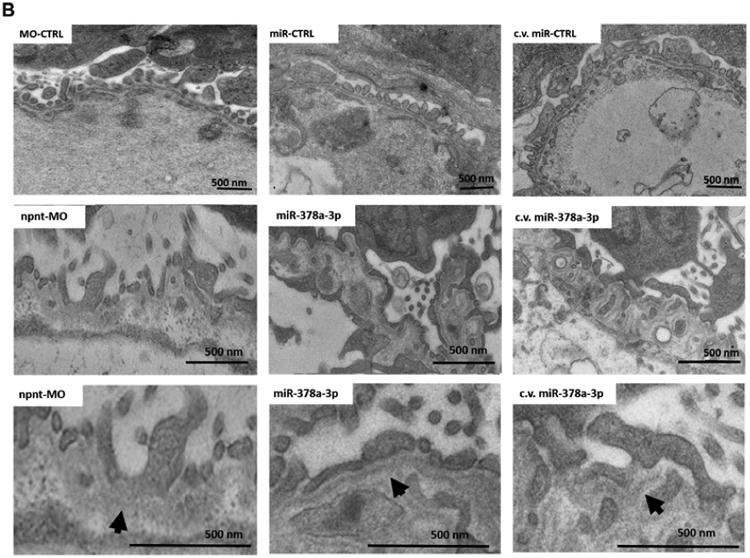
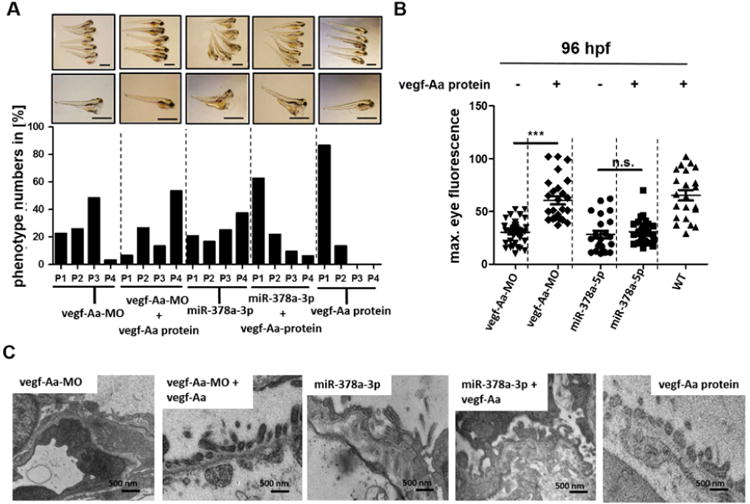
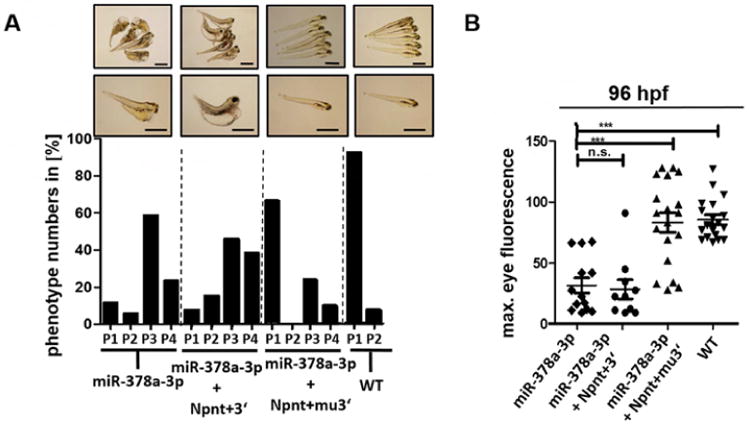
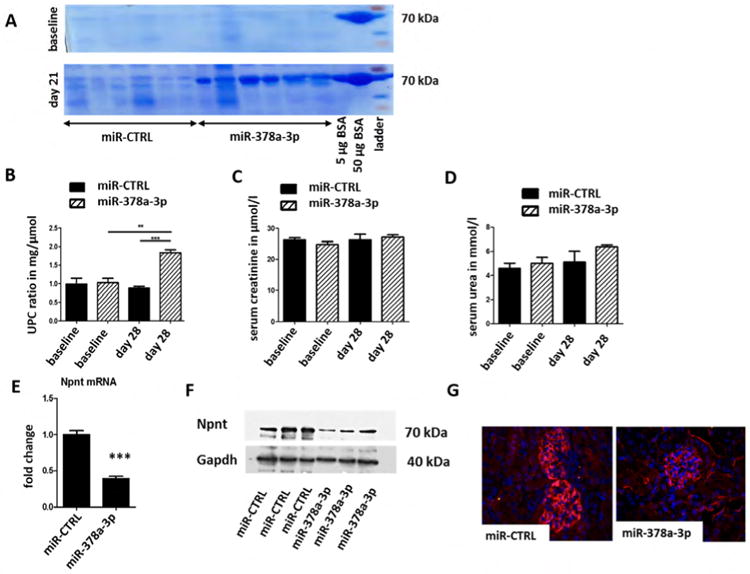
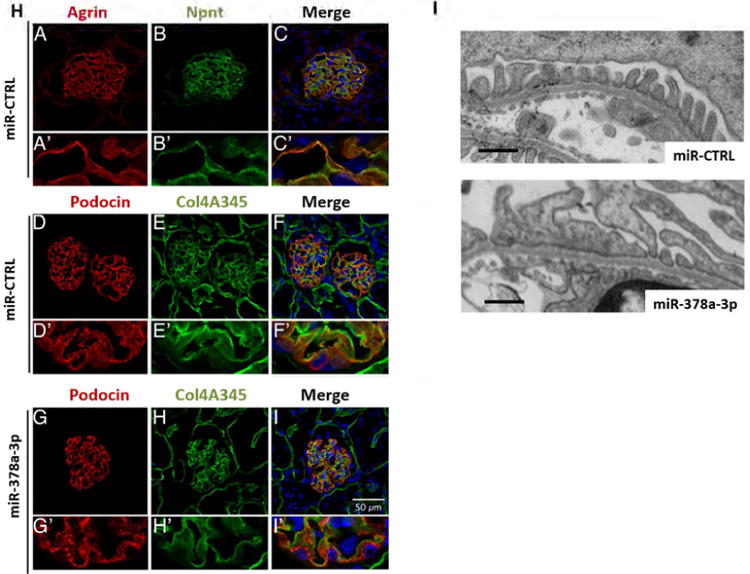
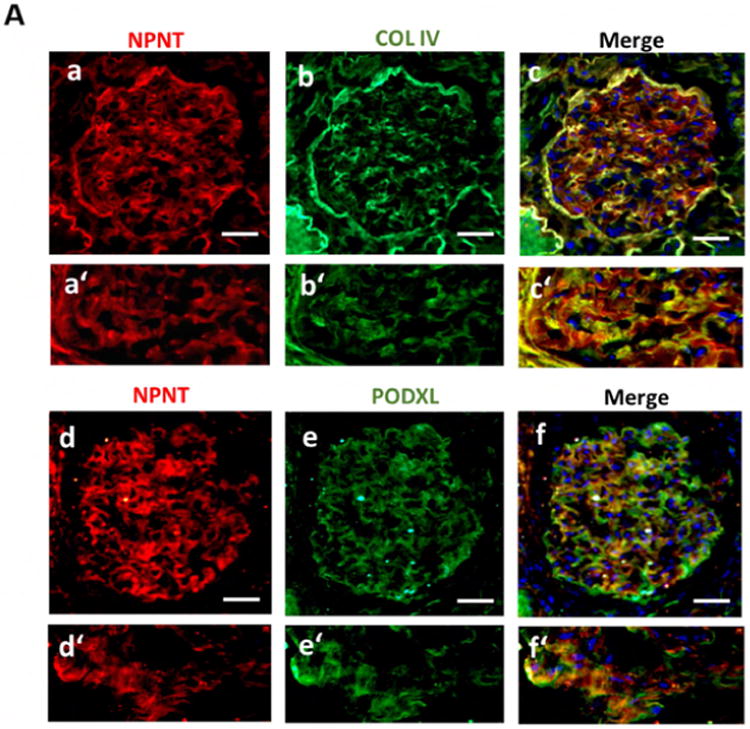
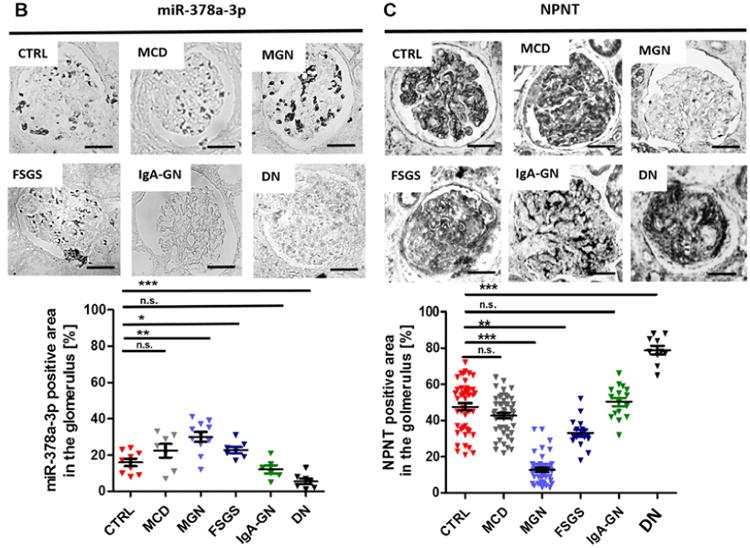
The pathophysiology of many proteinuric kidney diseases is poorly understood, and microRNAs (miRs) regulation of these diseases has been largely unexplored. Here, we tested whether miR-378a-3p is a novel regulator of glomerular diseases. MiR-378a-3p has two predicted targets relevant to glomerular function, the glomerular basement membrane matrix component, nephronectin (NPNT), and vascular endothelial growth factor VEGF-A. In zebrafish (Danio rerio), miR-378a-3p mimic injection or npnt knockdown by a morpholino oligomer caused an identical phenotype consisting of edema, proteinuria, podocyte effacement, and widening of the glomerular basement membrane in the lamina rara interna. Zebrafish vegf-A protein could not rescue this phenotype. However, mouse Npnt constructs containing a mutated 3'UTR region prevented the phenotype caused by miR-378a-3p mimic injection. Overexpression of miR-378a-3p in mice confirmed glomerular dysfunction in a mammalian model. Biopsies from patients with focal segmental glomerulosclerosis and membranous nephropathy had increased miR-378a-3p expression and reduced glomerular levels of NPNT. Thus, miR-378a-3p-mediated suppression of the glomerular matrix protein NPNT is a novel mechanism for proteinuria development in active glomerular diseases.

Keywords: glomerular basement membrane; membranous glomerulonephropathy; microRNA; nephronectin; podocytes.


Figures

Figure 1
Figure 1. MiR-378a-3p regulates NPNT expression in cultured human podocytes
(A) Real-time PCR reveals induction of miR-378a-3p expression in cultured human podocytes after TGF-β stimulation (5 ng/ml) at 48 h compared to baseline. ** p<0.01. (B) Real-time PCR reveals repression of NPNT mRNA in cultured human podocytes after TGF-β stimulation (5 ng/ml) at 48 h compared to baseline. (C) Western blot for NPNT in cultured human podocytes after TGF-β stimulation (5 ng/ml) compared to baseline for the time points indicated. Quantification of NPNT protein expression is given in the histogram. (D) Real-time PCR for relative NPNT mRNA expression in cultured human podocytes (POD), human mesangial cells (MC) and human glomerular endothelial cells (GEC). ** p<0.01. (E) Western blot for NPNT in cultured human podocytes at baseline and 72 h after a 4 h transfection with a miR-378a-3p mimic (5 nM) indicates complete suppression of NPNT protein compared to control after 72 h. Quantification of NPNT protein expression is given in the histogram. (F) Real-time PCR reveals upregulation of NPNT in cultured human podocytes after transfection with a miR-378a-3p inhibitor. Stimulation with TGF-β in the presence of a miR-378a-3p inhibitor decreased NPNT expression comparable to stimulation with TGF-β alone. ** p<0.01. (G) Luciferase reporter assay to validate miR-378a-3p binding to NPNT was performed in human embryonic kidney cells 293 (HEK cells). Cells were lysed 24 h after transfection and subsequently used for luciferase activity. Luciferase reads were normalized with beta-Gal values. ** p<0.01.
Figure 2
Figure 2. Npnt knockdown by morpholino or injection of miR-378a-3p in zebrafish larvae induces edema and proteinuria
(A). Quantification of edemous phenotype (left panel) and loss of circulating high molecular weight proteins by measuring max. eye fluorescence in the retinal vessel plexus of Tg(l-fabp:DBP:EGFP) zebrafish (right panels) at 120 hours post fertilization (hpf). Zebrafish were injected with a npnt specific morpholino (npnt-MO (100 μM)), a scrambled control morpholino (CTRL-MO (100 μM)), a miR-378a-3p mimic (25 μM) or a miR-CTRL (25 μM) at 1 hpf compared to uninjected wildtype animals (WT). Scale bar = 500 μm. (B). Quantification of edemous phenotype (left panel) and loss of circulating high molecular weight proteins by measuring max. eye fluorescence in the retinal vessel plexus of Tg(l-fabp:DBP:EGFP) zebrafish (right panels) at 96 hpf and 120 hours post fertilization (hpf). Zebrafish larvae were injected with a miR-378a-3p mimic (25 μM) or a miR-CTRL (25 μM) in the cardinal vein (c.v.) at 48 hpf compared to WT condition. The edemous phenotype of the larvae was categorized in 4 groups: P1 = no edema, P2 = mild edema, P3 = severe edema, P4 = very severe edema. Fluorescent images of the retinal vessel plexus of Tg(l-fabp:DBP:EGFP) zebrafish larvae at 96 hpf injected with morpholinos or miRNAs as indicated. Graph represents maximum fluorescence intensity detected in the fish eye. *** p<0.001, n.s. not significant. Scale bar = 500 μm. (C). Zebrafish water after injection of a red fluorescent 70 kDa dextran in npnt-MO (100 μM) or miR-378a-3p mimic (25 μM) treated zebrafish larvae was analysed by protein on chip electrophoresis. The first peaks represents 5 kDa marker peak, second peak represents detected 70 kD dextran. Each sample consisted of pooled medium from 10 fish kept in 200 μl embryo raising medium for 48 h.
Figure 3
Figure 3. Ultrastructural changes of the glomerulus after npnt knockdown by morpholino or miR-378a-3p in zebrafish larvae
Transmission electron microscopy pictures and quantification of podocyte effacement (A) and widening of the lamina rara interna of the GBM (B) in zebrafish larvae 120 hpf. Normal, partial and complete effacement of podocytes is compared between WT zebrafish and zebrafish that were injected with npnt-MO (100 μM), CTRL-MO (100 μM), miR-378a-3p mimic (25 μM) or miR-CTRL (25 μM) in one to four cell stage or in the cardinal vein of the zebrafish at 48 hpf (c.v. miR-378a-3p (25 μM), c.v. miR-CTRL (25 μM)). Podocyte layer was analysed over a length of 91 μm for WT, 98 μm for miR-378a-3p, 86 μm for miR-CTRL, 104 μm for npnt-MO, 80 μm for CTRL-MO, 78 μm for c.v. miR-378a-3p and 84 μm for c.v. miR-CTRL. Scale bar = 500 nm. C.v.: cardinal vein injection at 48 hpf; hpf: hours post fertilization. Bars indicate quantification of results.
Figure 4
Figure 4. Vegf-Aa does not rescue miR-378a-3p induced glomerular damage in zebrafish larvae
Zebrafish larvae were injected with vegf-Aa-MO (100 μM), miR-378a-3p mimic (25 μM) or co-injected with either vegf-Aa MO (150 μM) and vegf-Aa zebrafish protein (2.5 nl of 250 ng/ml solution) or miR-378a-3p mimic (25 μM) and a vegf-Aa zebrafish protein (2.5 nl of 250 ng/ml solution) at one to four cell stage. Scale bar = 500 μm. (A) The phenotype of the larvae was categorized into 4 groups: P1 = no edema, P2 = mild edema, P3 = severe edema, P4 = very severe edema depending on yolk sack. Scale bar = 500 μm. (B) Quantification of loss of circulating high molecular weight proteins by measuring max. eye fluorescence in the retinal vessel plexus of Tg(l-fabp:DBP:EGFP) zebrafish. Scatter plot graph presenting maximum fluorescence intensity of the fish eye was analysed with image J. (C) Transmission electron microscopy pictures of zebrafish at 120 hpf. Swelling of glomerular endothelium after vegf-Aa-MO injection and thickening of the GBM together with podocyte effacement after miR-378a-3p mimic and after miR-378a-3p mimic/ vegf-Aa protein co-injection is illustrated. Scale bar = 500 nm. *** p<0.001, n.s. not significant; hpf: hours post fertilisation.
Figure 5
Figure 5. Transspecies npnt rescue with different mice Npnt constructs after miR-378a-3p overexpression
(A) Phenotype development in zebrafish larvae at 120 hpf. Zebrafish were injected with a miR-378a-3p mimic (miR-378a-3p), miR-378a-3p mimic and cRNA of mouse Npnt+3′ construct (miR-378a-3p+ Npnt+3′) or miR-378a-3p mimic and cRNA of mouse Npnt+3′construct (miR-378a-3p + Npnt+mu3′). The phenotype of the larvae was categorized in 4 groups: P1 = no edema, P2 = mild edema, P3 = severe edema, P4 = very severe edema. Scale bar = 500 μm. (B) Loss of circulating high molecular weight proteins in zebrafish larvae at 120 hpf. Zebrafish were injected with a miR-378a-3p mimic (miR-378a-3p), miR-378a-3p mimic and cRNA of mouse Npnt+3′ construct (miR-378a-3p + Npnt+3′), or miR-378a-3p mimic and cRNA of mouse Npnt+mu3′construct (miR-378a-3p + Npnt+mu3′). Graph represents maximum fluorescence intensity detected in the fish eye. *** p<0.001, n.s. not significant.
Figure 6
Figure 6. MiR-378a-3p mimic injection leads to albuminuria, podocyte effacement and altered expression of podocin in mice
Mice were either injected with a miR-CTRL (0.2 mg/ mouse) or a miR-378a-3p mimic (0.2 mg/mouse) at day 0, 3, 7 and 14. n = 12. (A) Coomassie gel from urine samples of mice injected with either miR-CTRL or miR-378a-3p mimic at baseline and 28 days after the first injection. 5 μg and 50 μg BSA were also run on both gels. BSA: bovine serum albumin. UPC-ratio (B), serum creatinine (C) and serum urea (D) of miR-CTRL and miR-378a-3p mimic injected mice at baseline and 28 days after the first injection. ** p< 0.01, *** p< 0.001. Measurements were performed with OLYMPUS. Differences in serum creatinine and serum urea were not significant. (E) Real-time PCR for Npnt mRNA expression in whole kidney sections of mice injected with either miR-CTRL or miR-378a-3p mimic at baseline and 28 days after the first injection. (F) Western blot of whole kidney sections of mice injected with either miR-CTRL or miR-378a-3pmimic at baseline and 28 days after the first injection. Western blot bands were normalised to Gapdh. (G) Immunofluorescent staining for Npnt (red) and DAPI nuclear staining (blue) on paraffin sections of glomeruli from miR-CTRL (0.2 mg/ mouse) and miR-378a-3p mimic (0.2 mg/ mouse) injected mice. (H) Immunofluorescent staining for agrin (red, A, A′) and Npnt (green, B, B′) on cryo sections of glomeruli from miR-CTRL injected mice. The merged picture (C, C′) shows a partial overlap of agrin and Npnt in the GBM in orange. Immunofluorescence staining for podocin (red D, D′, G, G′) and collagen 4A345 (green E, E′, H, H′) on cryo sections of glomeruli from mice injected with miR-CTRL (0.2 mg/ mouse, D-F) or miR-378a-3p mimic (0.2 mg/ mouse G-I). F, F′, I and I′ show the merged pictures. Podocin staining shows a speckled pattern in miR-378a-3p mimic injected mice. Scale bar = 50 μm. (I) Transmission electron microscopy pictures of glomeruli from mice injected with miR-CTRL (0.2 mg/ mouse) or miR-378a-3p mimic (0.2 mg/ mouse) at day 0, 3, 7 and 14. MiR-378a-3p injected mice develop podocyte effacement. Scale bar = 500 nm.
Figure 7
Figure 7. Expression of miR-378a-3p and NPNT in glomerular diseases
(A) Immunofluorescence double staining for NPNT (red; a, a′) and collagen IV (green; b, b′) as well as NPNT (red; d, d′) and podocalyxin (PODXL, green; e, e′) on human nephrectomy. Overlaps of both staining are shown in the merged pictures in yellow (c, c′, f, f′); scale bar = 50 μm. In situ hybridization for miR-378a-3p (B) and immunohistochemistry staining for NPNT (C) on kidney biopsies from patients with different glomerular diseases. The lower panels depict quantification of miR-378a-3p and NPNT-positive area. Each triangle represents analysis of one glomerulus. * p< 0.05, ** p<0.01, *** p<0.001, n.s. not significant. Scale bar = 50 μm.

Comment in

Similar articles

Cited by

References

    1. Bushati N, Cohen SM. MicroRNA functions. Annu Rev Cell Dev Biol. 2007;23:175–205. doi: 10.1146/annurev.cellbio.23.090506.123406. - DOI - PubMed
    1. He L, Hannon GJ. MicroRNAs: Small RNAs with a big role in gene regulation. Nat Rev Genet. 2004;5(7):522–531. doi: 10.1038/nrg1379. - DOI - PubMed
    1. Denli AM, Tops BB, Plasterk RH, et al. Processing of primary microRNAs by the microprocessor complex. Nature. 2004;432(7014):231–235. doi: 10.1038/nature03049. - DOI - PubMed
    1. Sun Y, Koo S, White N, et al. Development of a micro-array to detect human and mouse microRNAs and characterization of expression in human organs. Nucleic Acids Res. 2004;32(22):e188. doi: 10.1093/nar/gnh186. - DOI - PMC - PubMed
    1. Wu J, Zheng C, Fan Y, et al. Downregulation of MicroRNA-30 facilitates podocyte injury and is prevented by glucocorticoids. J Am Soc Nephrol. 2013;25(1):92–104. doi: 10.1681/ASN.2012111101. - DOI - PMC - PubMed

MeSH terms

LinkOut - more resources