. 2017 Jul;206(3):1581-1600.
doi: 10.1534/genetics.116.199141. Epub 2017 May 5.

Mathematical Constraints on FST: Biallelic Markers in Arbitrarily Many Populations

Affiliations

Mathematical Constraints on FST: Biallelic Markers in Arbitrarily Many Populations

Nicolas Alcala et al. Genetics. 2017 Jul.

Abstract

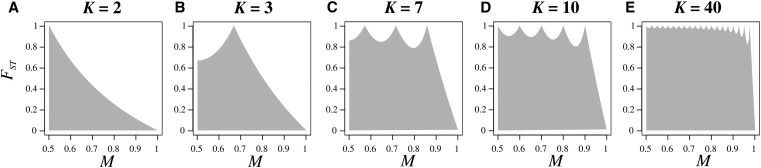
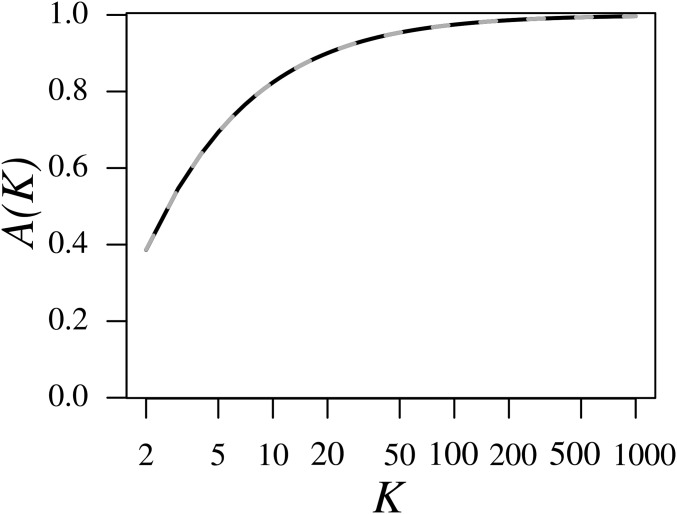
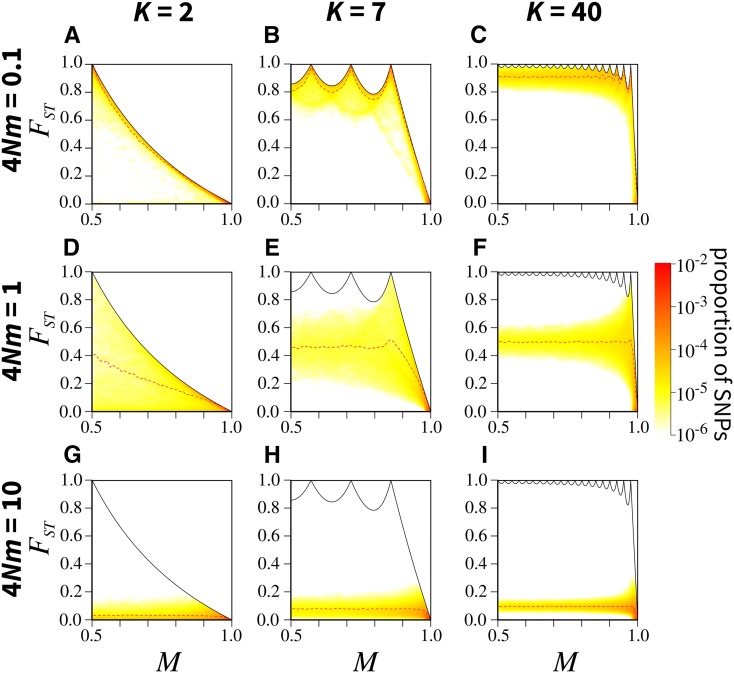
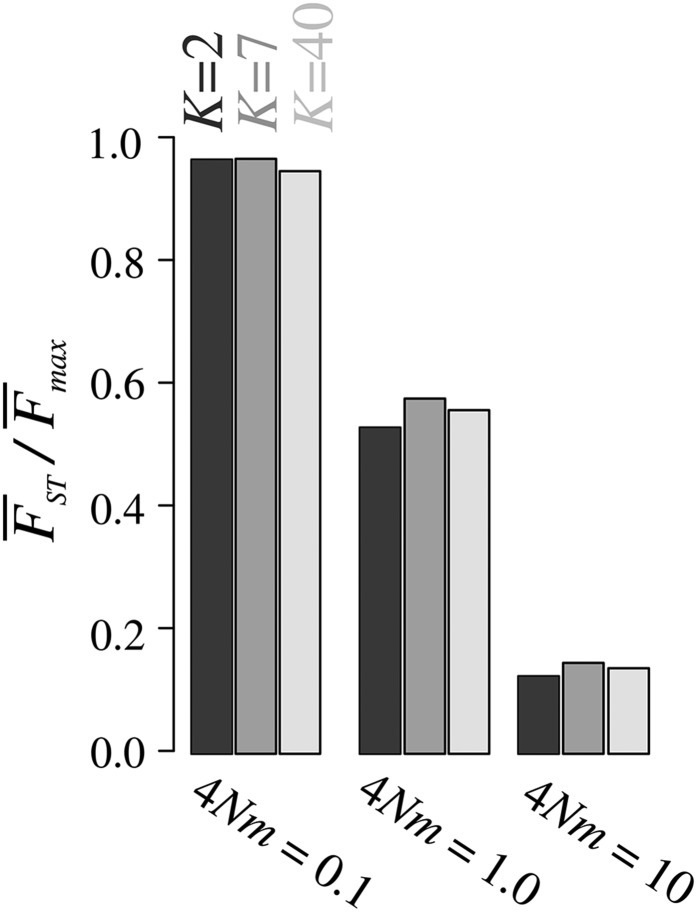
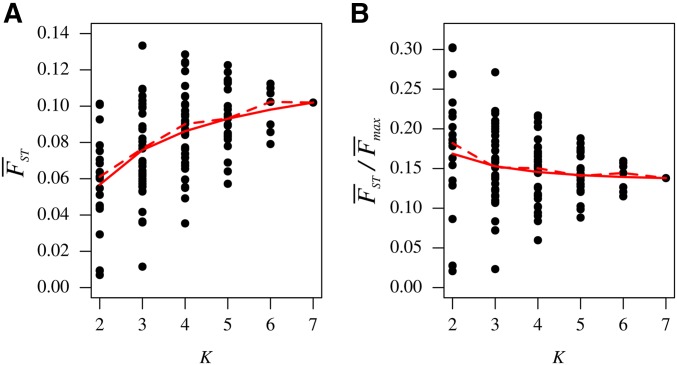
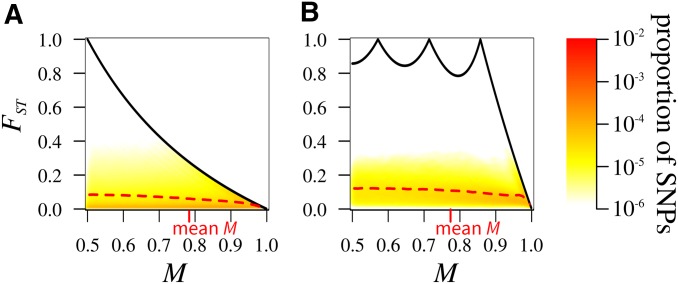
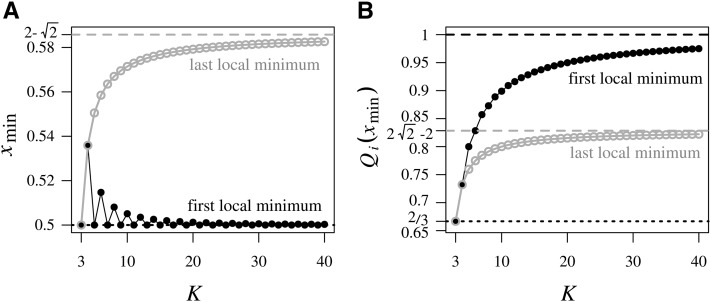
[Formula: see text] is one of the most widely used statistics in population genetics. Recent mathematical studies have identified constraints that challenge interpretations of [Formula: see text] as a measure with potential to range from 0 for genetically similar populations to 1 for divergent populations. We generalize results obtained for population pairs to arbitrarily many populations, characterizing the mathematical relationship between [Formula: see text] the frequency M of the more frequent allele at a polymorphic biallelic marker, and the number of subpopulations K We show that for fixed K, [Formula: see text] has a peculiar constraint as a function of M, with a maximum of 1 only if [Formula: see text] for integers i with [Formula: see text] For fixed M, as K grows large, the range of [Formula: see text] becomes the closed or half-open unit interval. For fixed K, however, some [Formula: see text] always exists at which the upper bound on [Formula: see text] lies below [Formula: see text] We use coalescent simulations to show that under weak migration, [Formula: see text] depends strongly on M when K is small, but not when K is large. Finally, examining data on human genetic variation, we use our results to explain the generally smaller [Formula: see text] values between pairs of continents relative to global [Formula: see text] values. We discuss implications for the interpretation and use of [Formula: see text].

Keywords: FST; allele frequency; genetic differentiation; migration; population structure.


Figures

Figure 1
Figure 1
Bounds on FST as a function of the frequency of the most frequent allele, M, for different numbers of subpopulations K: (A) K=2, (B) K=3, (C) K=7, (D) K=10, and (E) K=40. The shaded region represents the space between the upper and lower bounds on FST. The upper bound is computed from Equation 5; for each K, the lower bound is 0 for all values of M.
Figure 2
Figure 2
The mean A(K) of the upper bound on FST over the interval M[1/2,1), as a function of the number of subpopulations K. A(K) is computed from Equation 8 (black line). The approximation A(K) is computed from Equation 9 (gray dashed line). A numerical computation of the relative error of the approximation as a function of K, |A(K)A(K)|/A(K), finds that the maximal error for 2K1000 is 0.00174, achieved when K=2. The x-axis is plotted on a logarithmic scale.
Figure 3
Figure 3
Joint density of the frequency M of the most frequent allele and FST in the island migration model, for different numbers of subpopulations K and scaled migration rates 4Nm (where N is the subpopulation size and m the migration rate): (A) K=2, 4Nm=0.1; (B) K=7, 4Nm=0.1; (C) K=40, 4Nm=0.1; (D) K=2, 4Nm=1; (E) K=7, 4Nm=1; (F) K=40, 4Nm=1; (G) K=2, 4Nm=10; (H) K=7, 4Nm=10; and (I) K=40, 4Nm=10. The black solid line represents the upper bound on FST in terms of M (Equation 5); the red dashed line represents the mean FST in sliding windows of M of size 0.02 (plotted from 0.51 to 0.99). Colors represent the density of SNPs, estimated using a Gaussian kernel density estimate with a bandwidth of 0.007, with density set to 0 outside of the bounds. SNPs are simulated using coalescent software MS, assuming an island model of migration and conditioning on one segregating site. See Figure S5 in File S1 for an alternative algorithm for simulating SNPs. Each panel considers 100,000 replicate simulations, with 100 lineages sampled per subpopulation. Figures S2 and S3 in File S1 present similar results under finite rectangular and linear stepping-stone migration models.
Figure 4
Figure 4
F¯ST/F¯max, the ratio of the mean FST to the mean maximal FST given the observed frequency M of the most frequent allele, as a function of the number of subpopulations K and the scaled migration rate 4Nm for the island migration model. Colors represent values of K. FST values are computed from coalescent simulations using MS for 10,000 independent SNPs and 100 lineages sampled per subpopulation. F¯max is computed from Equation 11. Figure S4 in File S1 presents similar results under rectangular and linear stepping-stone migration models.
Figure 5
Figure 5
Mean FST values across loci for sets of geographic regions. Each box represents a particular combination of two, three, four, five, six, or all seven geographic regions. Within a box, the numerical value shown is FST among the regions. The regions considered are indicated by the pattern of “.” and “X” symbols within the box, with X indicating inclusion and “.” indicating exclusion. From left to right, the regions are Africa, Middle East, Europe, Central/South Asia, East Asia, Oceania, and America. Thus, for example, X...X.. indicates the subset {Africa, East Asia}. Lines are drawn between boxes that represent nested subsets. A line is colored red if the larger subset has a higher FST value, and blue if it has a lower FST. Computations rely on 577,489 SNPs from the HGDP.
Figure 6
Figure 6
FST values for sets of geographic regions as a function of K, the number of regions considered. (A) F¯ST computed using Equation 10. (B) F¯ST/F¯max computed using Equation 11. For each subset of populations, the value of FST is taken from Figure 5. The mean across subsets for a fixed K appears as a solid red line, and the median as a dashed red line.
Figure 7
Figure 7
Joint density of the frequency M of the most frequent allele and FST in human population-genetic data, considering 577,489 SNPs. (A) FST computed for pairs of geographic regions. The density is evaluated from the set of FST values for all 21 pairs of regions. (B) FST computed among K=7 geographic regions. The figure design follows Figure 3.
Figure B1
Figure B1
The first and last local minima of FST as functions of the frequency M of the most frequent allele, for K3 subpopulations. (A) Relative positions within the interval [i/K,(i+1)/K) of the first and last local minima, as functions of K. The position xmin(i) of the local minimum in interval Ii is computed from Equation B1. If K is odd, then this position is xmin[(K1)/2]; if K is even, then it is xmin(K/2). The position of the last local minimum is xmin(K2). Dashed lines indicate the smallest value for xmin(i) of 1/2, and the limiting largest value of 22. (B) The value of the upper bound on FST at the first and last local minima, as functions of K. These values are computed from Equation 5, taking KM=i and {KM}=xmin(i), with xmin(i) as in part (A). Dashed lines indicate the limiting values of 1 and 222 for the first and last local minima, respectively.

References

    1. 1000 Genomes Project Consortium , 2012. An integrated map of genetic variation from 1,092 human genomes. Nature 491: 56–65. - PMC - PubMed
    1. Akey J. M., Zhang G., Zhang K., Jin L., Shriver M. D., 2002. Interrogating a high-density SNP map for signatures of natural selection. Genome Res. 12: 1805–1814. - PMC - PubMed
    1. Alcala N., Goudet J., Vuilleumier S., 2014. On the transition of genetic differentiation from isolation to panmixia: what we can learn from GST and D. Theor. Popul. Biol. 93: 75–84. - PubMed
    1. Algee-Hewitt B. F. B., Edge M. D., Kim J., Li J. Z., Rosenberg N. A., 2016. Individual identifiability predicts population identifiability in forensic microsatellite markers. Curr. Biol. 26: 935–942. - PubMed
    1. Balloux F., Brünner H., Lugon-Moulin N., Hausser J., Goudet J., 2000. Microsatellites can be misleading: an empirical and simulation study. Evolution 54: 1414–1422. - PubMed

Publication types

Substances