

Plasma methoxytyramine: clinical utility with metanephrines for diagnosis of pheochromocytoma and paraganglioma
- PMID: 28476870
- PMCID: PMC5488393
- DOI: 10.1530/EJE-17-0077
Plasma methoxytyramine: clinical utility with metanephrines for diagnosis of pheochromocytoma and paraganglioma
Abstract
Context: Measurements of plasma methoxytyramine, the O-methylated dopamine metabolite, are useful for detecting rare dopamine-producing pheochromocytomas and paragangliomas (PPGLs) and head and neck paragangliomas (HNPGLs), but utility for screening beyond that achieved using standard measurements of normetanephrine and metanephrine is unclear.
Objective: Evaluation of the additional utility of methoxytyramine compared to plasma normetanephrine and metanephrine for diagnosis of PPGLs and HNPGLs.
Design: Comparative prospective study.
Methods: Comparison of mass spectrometric-based measurements of plasma methoxytyramine, normetanephrine and metanephrine in 1963 patients tested for PPGLs at six tertiary medical centers according to reference intervals verified in 423 normotensive and hypertensive volunteers.
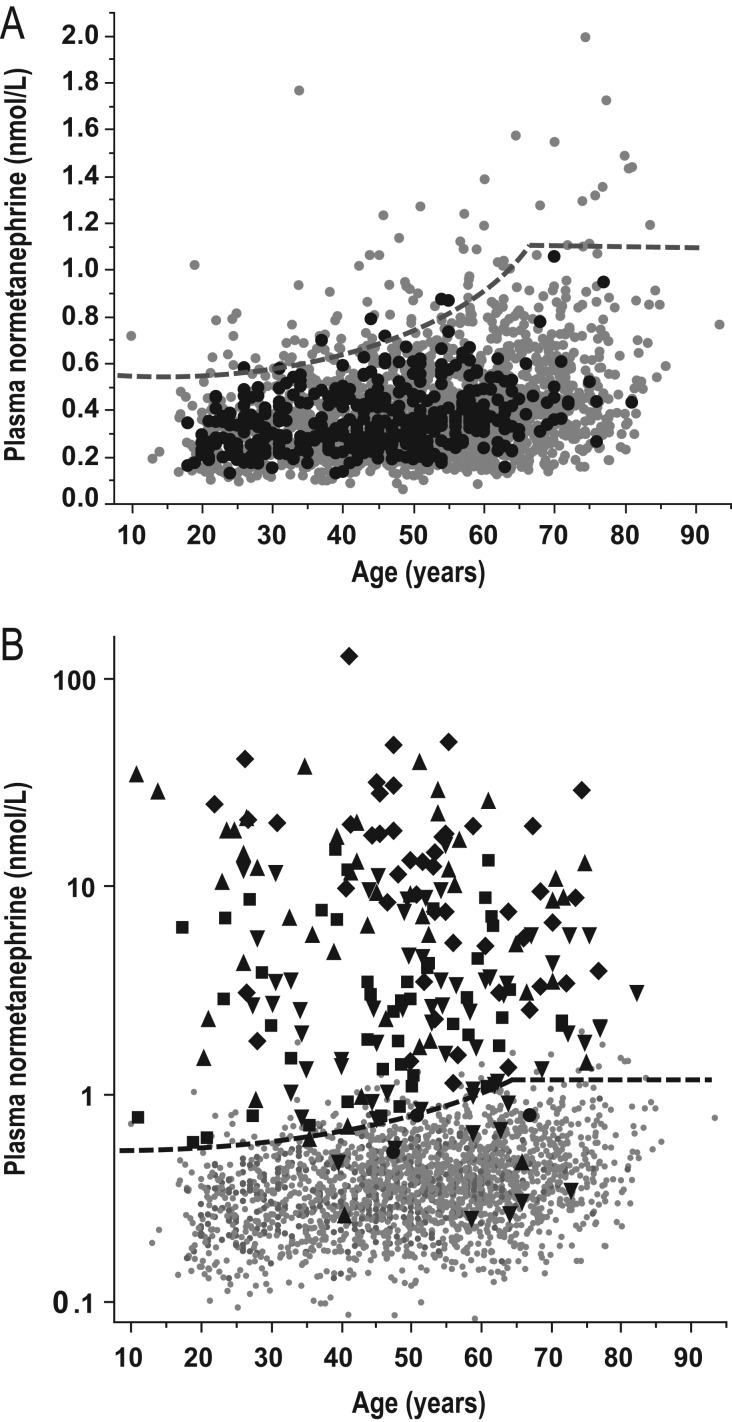
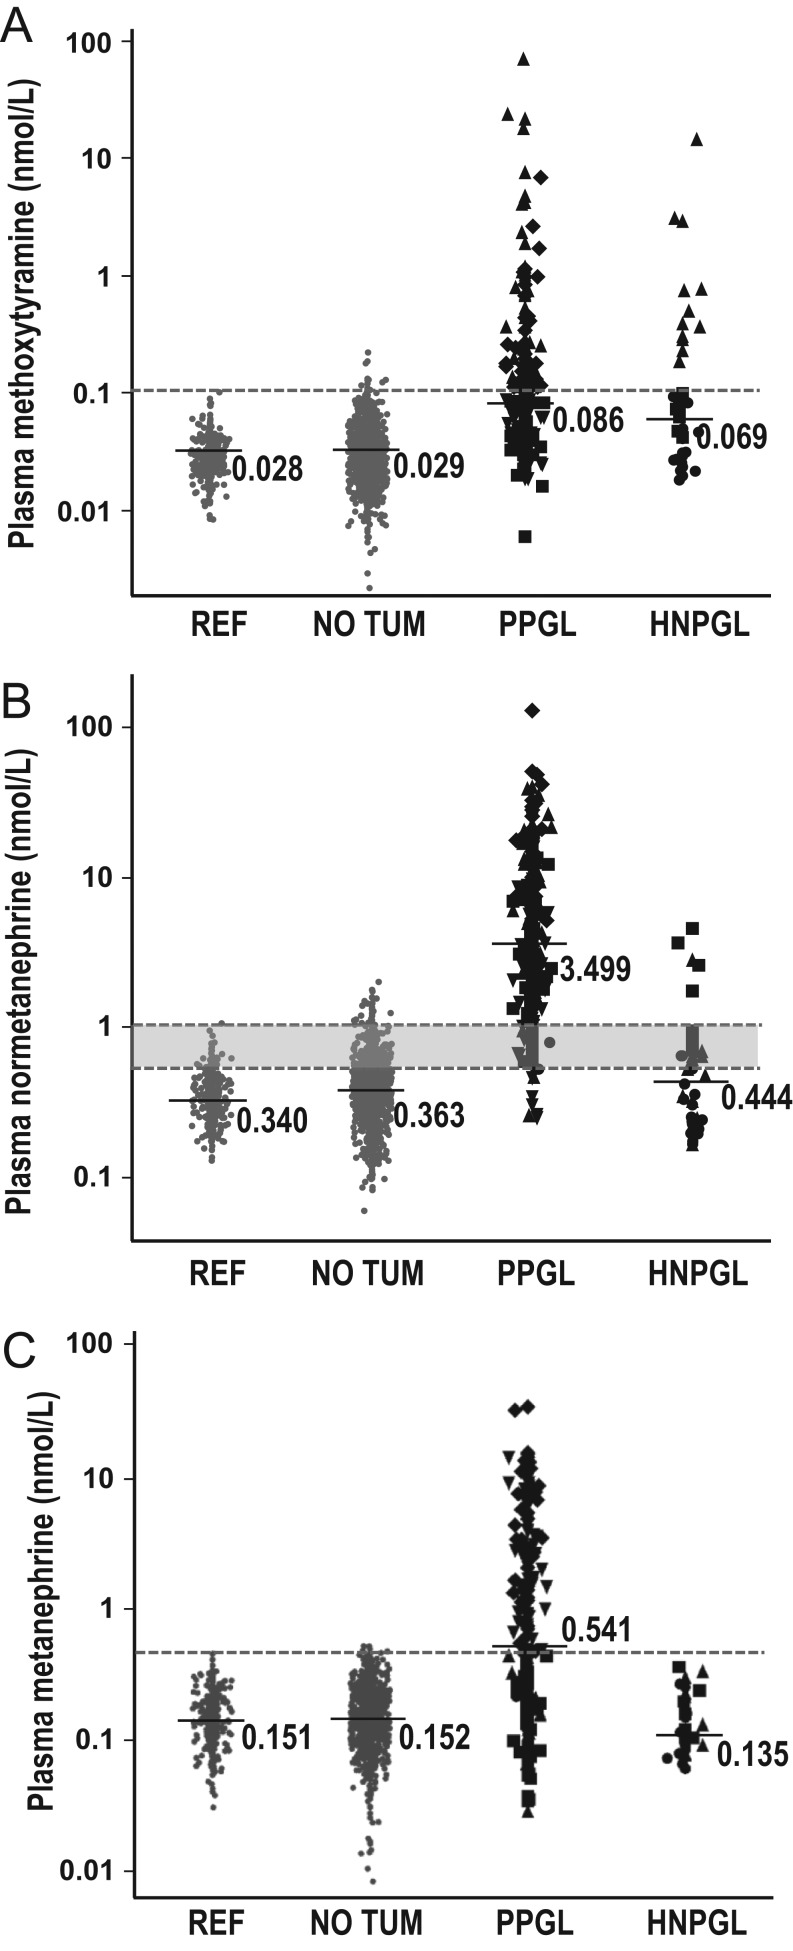
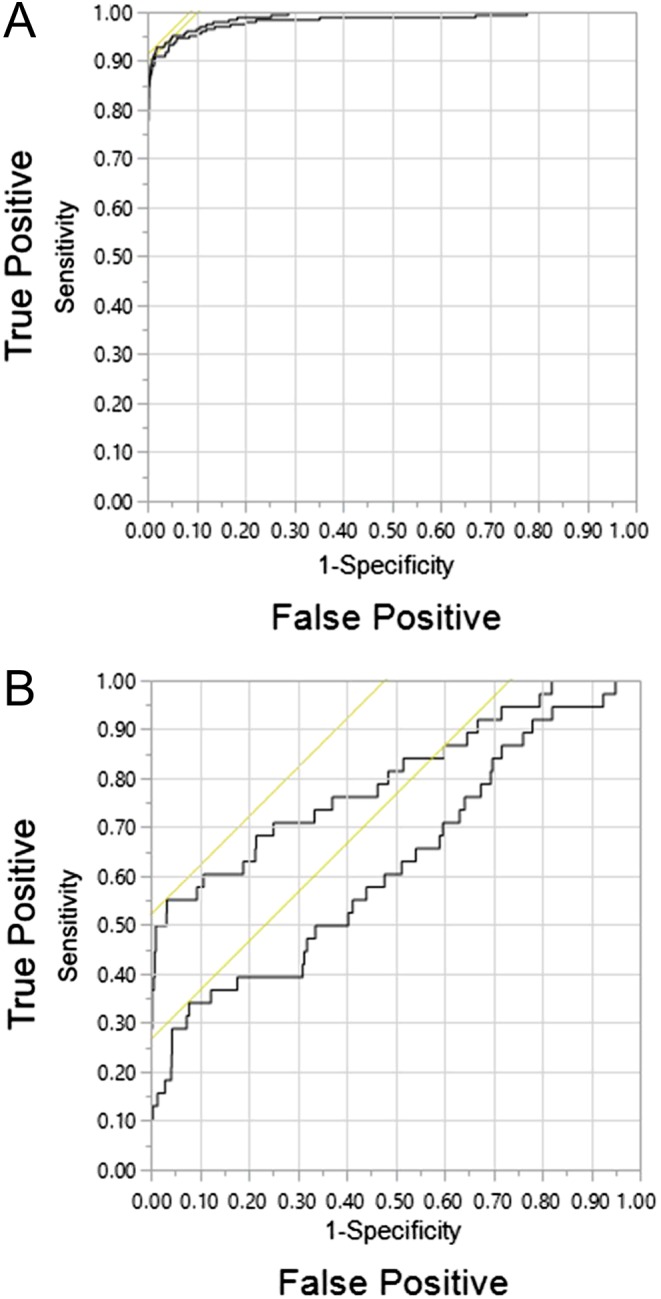
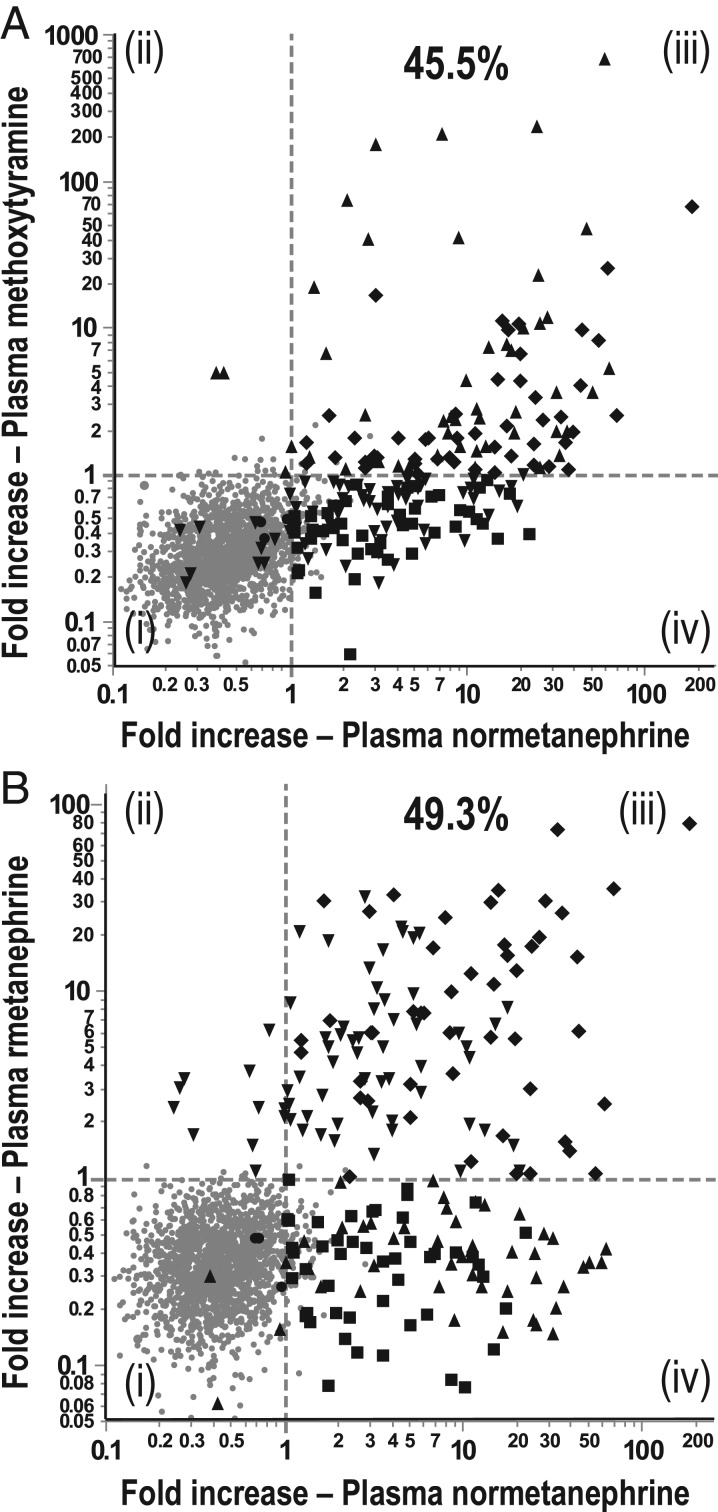
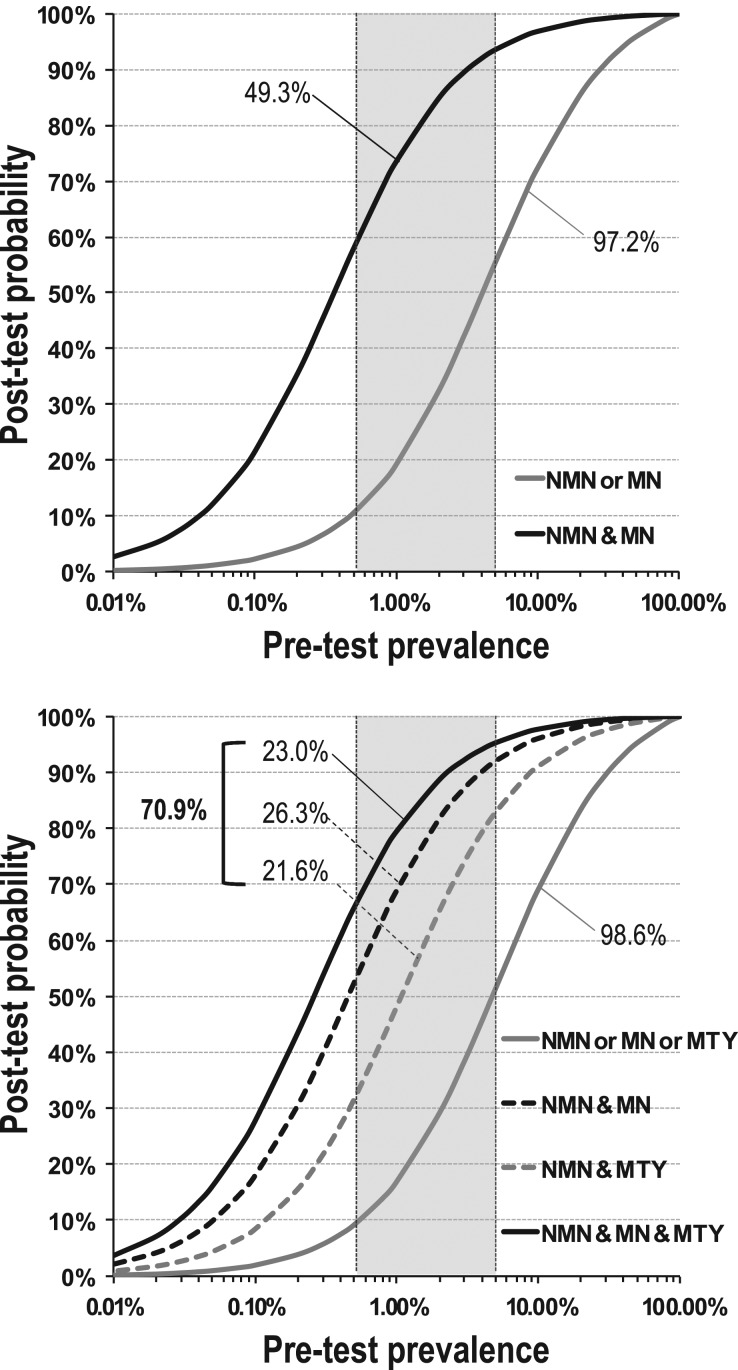
Results: Of the screened patients, 213 had PPGLs and 38 HNPGLs. Using an upper cut-off of 0.10 nmol/L for methoxytyramine, 0.45 nmol/L for metanephrine and age-specific upper cut-offs for normetanephrine, diagnostic sensitivity with the addition of methoxytyramine increased from 97.2% to 98.6% for patients with PPGLs and from 22.1% to 50.0% for patients with HNPGLs, with a small decrease in specificity from 95.9% to 95.1%. Addition of methoxytyramine did not significantly alter areas under receiver operating characteristic curves for patients with PPGLs (0.984 vs 0.991), but did increase (P < 0.05) areas for patients with HNPGLs (0.627 vs 0.801). Addition of methoxytyramine also increased the proportion of patients with PPGLs who showed highly positive predictive elevations of multiple metabolites (70.9% vs 49.3%).
Conclusions: While the benefit of additional measurements of plasma methoxytyramine for the detection of PPGLs is modest, the measurements do assist with positive confirmation of disease and are useful for the detection of HNPGLs.
© 2017 The authors.
Figures
Similar articles
-
Analysis of plasma 3-methoxytyramine, normetanephrine and metanephrine by ultraperformance liquid chromatography-tandem mass spectrometry: utility for diagnosis of dopamine-producing metastatic phaeochromocytoma.Ann Clin Biochem. 2013 Mar;50(Pt 2):147-55. doi: 10.1258/acb.2012.012112. Ann Clin Biochem. 2013. PMID: 23512172
-
Laboratory evaluation of pheochromocytoma and paraganglioma.Clin Chem. 2014 Dec;60(12):1486-99. doi: 10.1373/clinchem.2014.224832. Epub 2014 Oct 20. Clin Chem. 2014. PMID: 25332315 Review.
-
Plasma metanephrines and prospective prediction of tumor location, size and mutation type in patients with pheochromocytoma and paraganglioma.Clin Chem Lab Med. 2020 Oct 1;59(2):353-363. doi: 10.1515/cclm-2020-0904. Clin Chem Lab Med. 2020. PMID: 33001846
-
Levodopa therapy in Parkinson's disease: influence on liquid chromatographic tandem mass spectrometric-based measurements of plasma and urinary normetanephrine, metanephrine and methoxytyramine.Ann Clin Biochem. 2014 Jan;51(Pt 1):38-46. doi: 10.1177/0004563213487894. Epub 2013 Jul 19. Ann Clin Biochem. 2014. PMID: 23873873
-
Diagnosis of endocrine disease: Biochemical diagnosis of phaeochromocytoma and paraganglioma.Eur J Endocrinol. 2014 Feb 4;170(3):R109-19. doi: 10.1530/EJE-13-0882. Print 2014 Mar. Eur J Endocrinol. 2014. PMID: 24347425 Review.
Cited by
-
A rare case report: vaginal paraganglioma.Am J Transl Res. 2022 Dec 15;14(12):8773-8781. eCollection 2022. Am J Transl Res. 2022. PMID: 36628227 Free PMC article.
-
BILATERAL CAROTID BODY PARAGANGLIOMAS - LITERATURE REVIEW AND COMMENTS IN A PATIENT WITH NO SIGNS OF MEN SYNDROME.Acta Endocrinol (Buchar). 2023 Jan-Mar;19(1):133-141. doi: 10.4183/aeb.2023.133. Epub 2023 Aug 14. Acta Endocrinol (Buchar). 2023. PMID: 37601710 Free PMC article.
-
Clinical consensus guideline on the management of phaeochromocytoma and paraganglioma in patients harbouring germline SDHD pathogenic variants.Lancet Diabetes Endocrinol. 2023 May;11(5):345-361. doi: 10.1016/S2213-8587(23)00038-4. Epub 2023 Mar 31. Lancet Diabetes Endocrinol. 2023. PMID: 37011647 Free PMC article. Review.
-
Genetic and Molecular Biomarkers in Aggressive Pheochromocytomas and Paragangliomas.Int J Mol Sci. 2024 Jun 28;25(13):7142. doi: 10.3390/ijms25137142. Int J Mol Sci. 2024. PMID: 39000254 Free PMC article. Review.
-
Contemporary management of paragangliomas of the head and neck.Laryngoscope Investig Otolaryngol. 2021 Nov 26;7(1):93-107. doi: 10.1002/lio2.706. eCollection 2022 Feb. Laryngoscope Investig Otolaryngol. 2021. PMID: 35155787 Free PMC article. Review.
References
-
- Lenders JWM, Duh QY, Eisenhofer G, Gimenez-Roqueplo AP, Grebe SK, Murad MH, Naruse M, Pacak K, Young WF, Jr, Endocrine Society Pheochromocytoma and paraganglioma: an Endocrine Society Clinical Practice Guideline. Journal of Clinical Endocrinology and Metabolism 2014. 99 1915–1942. (10.1210/jc.2014-1498) - DOI - PubMed
Publication types
MeSH terms
Substances
LinkOut - more resources
Full Text Sources
Other Literature Sources
Medical
