. 2017 Aug 1;313(2):H354-H367.
doi: 10.1152/ajpheart.00070.2017. Epub 2017 May 5.

Cervical vagus nerve stimulation augments spontaneous discharge in second- and higher-order sensory neurons in the rat nucleus of the solitary tract

Affiliations

Cervical vagus nerve stimulation augments spontaneous discharge in second- and higher-order sensory neurons in the rat nucleus of the solitary tract

Eric Beaumont et al. Am J Physiol Heart Circ Physiol. .

Abstract

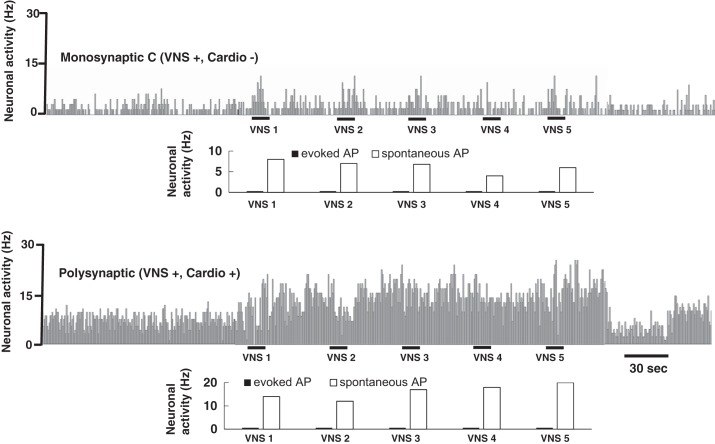
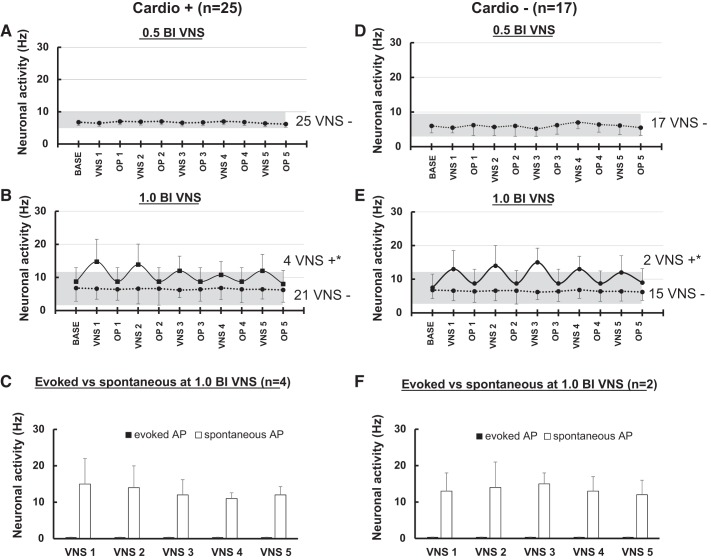
Vagus nerve stimulation (VNS) currently treats patients with drug-resistant epilepsy, depression, and heart failure. The mild intensities used in chronic VNS suggest that primary visceral afferents and central nervous system activation are involved. Here, we measured the activity of neurons in the nucleus of the solitary tract (NTS) in anesthetized rats using clinically styled VNS. Our chief findings indicate that VNS at threshold bradycardic intensity activated NTS neuron discharge in one-third of NTS neurons. This VNS directly activated only myelinated vagal afferents projecting to second-order NTS neurons. Most VNS-induced activity in NTS, however, was unsynchronized to vagal stimuli. Thus, VNS activated unsynchronized activity in NTS neurons that were second order to vagal afferent C-fibers as well as higher-order NTS neurons only polysynaptically activated by the vagus. Overall, cardiovascular-sensitive and -insensitive NTS neurons were similarly activated by VNS: 3/4 neurons with monosynaptic vagal A-fiber afferents, 6/42 neurons with monosynaptic vagal C-fiber afferents, and 16/21 polysynaptic NTS neurons. Provocatively, vagal A-fibers indirectly activated C-fiber neurons during VNS. Elevated spontaneous spiking was quantitatively much higher than synchronized activity and extended well into the periods of nonstimulation. Surprisingly, many polysynaptic NTS neurons responded to half the bradycardic intensity used in clinical studies, indicating that a subset of myelinated vagal afferents is sufficient to evoke VNS indirect activation. Our study uncovered a myelinated vagal afferent drive that indirectly activates NTS neurons and thus central pathways beyond NTS and support reconsideration of brain contributions of vagal afferents underpinning of therapeutic impacts.NEW & NOTEWORTHY Acute vagus nerve stimulation elevated activity in neurons located in the medial nucleus of the solitary tract. Such stimuli directly activated only myelinated vagal afferents but indirectly activated a subpopulation of second- and higher-order neurons, suggesting that afferent mechanisms and central neuron activation may be responsible for vagus nerve stimulation efficacy.

Keywords: baroreceptors; blood pressure; echocardiography; nucleus of the solitary tract; rats; vagal primary afferents; vagus nerve stimulation.


Conflict of interest statement

B. KenKnight and I. Libbus are employees of Cyberonics, Inc./LivaNova PLC.

Figures

Fig. 1.
Fig. 1.
Basic identification of single neuron action potentials and definition of A- and C-fiber conduction and monosynaptic/polysynaptic pathways. Recorded electroneurograms (ENGs) were submitted to sorting analysis of extracellular action potentials based on principal component analysis (PCA; Spike 2 software). For PCA, two examples are given of a monosynaptic arrival analysis and calculation of latency, conduction velocity, and synaptic jitter-measured variation in latency (jitter = SD of latency across 10 iterative vagal stimuli). Vagal pulse stimulus (downward arrow) marks stimulus delivery to the left vagus. The break in the ENG represents blanking of the stimulus artifact. A: single supramaximal vagal stimulus (3.5 mA, 100-µs duration) triggered an action potential at the filled circle in neuron 1. Successive stimulus trials (traces not shown) evoked action potential arrivals (small filled circles) in neuron 1 with an average latency of 27 ms (ranging from 23 and 34 ms over 10 consecutive trials). The latency was measured as the time between the onset of the vagus nerve stimulus artifact to the half-height of the unit action potential. PCA created statistical match templates that recognized unique spikes based on the shape, width, and amplitude within set upper and lower limits (green lines in PCA templates). For an action potential profile to be categorized as PCA compliant, at least 80% of the trace must be contained within these limits. Neuron 2 had an average latency of 44 ms (ranging between 30 and 55 ms). NTS, nucleus of the solitary tract. B: responses to paired pulses (interval of 10 ms) discriminated monosynaptic from polysynaptic vagal paths. Neuron 1 successfully followed both stimuli (arrows) to generate two successful action potentials (filled circles) and demonstrated that the vagal input was monosynaptically connected to a C-fiber vagal afferent. Neuron 2 showed a failed action potential (unfilled circle) consistent with a polysynaptic path from the vagus. Note that in A, neuron 2 displayed highly variable arrival times and a high jitter consistent with a polysynaptic path.
Fig. 2.
Fig. 2.
Cardiovascular responsiveness was judged by monitoring NTS neuron activity during induced blood pressure changes (Cardio+). A bolus of nitroglycerin injected intravenously decreased pressure and was followed by intravenous phenylephrine to raise blood pressure (BP). Note that such bolus injections only briefly altered pressure (4-6 s). A, top trace: NTS ENG and PCA identified neuron 1 (same neuron 1 as Fig. 1) summed in the histogram plot during BP manipulations. The histogram plot displays binned spike counts of neuronal activity for each cardiac cycle. Original pulsatile BP and ECG traces are included at bottom. B: neuronal activity of neuron 1 was converted to Hz by dividing spike counts by each cardiac period and analyzed by plotting neuron 1 activity against systolic BP. Note that lowering pressure from rest did not affect neuronal activity. Neuron 1 had a null slope relationship between systolic BPs and discharge below systolic pressure of 155 mmHg (horizontal line). Above pressure threshold, neuron 1 increased activity linearly with increases in systolic BP and was well described by the linear regression fit. The intersection of the subthreshold and suprathreshold linear regressions defined the threshold for discharge (155 mmHg) for neuron 1. The response to vagus nerve stimuli indicated that this NTS neuron received a monosynaptic C-fiber input conducting at 1 m/s with a jitter of 4.5 ms. The x-axes in A are broken (eliminating 20 s) for clarity. C: mean BP and heart rate responses showing that lowering BP with nitroglycerin minimally affected heart rate but increasing BP with phenylephrine induced bradycardia. Nitro, nitroglycerin; PE, phenylephrine. *P < 0.05, significantly different compared with baseline.
Fig. 3.
Fig. 3.
Summaries comparing neuron pathway type of NTS neurons for both Cardio+ and Cardio− neurons. A: C-fiber conducting inputs from the vagus activated the largest proportion of second-order neurons regardless of cardiovascular responsiveness. A-fiber vagal second-order neurons were the rarest subset, with none being found in the Cardio– group. B and C: pressure sensitivity (in Hz/mmHg; B) and pressure thresholds (in mmHg; C) in cardiovascular responsive NTS neurons. Values were determined by regression fits, as described in Fig. 2. Monosynaptic A-type vagal afferents were associated with significantly higher pressure sensitivity and lower pressure thresholds compared with C-type monosynaptic or polysynaptic pathways. Polysynaptic pathway responses to pressure manipulations were not different from C-type pathways. *P < 0.05, significantly different.
Fig. 4.
Fig. 4.
Vagal nerve stimulation (VNS) allowed the determination of vagal afferent intensity thresholds as well as discriminating evoked action potentials (eAP) from spontaneous action potentials (sAP). A: cycles of VNS began with progressive increases in stimulation intensity [relative to 1.0 bradycardic intensity (BI)] (ramp up) over 2 s with each pulse separated by 50 ms (20-Hz stimulation) followed by a constant current output for 14 s and terminated by a ramp down of 2 s. In this example, the plateau current level was set at the 1.0 BI and evoked a decrease in BP of 5% during VNS. BP promptly recovered in the off phases [off phase (OP) 1] of 44 s that completes the first cycle. B: by monitoring whether the NTS neuron responded with an eAP during the initial ramp up, we noted the electrical recruitment intensity thresholds. Open circles indicate spike failures based on the anticipated arrival time. Filled circles mark successfully evoked APs. Bottom: relative shock amplitude (compared with 1.0 BI) during the first VNS cycle (VNS 1). Two subthreshold pulses (P1 and P2) failed to evoke APs, but P3 successfully evoked an action potential (eAP) with a 0.6-mA threshold value and a latency of 6.2 ± 0.1 ms. Note that despite higher intensity, P4 failed to evoke an AP, whereas P5 successfully evoked an action potential. The action potential latencies indicated an A-fiber type with a calculated conduction velocity of >3.5 m/s. C: histogram of VNS activity relative to the stimulus onset. The earliest bin collected the eAP with a success rate of ~25% from 5 Hz to a rate of 20-Hz vagal stimuli. Note that sAPs also occurred that were not temporally synched to vagal stimuli and arrived between 10 and 50 ms.
Fig. 5.
Fig. 5.
Simultaneously recorded pairs of NTS neurons allowed comparison of neurons lying in close proximity within the NTS using a single electrode position. The example shows the activity of a monosynaptic A-fiber second-order NTS neuron together with a polysynaptic vagal higher-order NTS neuron. VNS conditioning augmented the activity in the second-order neuron (top, VNS+) that other test not shown also increased to pressure changes (Cardio+), whereas the adjacent higher-order vagal neuron was unaffected by VNS (VNS−) or pressure (Cardio−). The spontaneous (sAP) and evoked (eAP) activity during VNS for each neuron is indicated at the bottom of each VNS cycle. Note that no eAPs were found in the polysynaptic neuron, as expected.
Fig. 6.
Fig. 6.
The major effect of VNS was to increase in NTS neuron activity that was not synchronized to the VNS stimuli. Paired recordings show that only sAP activity increased both in a C-fiber second-order, Cardio− NTS neuron (top) as well as a polysynaptically coupled Cardio+ vagal higher-order neuron (bottom). In neither neuron did 1.0 BI VNS activate eAPs. However, VNS augmented spontaneous (sAP) activity to a much greater extent in the higher-order neuron, which extended into the OPs.
Fig. 7.
Fig. 7.
Summary of VNS responses in A-fiber second-order NTS neurons (n = 4). Note all these were Cardio+ and no Cardio– A-fiber neurons were detected. VNS consisted of cycles with active stimulation at 20 Hz (250-µs pulse duration) lasting 18 s followed by 44 s of no stimulation (OP). Five cycles of VNS (VNS 1, VNS 2, etc.) were performed, first at 0.5 BI and then at 1.0 BI. Basal activity was measured as activity for 6 s preceding VNS (BASE). Neurons whose activity during VNS increased were considered VNS+ (squares), whereas other neurons were VNS – (circles) with ±SE. BASE is plotted as a shaded gray band of activity ± SE. A: the weakest stimuli, 0.5 BI VNS, failed to activate any activity response in these A-fiber second-order NTS neurons. B: at 1.0 BI, VNS activated 3 of 4 NTS neurons during the active phase of VNS compared with the OP (P < 0.05). The single VNS– A-fiber second-order neuron was unaffected by 1.0 BI VNS. C: partitioning evoked from spontaneous action potentials showed greater increases in sAPs than eAPs from NTS neurons receiving monosynaptic A-fiber inputs: *P < 0.05, significant main effect of VNS compared with OP using repeated-measures ANOVA on ranks; #P < 0.05, significantly higher compared with the evoked action potential at VNS 1.
Fig. 8.
Fig. 8.
Summary of VNS conditioning of C-fiber second-order NTS neurons. Cardio+ neurons (n = 25) and Cardio− neurons (n = 17) showed similar response patterning to VNS. A and D: weak 0.5 BI VNS failed to alter action potentials in these neurons. All activity was spontaneous and equaled basal rates (gray banding). B and E: the increase to 1.0 BI VNS activated a small subset (VNS+) of neurons, 4 Cardio+ and 2 Cardio−. C and F: all increased action potential activity in response to VNS was spontaneous (sAP) in VNS+ neurons. *P < 0.05, significant main effect of VNS compared with nonstimulating phases using repeated-measures ANOVA on ranks.
Fig. 9.
Fig. 9.
Summary of VNS conditioning of vagal higher-order NTS neurons. Cardio+ and Cardio− neurons responded to VNS with the distinct that weak (0.5 BI) as well as therapeutic 1.0 BI VNS increased activity. A: weak VNS (0.5 BI) modestly increased sAP activity similarly in 4 Cardio+ and 3 Cardio− NTS neurons. B: when there was an increase to 1.0 BI, VNS increased activity in most higher-order NTS neurons, 9 Cardio+ and 7 Cardio−. Red lines indicate the responses of neurons activated at 0.5 BI to 1.0 BI VNS. Green lines indicate the activity of neurons that responded only at 1.0 BI VNS. Additionally, post hoc analysis showed that the VNS+ neurons that were activated exclusively at 1.0 BI (green lines) in Cardio+ and in Cardio− neurons maintained increased activity during OP 4 and OP 5. *P < 0.05, significant main effect of VNS compared with nonstimulating phases using repeated-measures ANOVA on ranks; #post hoc Student-Newman-Keuls tests showing higher activity level compared with baseline (BASE) and OP 1.
Fig. 10.
Fig. 10.
Summary of heart rate changes associated with VNS conditioning at 1.0 BI. VNS significantly induced bradycardia during active VNS but recovered to baseline (BASE) during OP. Data shown are relative changes compared with baseline heart rate ± SE. *P < 0.05, significant effect of VNS compared with both baseline and OP.

References

    1. Andresen MC, Hofmann ME, Fawley JA. The unsilent majority-TRPV1 drives “spontaneous” transmission of unmyelinated primary afferents within cardiorespiratory NTS. Am J Physiol Regul Integr Comp Physiol 303: R1207–R1216, 2012. doi: 10.1152/ajpregu.00398.2012. - DOI - PMC - PubMed
    1. Andresen MC, Kunze DL. Nucleus tractus solitarius–gateway to neural circulatory control. Annu Rev Physiol 56: 93–116, 1994. doi: 10.1146/annurev.ph.56.030194.000521. - DOI - PubMed
    1. Andresen MC, Kunze DL, Mendelowitz D. Central nervous system regulation of the heart. In: Basic and Clinical Neurocardiology, edited by Armour JA, Ardell JL. New York: Oxford Univ. Press, 2004.
    1. Andresen MC, Peters JH. Comparison of baroreceptive to other afferent synaptic transmission to the medial solitary tract nucleus. Am J Physiol Heart Circ Physiol 295: H2032–H2042, 2008. doi: 10.1152/ajpheart.00568.2008. - DOI - PMC - PubMed
    1. Ardell JL, Rajendran PS, Nier HA, KenKnight BH, Armour JA. Central-peripheral neural network interactions evoked by vagus nerve stimulation: functional consequences on control of cardiac function. Am J Physiol Heart Circ Physiol 309: H1740–H1752, 2015. - PMC - PubMed

LinkOut - more resources