. 2017 May 6;15(1):37.
doi: 10.1186/s12951-017-0270-9.

Tracking single baculovirus retrograde transportation in host cell via quantum dot-labeling of virus internal component

Affiliations

Tracking single baculovirus retrograde transportation in host cell via quantum dot-labeling of virus internal component

Li Wen et al. J Nanobiotechnology. .

Abstract

Background: Quantum dot (QD)-based single virus tracking has become a powerful tool for dissecting virus infection mechanism. However, only virus behaviors at the early stage of retrograde trafficking have been dynamically tracked so far. Monitoring of comprehensive virus retrograde transportation remains a challenge.

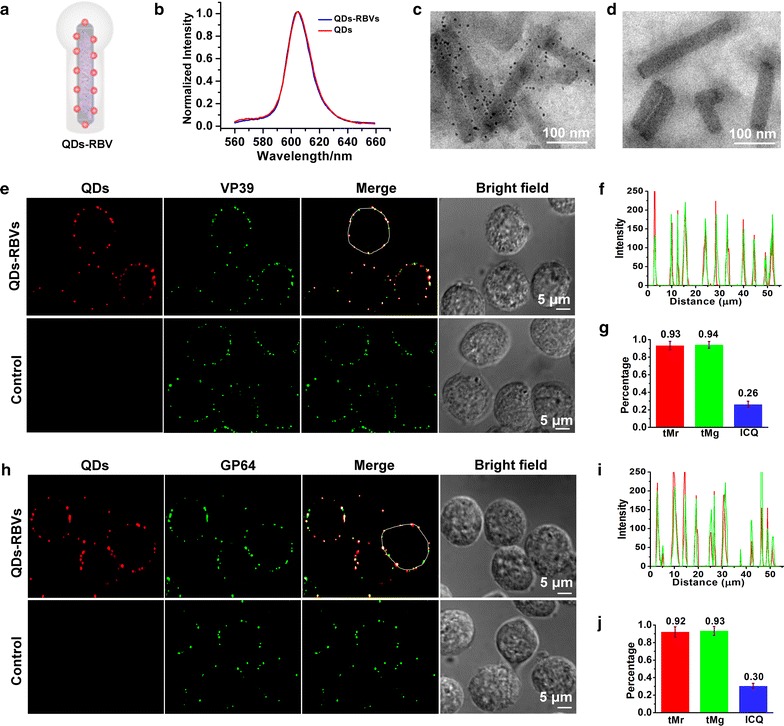
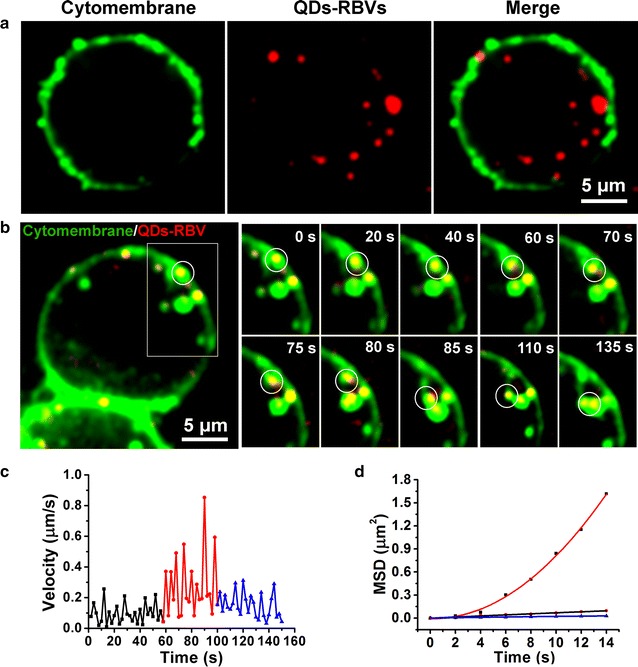
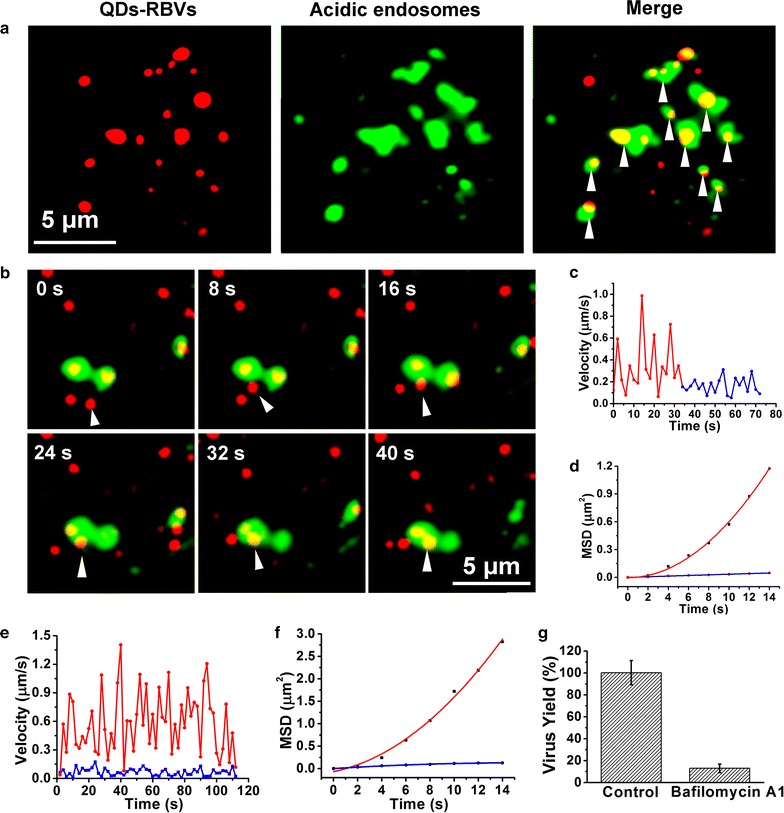
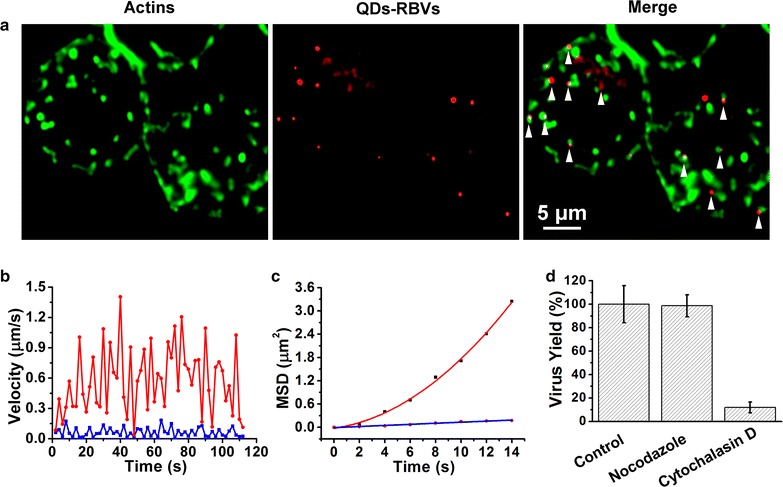
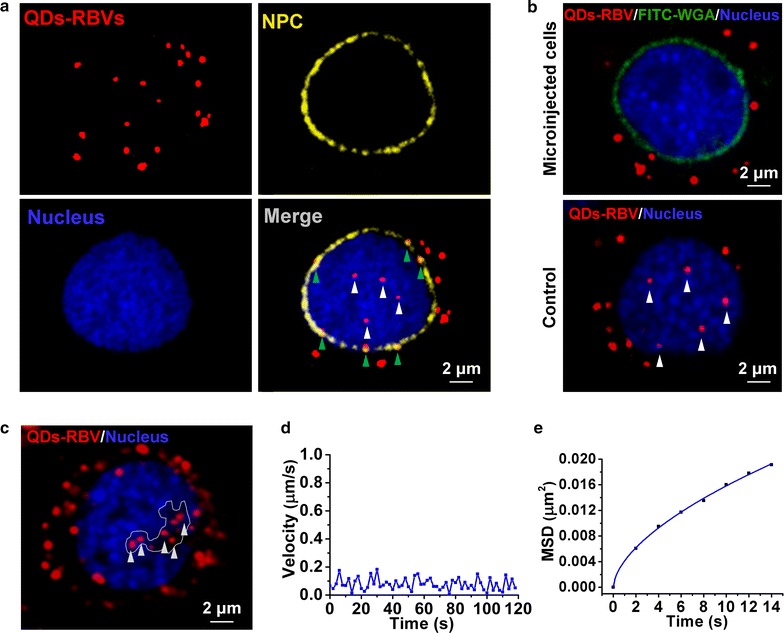
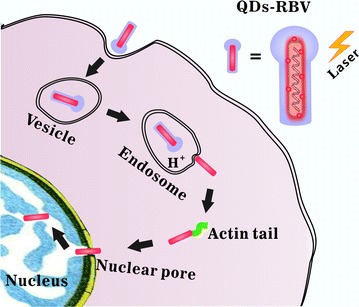
Results: Based on the superior fluorescence properties of QDs and their labeling of virus internal component, the dynamic interactions between baculoviruses and all key transportation-related cellular structures, including vesicles, acidic endosomes, actins, nuclear pores and nuclei, were visualized at the single-virus level. Detailed scenarios and dynamic information were provided for these critical interaction processes.

Conclusions: A comprehensive model of baculovirus retrograde trafficking involving virus endocytosis, fusion with acidic endosome, translocation to nuclear periphery, internalization into nucleus, and arriving at the destination in nucleus was proposed. Thus the whole retrograde transportation of baculovirus in live host cells was elucidated at the single-virus level for the first time.

Keywords: Baculovirus; Host cells; Quantum dots; Retrograde transportation; Single virus tracking.


Figures

Fig. 1
Fig. 1
Characterization of QDs-RBV. a Scheme of QDs-RBV. b Fluorescence emission spectra of QDs and QDs-RBVs. TEM images of QDs-RBVs (c) and WBVs incubated with SA-QDs (d). Fluorescence colocalization of QDs with immunolabeled VP39 (e) and immunolabeled GP64 (h) of QDs-RBVs attached to Sf9 cell. Control: WBVs incubated with SA-QDs. f, i Line profiles of the red and green signals distributed on the white circles shown in e and h, respectively. g, j Histograms for Manders coefficients tMr and tMg, and ICQ values corresponding to e and h, respectively
Fig. 2
Fig. 2
Dynamic interaction between QDs-RBVs and vesicles. a Fluorescence images of QDs-RBVs internalized into Sf9 cells with CellMask-labeled cytomembrane. b Typical time-lapse images of the circled QDs-RBV (red) entering into a Sf9 cell together with CellMask-labeled vesicles (green). Velocity vs time plots (c) and MSD vs time plots (d) of the circled QDs-RBV shown in b. The red curve in d is the fit to MSD=4Dτ+(Vτ)2+constant. Both the black and the blue lines in d are the fits to MSD=4Dτα+constant
Fig. 3
Fig. 3
Dynamic interaction between QDs-RBVs and acidic endosomes. a Fluorescence images of QDs-RBVs, LysoTracker Green labeled acidic endosomes, and their merge (arrows) in Sf9 cells. b Typical time-lapse images of a QDs-RBV (red) entering into an acidic endosome (green). Velocity vs time plots (c) and MSD vs time plots (d) corresponding to b. The red curve and blue line in d is the fit to MSD=4Dτ+(Vτ)2+constant and MSD=4Dτα+constant, respectively. Typical velocity vs time plots (e) and MSD vs time plots (f) of the QDs-RBVs in Sf9 cells with (blue) and without (red) Bafilomycin A1 treatment. The red curve and blue line in f is the fit to MSD=4Dτ+(Vτ)2+constant and MSD=4Dτα+constant, respectively. g Histograms for the yields of baculoviruses propagated in Sf9 cells without or with Bafilomycin A1 treatment
Fig. 4
Fig. 4
Interaction between QDs-RBVs and actins. a Fluorescence images of QDs-RBVs, phalloidin-FITC labeled actins and their merge (arrows) in Sf9 cells. Typical velocity vs time plots (b) and MSD vs time plots (c) of the QDs-RBVs in Sf9 cells with (blue) and without (red) cytochalasin D treatment. The red curve and blue line in c is the fit to MSD=4Dτ+(Vτ)2+constant and MSD=4Dτα+constant, respectively. d Histograms for the yields of baculoviruses propagated in untreated, nocodazole-treated and cytochalasin D-treated Sf9 cells
Fig. 5
Fig. 5
Interaction between QDs-RBVs and nucleus. a Fluorescence images of QDs-RBVs, immunolabeled NPC, Hoechst 33342-labeled nucleus and their merge in Sf9 cells. b Fluorescence images of QDs-RBVs in Sf9 cell microinjected with or without (the control) FITC-WGA. c Fluorescence images of QDs-RBVs confined in the non-nucleic acids area (white-line defined) of nucleus. Typical velocity vs time plots (d) and MSD vs time plots (e) of the arrowed QDs-RBVs shown in c. The curve in e is the fit to MSD=4Dτα+constant
Fig. 6
Fig. 6
Schematic illustration of the interactions of individual QDs-RBV with vesicle, acidic endosome, actin and nucleus during the whole retrograde transportation in host cell

Similar articles

Cited by

References

    1. Kaye D, Pringle CR. Avian influenza viruses and their implication for human health. Clin Infect Dis. 2005;40:108–112. doi: 10.1086/427236. - DOI - PubMed
    1. Brandenburg B, Zhuang XW. Virus trafficking—learning from single-virus tracking. Nat Rev Microbiol. 2007;5:197–208. doi: 10.1038/nrmicro1615. - DOI - PMC - PubMed
    1. Lara HH, Ixtepan-Turrent L, Garza-Treviño EN, Rodriguez-Padilla C. PVP-coated silver nanoparticles block the transmission of cell-free and cell-associated HIV-1 in human cervical culture. J Nanobiotechnol. 2010;8:15. doi: 10.1186/1477-3155-8-15. - DOI - PMC - PubMed
    1. Wen L, Lin Y, Zhang ZL, Lu W, Lv C, Chen ZL, Wang HZ, Pang DW. Intracellular self-assembly based multi-labeling of key viral components: envelope, capsid and nucleic acids. Biomaterials. 2016;99:24–33. doi: 10.1016/j.biomaterials.2016.04.038. - DOI - PubMed
    1. Liu SL, Wang ZG, Zhang ZL, Pang DW. Tracking single viruses infecting their host cells using quantum dots. Chem Soc Rev. 2016;45:1211–1224. doi: 10.1039/C5CS00657K. - DOI - PubMed

Substances

LinkOut - more resources