. 2017 Oct;74(19):3577-3598.
doi: 10.1007/s00018-017-2533-x. Epub 2017 May 6.

FRET studies of various conformational states adopted by transthyretin

Affiliations

FRET studies of various conformational states adopted by transthyretin

Seyyed Abolghasem Ghadami et al. Cell Mol Life Sci. 2017 Oct.

Abstract

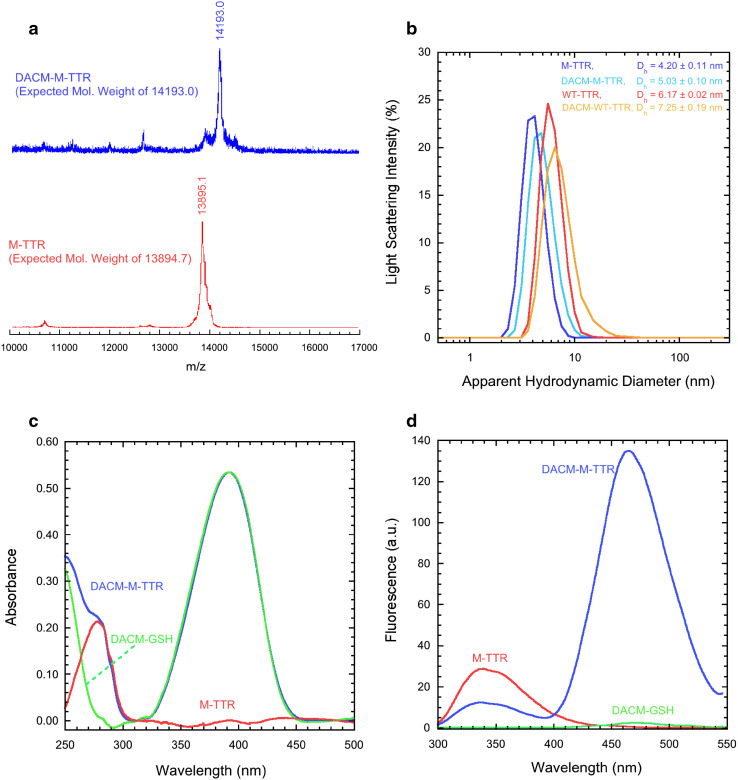
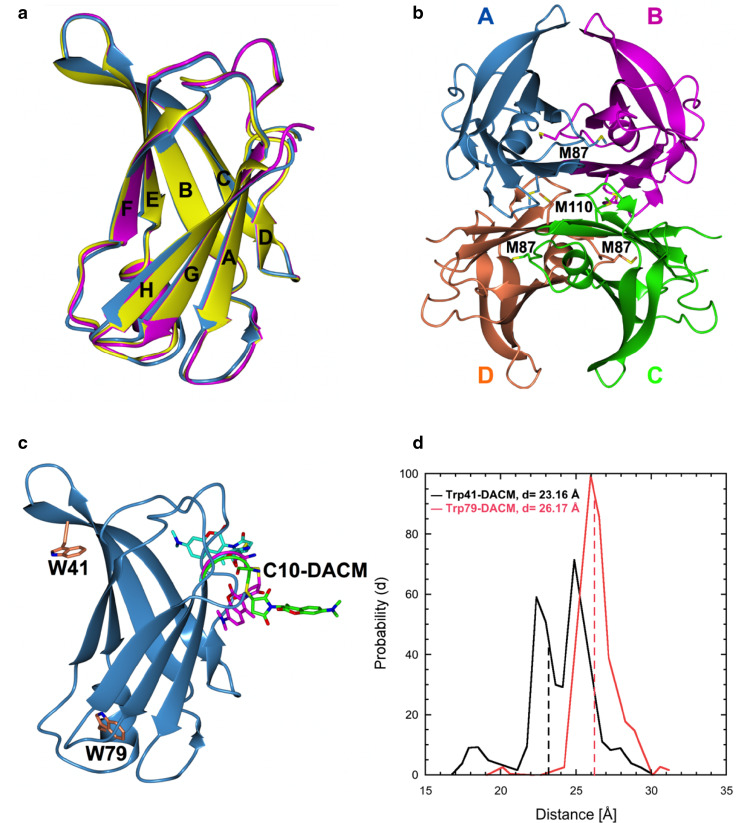
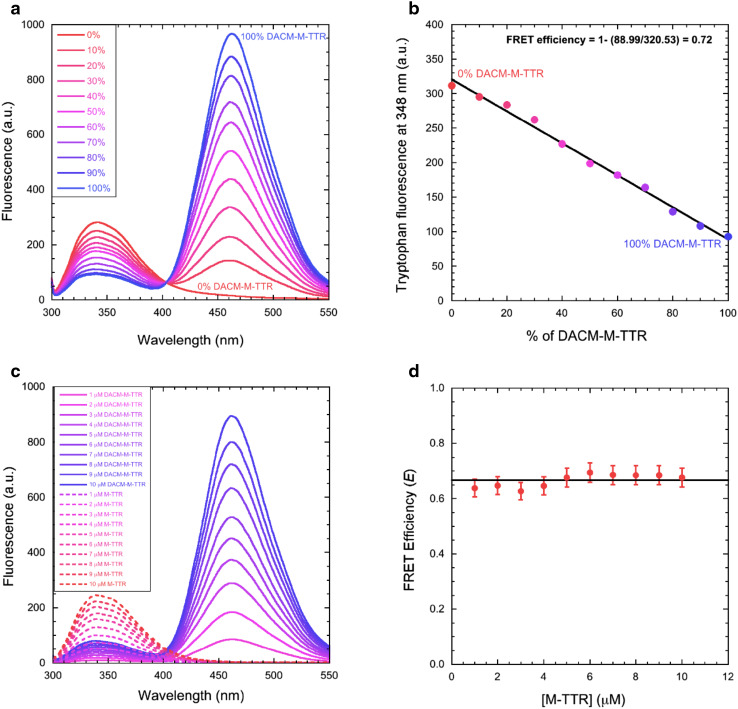
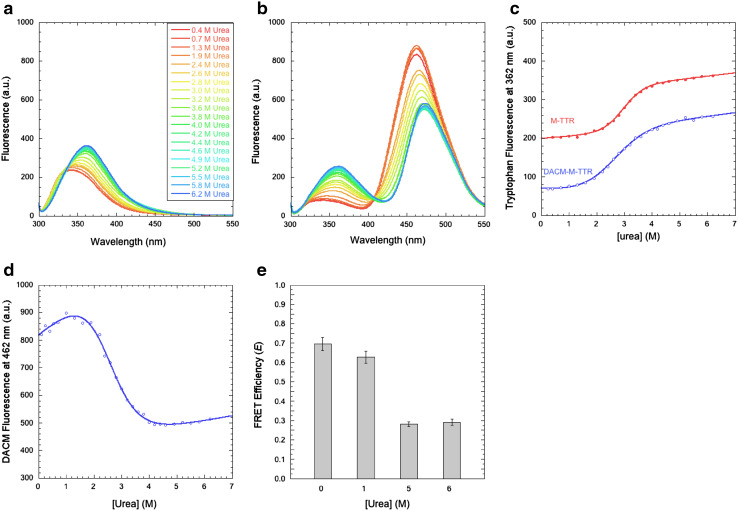
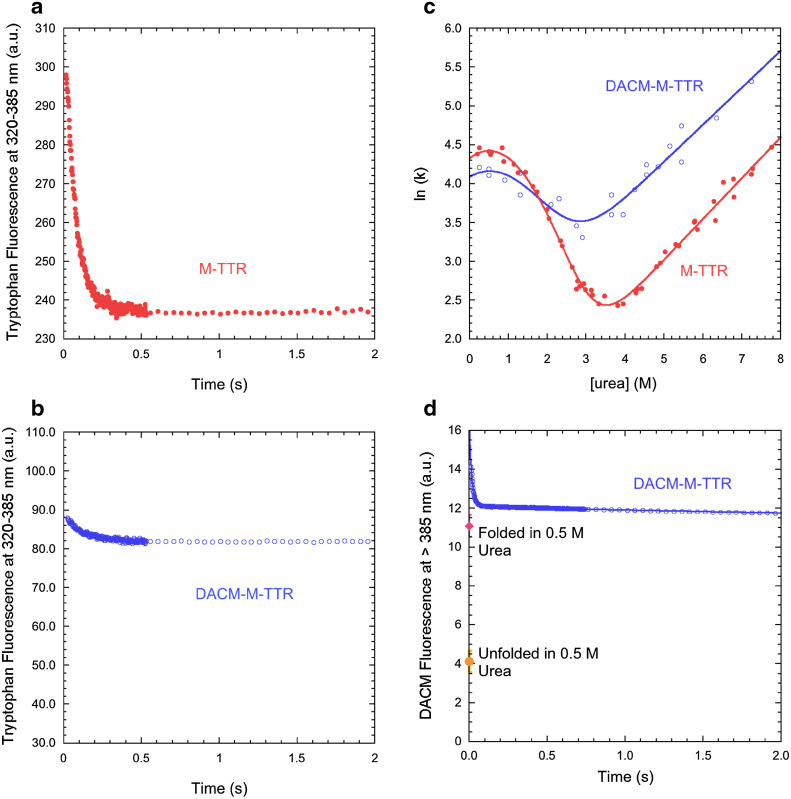
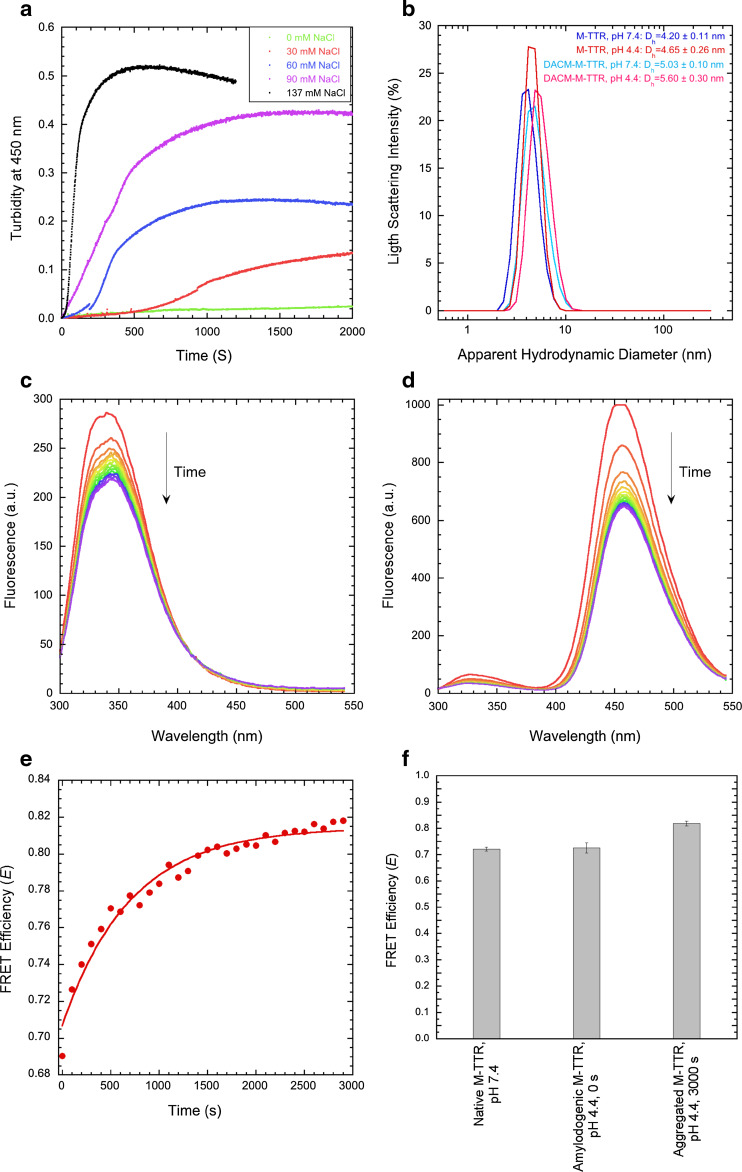
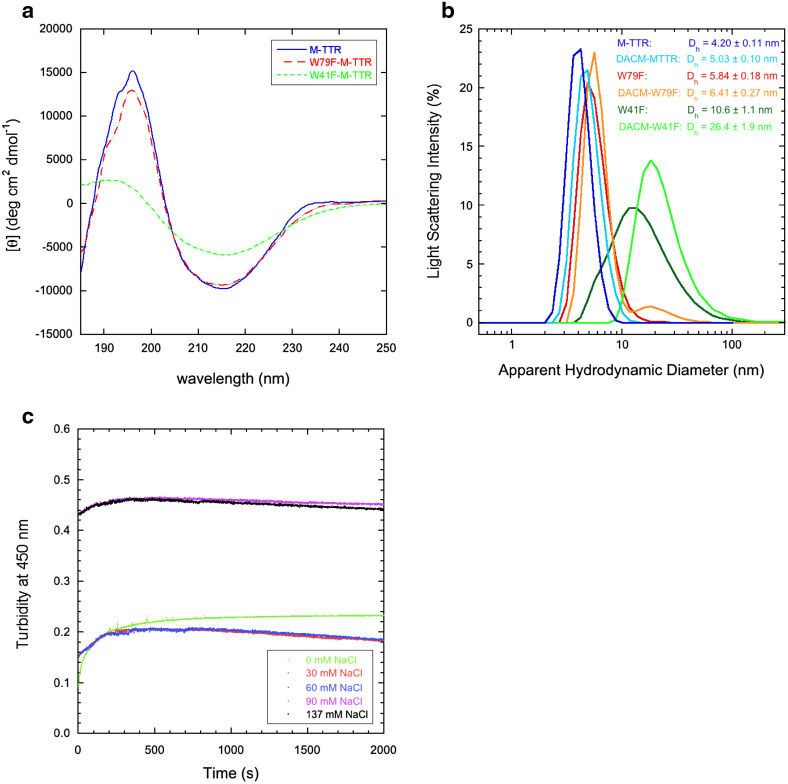
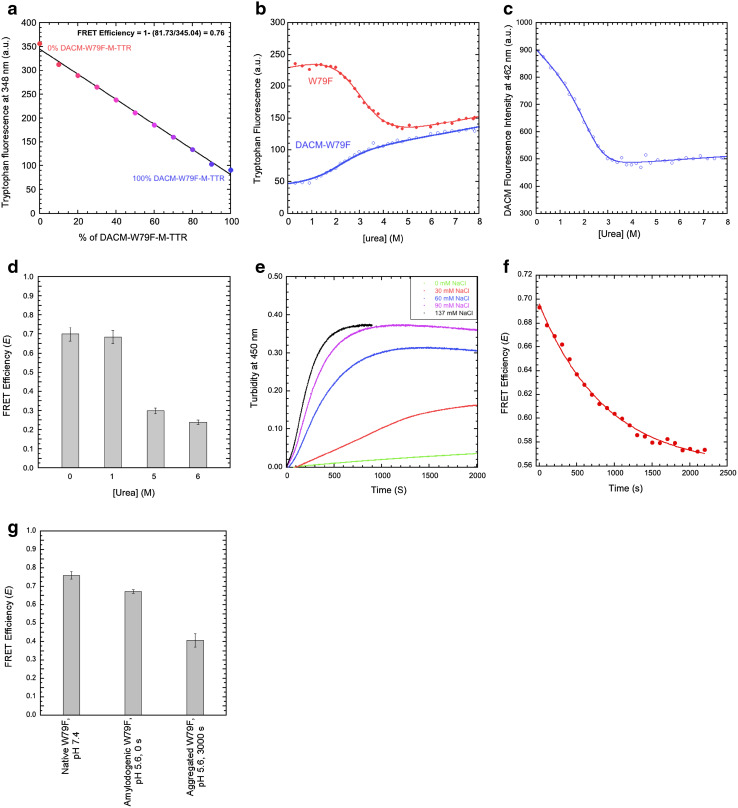
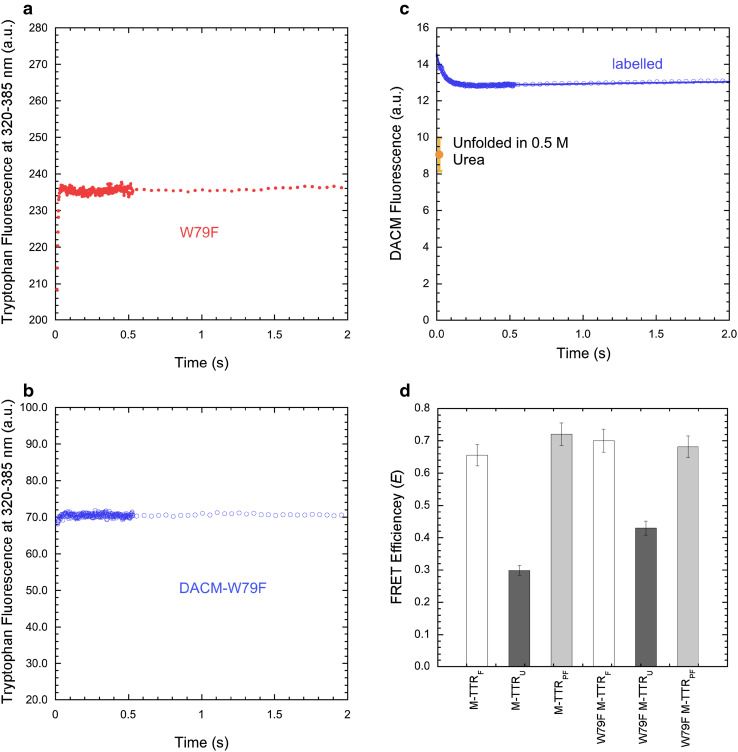
Transthyretin (TTR) is an extracellular protein able to deposit into well-defined protein aggregates called amyloid, in pathological conditions known as senile systemic amyloidosis, familial amyloid polyneuropathy, familial amyloid cardiomyopathy and leptomeningeal amyloidosis. At least three distinct partially folded states have been described for TTR, including the widely studied amyloidogenic state at mildly acidic pH. Here, we have used fluorescence resonance energy transfer (FRET) experiments in a monomeric variant of TTR (M-TTR) and in its W41F and W79F mutants, taking advantage of the presence of a unique, solvent-exposed, cysteine residue at position 10, that we have labelled with a coumarin derivative (DACM, acceptor), and of the two natural tryptophan residues at positions 41 and 79 (donors). Trp41 is located in an ideal position as it is one of the residues of β-strand C, whose degree of unfolding is debated. We found that the amyloidogenic state at low pH has the same FRET efficiency as the folded state at neutral pH in both M-TTR and W79F-M-TTR, indicating an unmodified Cys10-Trp41 distance. The partially folded state populated at low denaturant concentrations also has a similar FRET efficiency, but other spectroscopic probes indicate that it is distinct from the amyloidogenic state at acidic pH. By contrast, the off-pathway state accumulating transiently during refolding has a higher FRET efficiency, indicating non-native interactions that reduce the Cys10-Trp41 spatial distance, revealing a third distinct conformational state. Overall, our results clarify a negligible degree of unfolding of β-strand C in the formation of the amyloidogenic state and establish the concept that TTR is a highly plastic protein able to populate at least three distinct conformational states.

Keywords: FAC; FAP; Folding intermediate; Protein aggregation; Protein folding; Protein misfolding; SSA.


Figures

Fig. 1
Fig. 1
Labelling of M-TTR. a MALDI mass spectrometry analysis of M-TTR (red) and DACM-M-TTR (blue). The expected molecular weights for human M-TTR and DACM-M-TTR are 13,894.7 and 14,193.0, respectively. b Size distributions of M-TTR (blue), DACM-M-TTR (pale blue), WT-TTR (red) and DACM-WT-TTR (orange) samples obtained with DLS at pH 7.4, 25 °C. c Optical absorption spectra of DACM-M-TTR (blue) and DACM-GSH (green) at pH 7.4, 25 °C and at the same probe concentration. The difference spectrum obtained by subtracting the latter from the former is also shown (red). d Fluorescence spectra of M-TTR (red), DACM-M-TTR (blue) and DACM-GSH (green) at pH 7.4, 25 °C (excitation 290 nm)
Fig. 2
Fig. 2
X-ray crystal structures of DACM-M-TTR and DACM-WT-TTR. a Superposition of the structures of DACM-M-TTR (blue), DACM-WT-TTR (magenta) and WT-TTR (yellow, pdb code: 1BMZ [43]). b Tetrameric structure of DACM-M-TTR. The residues Met87 and Met110, that destabilize the tetrameric structure in solution, are shown as sticks. c MD simulations of DACM-M-TTR: Trp41, Trp79 and the most populated conformation of Cys10-DACM are shown as sticks. d Distributions of the spatial distances between the centers of mass of Trp41 and DACM (black) and those of Trp79 and DACM (red), calculated using MD simulations starting from the crystal structure of DACM-M-TTR. The dashed lines indicate the mean spatial distances assuming a single average conformer for the DACM moiety
Fig. 3
Fig. 3
FRET of native M-TTR. a Fluorescence spectra of mixtures of M-TTR and DACM-M-TTR at the indicated percentages of the latter, at 3 µM total protein concentration, pH 7.4, 25 °C. b Tryptophan fluorescence emission at 348 nm versus the percentage of DACM-M-TTR. The straight line represents the best fit of the data points to a linear function. The equation indicates how E was determined. c Fluorescence spectra of M-TTR (dashed lines) and DACM-M-TTR (continuous lines) at various protein concentrations ranging from 1 to 10 µM, pH 7.4, 25 °C (excitation 290 nm). d Plot of E versus M-TTR concentration. The straight line represents the average value
Fig. 4
Fig. 4
FRET of urea-unfolded and molten globule states of M-TTR. a, b Fluorescence spectra of M-TTR (a) and DACM-M-TTR (b) at urea concentrations ranging from 0 to 6.2 M at pH 7.4, 25 °C (excitation 290 nm). c Urea denaturation curves (spectroscopic signal versus urea concentration) using tryptophan fluorescence at 362 nm as a spectroscopic probe for both M-TTR and DACM-M-TTR. d Urea denaturation curve of DACM-M-TTR, using DACM fluorescence at 462 nm as a spectroscopic probe. e FRET E values at the indicated urea concentrations, pH 7.4, 25 °C
Fig. 5
Fig. 5
FRET during M-TTR refolding. a, b Refolding time course of M-TTR (red filled circles) and DACM-M-TTR (blue open circles) monitored by tryptophan fluorescence (excitation 290 nm, emission 320–385 nm) in 0.5 M urea at pH 7.4, 25 °C. c Natural logarithm of the observed folding/unfolding microscopic rate constants for DACM-M-TTR (blue open circles) compared to data previously published for M-TTR (red filled circles) [28], plotted as a function of urea concentration (chevron plot), at pH 7.4, 25 °C. d Refolding time course of DACM-M-TTR (blue open circles) monitored by DACM fluorescence (excitation 290 nm, emission >385 nm) in 0.5 M urea at pH 7.4, 25 °C. The signals of folded and unfolded DACM-M-TTR are also indicated
Fig. 6
Fig. 6
FRET of the amyloidogenic and aggregated states of M-TTR. a Effect of different NaCl concentrations on the kinetics of 15 µM DACM-M-TTR aggregation in 20 mM acetate buffer, pH 4.4, 37 °C, monitored with turbidimetry at 450 nm. b DLS size distributions of M-TTR and DACM-M-TTR at both pH 7.4 and 4.4. c, d Fluorescence spectra at different time points for M-TTR (c) and DACM-M-TTR (d) in 20 mM acetate buffer, 30 mM NaCl, pH 4.4, 37 °C. e Change of E during aggregation. Conditions as in c, d. f FRET E values for native M-TTR at pH 7.4, 25 °C (first bar), amyloidogenic monomeric M-TTR at pH 4.4, 37 °C, 0 s (second bar) and aggregated M-TTR at pH 4.4, 37 °C, 3000 s (third bar)
Fig. 7
Fig. 7
Structural and aggregation properties of W41F and W79F-M-TTR mutants. a Far-UV CD spectra of the non-mutated and mutant forms of M-TTR obtained in 20 mM phosphate buffer, pH 7.4, 25 °C. b Size distributions by DLS of unlabelled and labelled non-mutated, W79F- and W41F-M-TTR at pH 7.4, 25 °C. c Aggregation time courses of W41F-M-TTR at pH 7.4, 37 °C in the presence of 0–137 mM NaCl
Fig. 8
Fig. 8
FRET of W79F-M-TTR under different conditions. a Tryptophan fluorescence emission at 348 nm versus the percentage of DACM-W79F-M-TTR, at pH 7.4, 25 °C. The straight line represents the best fit of the data points to a linear function. b Urea denaturation curves (spectroscopic signal versus urea concentration at equilibrium) using tryptophan fluorescence at 330 and 365 nm as a spectroscopic probe for W79F-M-TTR and DACM-W79F-M-TTR, respectively, pH 7.4, 25 °C. c Urea denaturation curve of DACM-W79F-M-TTR, using DACM fluorescence at 462 nm as a spectroscopic probe, pH 7.4, 25 °C. d FRET E values at the indicated urea concentrations. e Effect of different NaCl concentrations on the kinetics of 15 µM DACM-W79F-M-TTR aggregation in 20 mM acetate buffer, pH 5.6, 37 °C, monitored with turbidimetry at 450 nm. f FRET E during aggregation. Conditions were 20 mM acetate buffer, 30 mM NaCl, pH 5.6, 37 °C. g FRET E values for native W79F-M-TTR at pH 7.4 (first bar), amyloidogenic monomeric W79F-M-TTR at pH 5.6, 0 s (second bar) and aggregated W79F-M-TTR at pH 5.6, 3000 s (third bar)
Fig. 9
Fig. 9
RET of W79F-M-TTR during refolding. a, b Refolding time course of W79F-M-TTR (red filled circles) and DACM-W79F-M-TTR (blue open circles) monitored by tryptophan fluorescence (excitation 290 nm, emission 320–385 nm) in 0.5 M urea at pH 7.4, 25 °C. c Refolding time course of DACM-W79F-M-TTR (blue open circles) monitored by DACM fluorescence (excitation 290 nm, emission >385 nm) in 0.5 M urea at pH 7.4, 25 °C. d Comparison between the FRET E values calculated, from the spectroscopic data, for the folded (F), unfolded (U) and partially folded (PF) states of M-TTR and W79F-M-TTR in 0.5 M urea at pH 7.4, 25 °C

References

    1. Soprano DR, Herbert J, Soprano KJ, Schon EA, Goodman DS. Demonstration of transthyretin mRNA in the brain and other extrahepatic tissues in the rat. J Biol Chem. 1985;260(21):11793–11798. - PubMed
    1. Stauder AJ, Dickson PW, Aldred AR, Schreiber G, Mendelsohn FA, Hudson P. Synthesis of transthyretin (pre-albumin) mRNA in choroid plexus epithelial cells, localized by in situ hybridization in rat brain. J Histochem Cytochem. 1986;34(7):949–952. doi: 10.1177/34.7.3458812. - DOI - PubMed
    1. Herbert J, Wilcox JN, Pham KT, Fremeau RT, Jr, Zeviani M, Dwork A, Soprano DR, Makover A, Goodman DS, Zimmerman EA, et al. Transthyretin: a choroid plexus-specific transport protein in human brain. The 1986 S. Weir Mitchell award. Neurology. 1986;36(7):900–911. doi: 10.1212/WNL.36.7.900. - DOI - PubMed
    1. Jacobsson B. Localization of transthyretin-mRNA and of immunoreactive transthyretin in the human fetus. Virchows Arch A Pathol Anat Histopathol. 1989;415(3):259–263. doi: 10.1007/BF00724913. - DOI - PubMed
    1. Jacobsson B, Collins VP, Grimelius L, Pettersson T, Sandstedt B, Carlstrom A. Transthyretin immunoreactivity in human and porcine liver, choroid plexus, and pancreatic islets. J Histochem Cytochem. 1989;37(1):31–37. doi: 10.1177/37.1.2642294. - DOI - PubMed

Publication types

LinkOut - more resources