

Identifying distinct risk profiles to predict adverse events among community-dwelling older adults
- PMID: 28479081
- PMCID: PMC5991797
- DOI: 10.1016/j.gerinurse.2017.03.013
Identifying distinct risk profiles to predict adverse events among community-dwelling older adults
Abstract
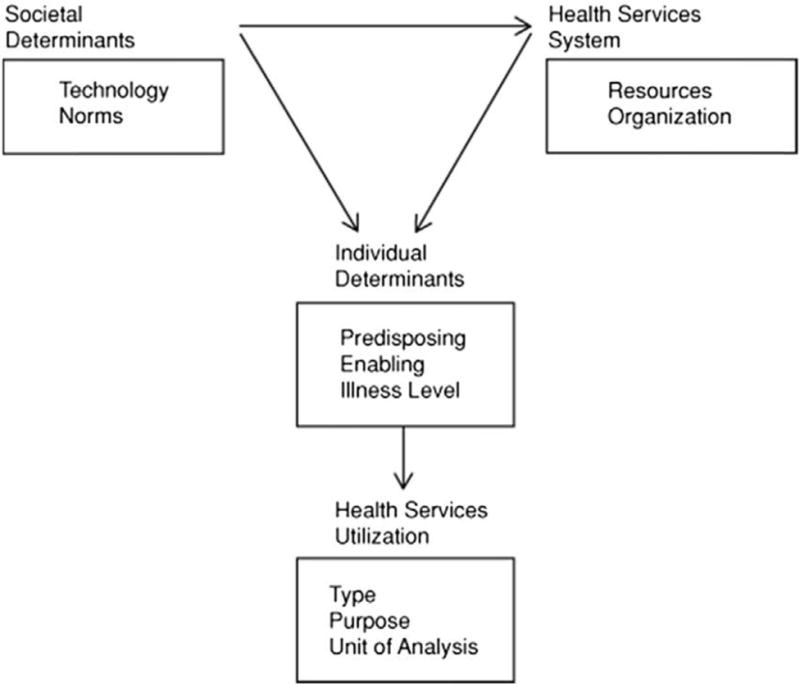
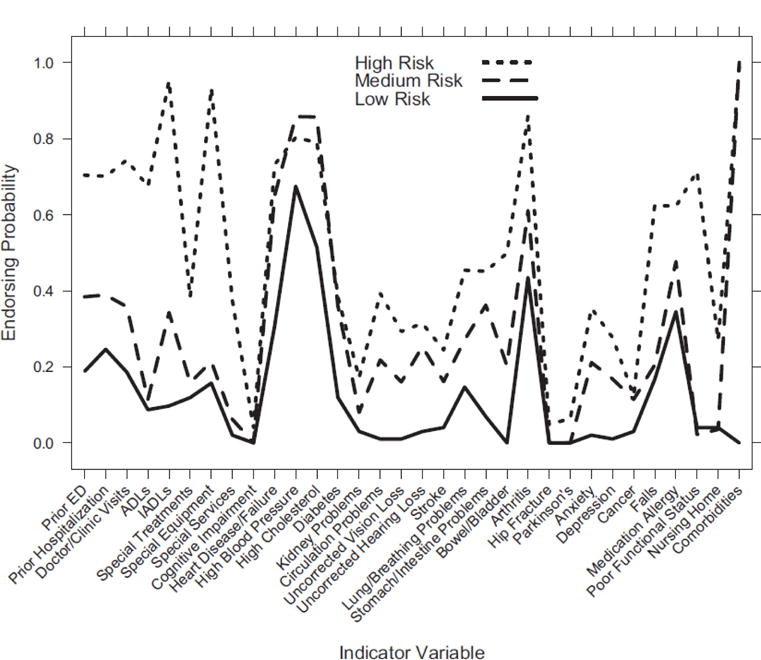
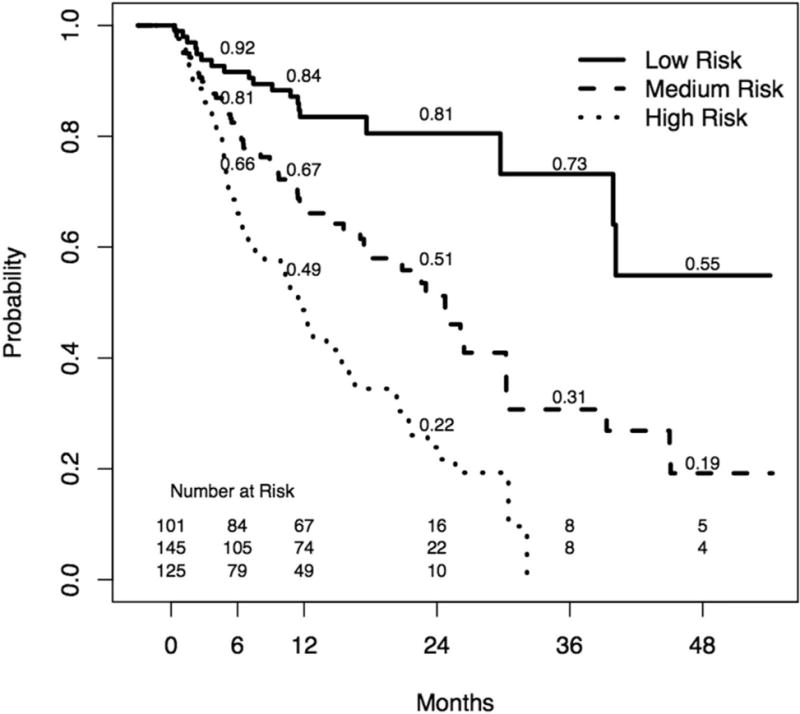
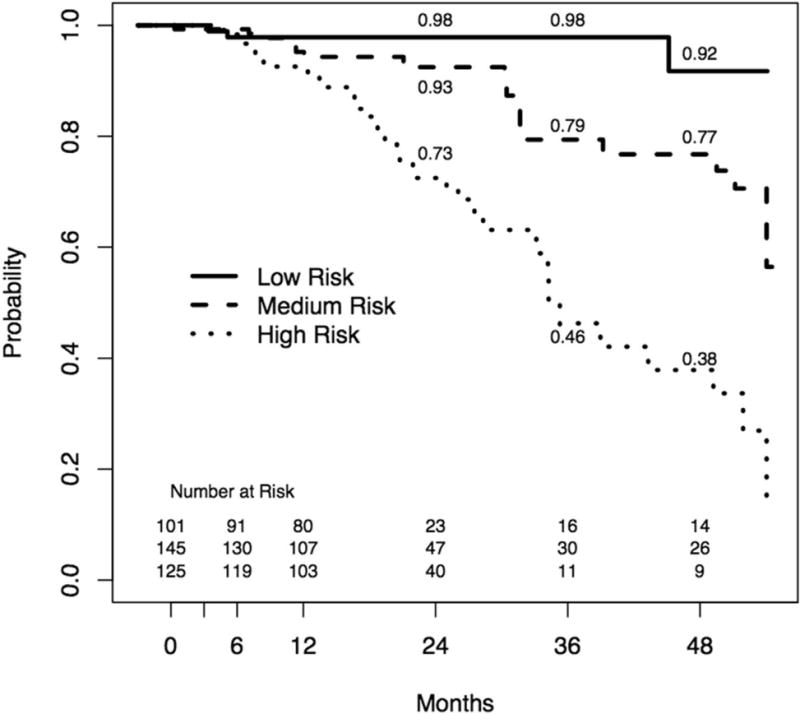
Preventing adverse events among chronically ill older adults living in the community is a national health priority. The purpose of this study was to generate distinct risk profiles and compare these profiles in time to: hospitalization, emergency department (ED) visit or death in 371 community-dwelling older adults enrolled in a Medicare demonstration project. Guided by the Behavioral Model of Health Service Use, a secondary analysis was conducted using Latent Class Analysis to generate the risk profiles with Kaplan Meier methodology and log rank statistics to compare risk profiles. The Vuong-Lo-Mendell-Rubin Likelihood Ratio Test demonstrated optimal fit for three risk profiles (High, Medium, and Low Risk). The High Risk profile had significantly shorter time to hospitalization, ED visit, and death (p < 0.001 for each). These findings provide a road map for generating risk profiles that could enable more effective targeting of interventions and be instrumental in reducing health care costs for subgroups of chronically ill community-dwelling older adults.
Keywords: Chronic illness; Community-dwelling older adults; Latent class analysis; Nurse care management model; Risk profiles.
Copyright © 2017 Elsevier Inc. All rights reserved.
Figures

References
-
- Anderson G. Chronic conditions: making the case for ongoing care. 2010 http://www.rwjf.org/content/dam/farm/reports/reports/2010/rwjf54583/ Accessed 16 September 2012.
-
- United States Census Bureau. An aging nation: the older population in the United States, population estimates and projections. 2015 http://www.census.gov/prod/2014pubs/p251140.pdf/ Accessed 16 September 2015.
-
- Centers for Medicare and Medicaid Services. Chronic Conditions Among Medicare Beneficiaries, Chartbook. Baltimore, MD: 2012. 2012 Edition. http://www.cms.gov/Research-Statistics-Data-and-Systems/Statistics-Trend... Accessed 16 September 2015.
-
- Naylor MD, Aiken LH, Kurtzman ET, Olds DM, Hirschman KB. The importance of transitional care in achieving health reform. Health Aff. 2011;30(4):746–754. - PubMed
-
- Naylor MD, Hirschman KB, O’Connor M, Barg R, Pauly MV. Engaging older adults in their transitional care: what more needs to be done? J Comp Eff Res. 2013;2(5):457–468. - PubMed
MeSH terms
Grants and funding
LinkOut - more resources
Full Text Sources
Other Literature Sources
Medical
